1796
Higher b-value diffusion improves correlation with cortical myelin content
Sandy Mournet1,2, Gosuke Okubo1,2,3, Ismail Koubiyr1,2, Valentin H Prevost4, Clémence Bal2, Bei Zhang5, Hiroshi Kusahara 4, Nobuyasu Ichinose4, Bruno Triaire4, Bassem Hiba6, Vincent Dousset1,2,7, and Thomas Tourdias1,2,7
1Neurocentre Magendie, INSERM U1215, Bordeaux, France, 2Université de Bordeaux, Bordeaux, France, 3Department of Radiology, Tenri Hospital, Nara, Japan, 4Canon Medical Systems Corporation, Otawara, Japan, 5Canon Medical systems Europe, Paris, France, 6Centre de neuroscience cognitive, CNRS UMR 5229, Université Claude Bernard Lyon, Lyon, France, 7Neuroimagerie diagnostique et thérapeutique, CHU de Bordeaux, Bordeaux, France
1Neurocentre Magendie, INSERM U1215, Bordeaux, France, 2Université de Bordeaux, Bordeaux, France, 3Department of Radiology, Tenri Hospital, Nara, Japan, 4Canon Medical Systems Corporation, Otawara, Japan, 5Canon Medical systems Europe, Paris, France, 6Centre de neuroscience cognitive, CNRS UMR 5229, Université Claude Bernard Lyon, Lyon, France, 7Neuroimagerie diagnostique et thérapeutique, CHU de Bordeaux, Bordeaux, France
Synopsis
In diffusion MRI, the use of very high b-value remains very challenging. In this study, we scanned 9 volunteers with a protocol of dMRI sequences using b values from 1000 to 5000 s/mm². We compared cortical surface map of myelin (T1wi/T2wi) to maps of mean diffusivity (MD) computed from each b value. As opposed to b1000 s/mm², MD maps from b3000 and b5000 inversely mirrored the myelin maps. With increasing b-values, multiple regression models confirmed an increasing negative association between myelin and MD. The MD obtained with high b-value is sensitive to subtle cellular variations such as the cortical myeloarchitecture.
Introduction
Diffusion MRI (dMRI) at high b-values might be sensitive to cellular modifications. But how much increase of b-value is conveying additional biological meaning remains unclear. This work aims to determine the impact of very high b-values on DTI metrics measured within the cortex and studies how much the b-values increase is helpful to capture changes in tissue microstructure as assessed by the cortical myelination from the T1WI/T2WI map.Materials and methods
We scanned a set of 9 healthy volunteers with the dedicated protocol at 3 increasing b-values of 1000, 3000 and 5000 s/mm2 together with T1-WI and T2-WI. Averaged maps across the 9 subjects superimposed to surface were obtained for estimated myelin content, cortical thickness, mean diffusivity (MD) and fractional anisotropy (FA). We used the Human connectome project (HCP) multi-modal parcellation version 1.0 (HCP_MMP1.0 210P MPM version)1 to separate 180 cortical parcels by hemisphere and to measured mean values in each parcel of the averaged. Averaged cortical surface map of myelin (T1-WI/T2-WI) was compared to surface maps of MD computed from each b-value (named MD1000, MD3000 and MD5000) in 360 cortical parcels using Spearman correlations, multiple linear regressions and Akaike information criteria (AIC).Results
Surface MD maps averaged across the 9 subjects are first presented in Figure-1. From a qualitative inspection, we found that MD values progressively decreased with b-values, which was expected2 (Figure-1a). Interestingly, when window/level was adjusted individually, variations of MD values were observed from one cortical area to another with different patterns according to b-values (Figure-1b).Figure-2 displays the lateral and medial views of the same inflated averaged surface maps in which the boundaries from the HCP parcellation have been overlaid. It showed that MD3000 and MD5000 maps inversely mirrored myelin map. Overall, MD3000-or-5000 appeared low in high myelinated cortical areas (such as the primary motor cortex, the primary auditory cortex or the primary visual cortex) whereas MD3000-or-5000 appeared high in less myelinated cortical areas (such as the fronto-polar cortex). However, this pattern was not found on MD1000 maps in which higher MD values were mainly detected within the thinnest cortical parcels (such as the primary somatosensory cortex 3b). To illustrate this observation, the normalized signal was plotted versus b-value in a highly myelinated parcel (primary motor cortex) and in a lightly myelinated parcel (fronto-polar cortex) in figure 2-f. The curves showed that signal decay was similar between the 2 regions at b=1000s/mm², which implies an absence of contrast on MD1000 maps, while dissociation of the two curves was observed at b=3000s/mm² and even more at b=5000s/mm². We observed a negative correlation between estimated myelin and MD that became stronger as long as b-value increased with Spearman’s rank correlation rho=-0.112 (p=0.03), -0.508 (p< 0.001), and -0.518 (p< 0.001) for MD1000, MD3000 and MD5000 respectively. Concerning MD and cortical thickness, we found a negative correlation for MD1000 (rho=-0.228; p< 0.001) while positive and weaker correlations were found for MD3000 and MD5000 (rho=0.131, p< 0.001; and 0.174, p< 0.001 respectively).
Because cortical thickness and myelin content are correlated, we performed multiple regression statistical models to be unsensitive to the cortical thickness confounding factor. We obtained a significant improvement of the adjusted R² between myelin and MD from MD1000 to MD3000 and MD5000 (R²=0.33, p<0.001; R²=0.43, p<0.001; and R²=0.50, p<0.001) with regression coefficients β that became more and more negative (figure 3). Comparisons of the 3 models showed better performances with MD5000 (AICMD5000< AICMD3000 < AICMD1000).
Discussion
The current study found that increasing b-values incrementally improves the sensitivity of MD fitted from a DTI model to capture the fine variations of cortical myelin content. A complexity with high b-values is that diffusion becomes non-Gaussian3,4. A large number of alternatives to the DTI model has been developed to address the high b-value component, and many of them showed an improved sensitivity compared to DTI model at standard b-value to capture microstructural alterations associated with different conditions3,4. However, these methods all require collecting multiple shells to fit the signal which limits their dissemination because of scan time constraint. Interestingly, we used a simple DTI model to fit the data even if DTI-assumption of Gaussian distribution of the diffusion probability is violated at high b-value. However, such model is efficient and robust and the decrease of cortical MD that we observed along b-values, as reported by others5 is accounted for by the non-monoexponentiality of the signal driven by slow moving water molecules. Thus, even if this approach cannot comprehensively characterize the signal, we showed it could be sensitive enough even in grey matter.Conclusion
The current study found that increasing b-values from standard (1000 s/mm²) to high (3000 s/mm²), and up to very high values (5000 s/mm²), incrementally improves the sensitivity of MD fitted from a DTI model to capture the fine variations of cortical myelin content. The averaged surface maps of MD seemed to inversely mirror the averaged myelin map (assessed by T1-WI/T2-WI) more and more strikingly as long as b-values increased. Finally, we confirmed a significant improvement of the adjusted R2 between myelin and MD with a maximum for MD5000.Acknowledgements
No acknowledgement found.References
- Glasser MF, Coalson TS, Robinson EC, et al. A multi-modal parcellation of human cerebral cortex. Nature 2016;536:171-178
- Hui ES, Cheung MM, Chan KC, et al. B-value dependence of DTI quantitation and sensitivity in detecting neural tissue changes. Neuroimage 2010;49:2366-2374
- De Santis S, Gabrielli A, Palombo M, et al. Non-Gaussian diffusion imaging: a brief practical review. Magn Reson Imaging 2011;29:1410-1416
- Hui ES, Cheung MM, Qi L, et al. Towards better MR characterization of neural tissues using directional diffusion kurtosis analysis. Neuroimage 2008;42:122-134
- Ganepola T, Nagy Z, Ghosh A, et al. Using diffusion MRI to discriminate areas of cortical grey matter. Neuroimage 2018;182:456-468
Figures
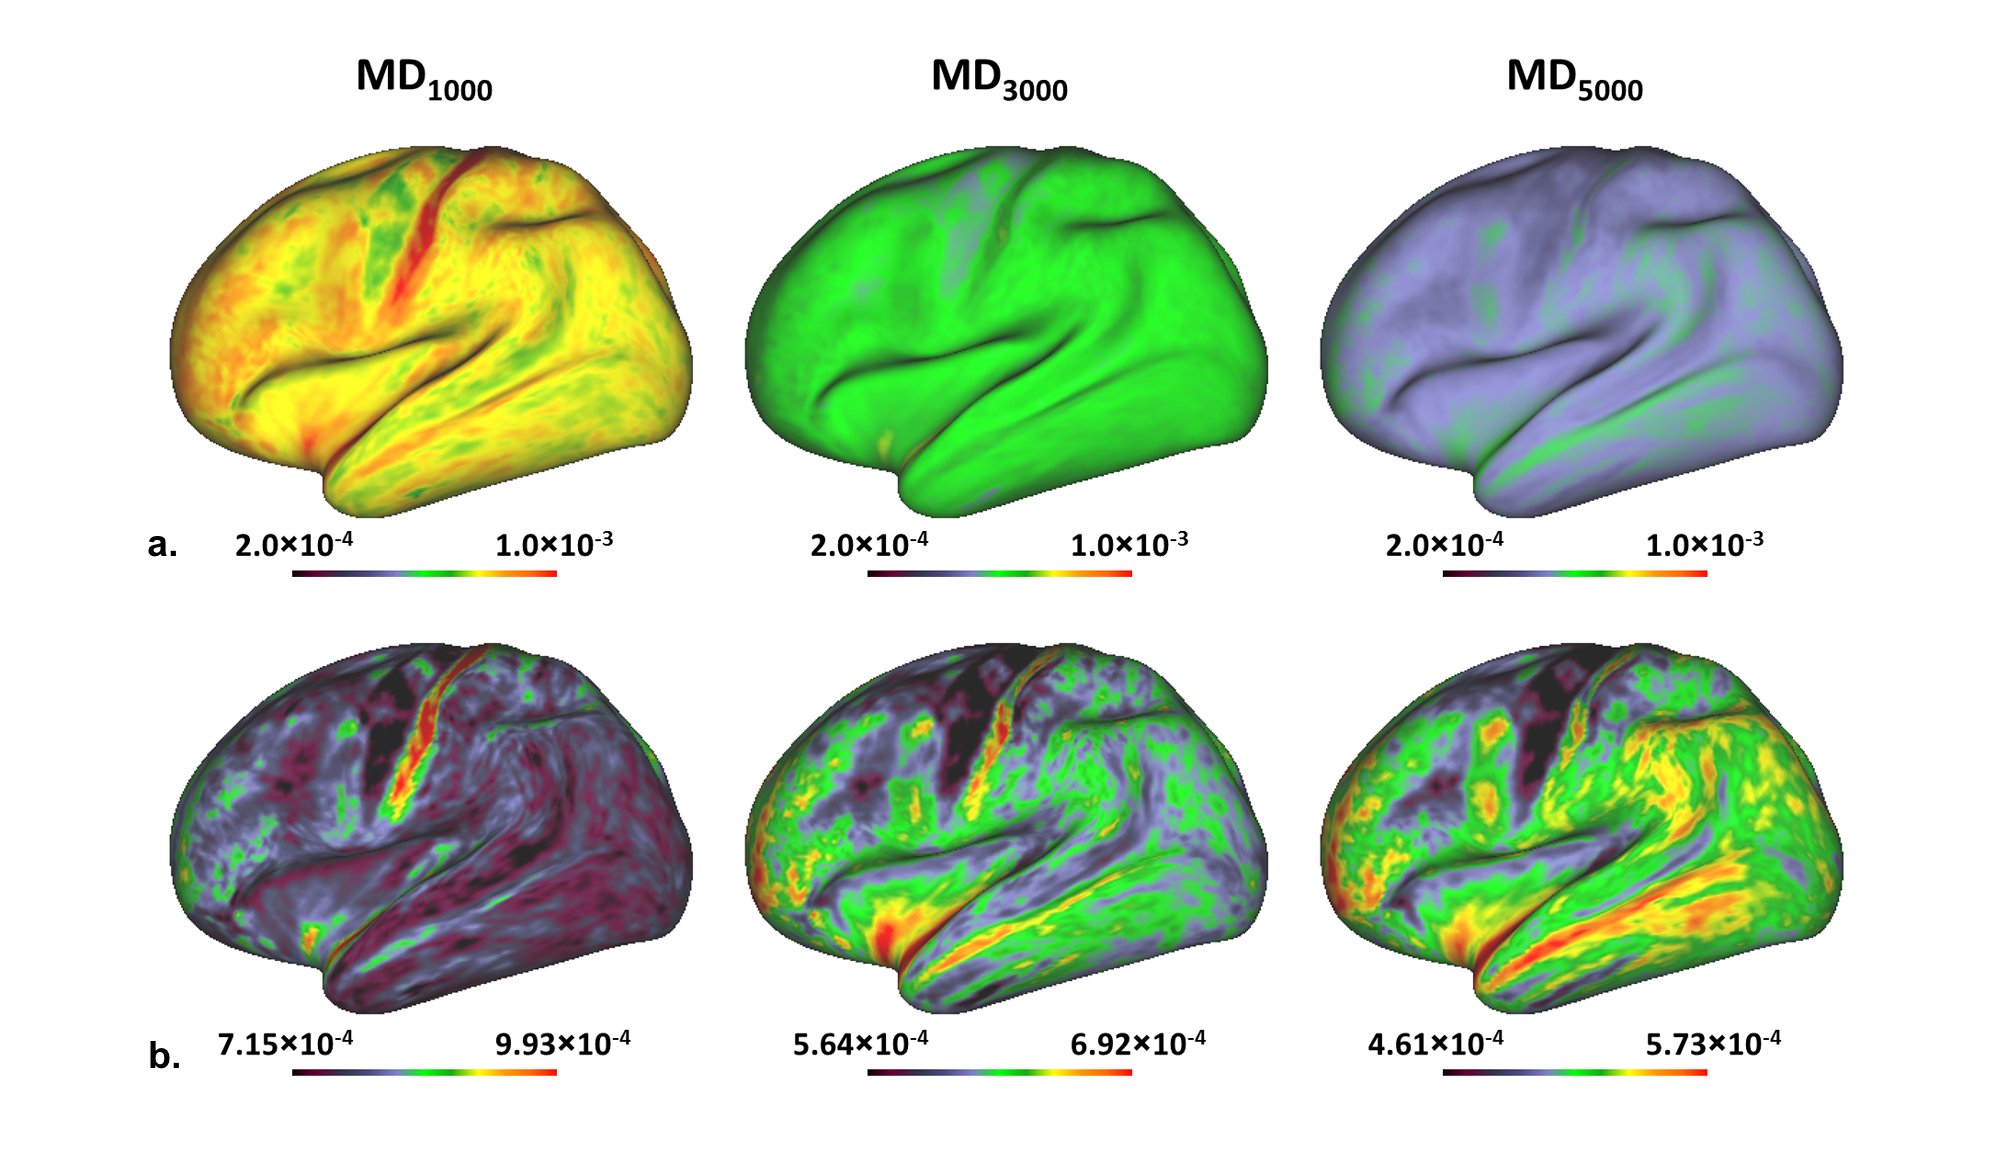
Figure 1: Cortical surface maps averaged across the 9 subjects
for MD1000, MD3000 and MD5000 showing a
progressive decrease of MD along b-values (a) but also, when
window/level was adjusted individually, variations of MD values from one
cortical area to another with different patterns according to b-values (b).
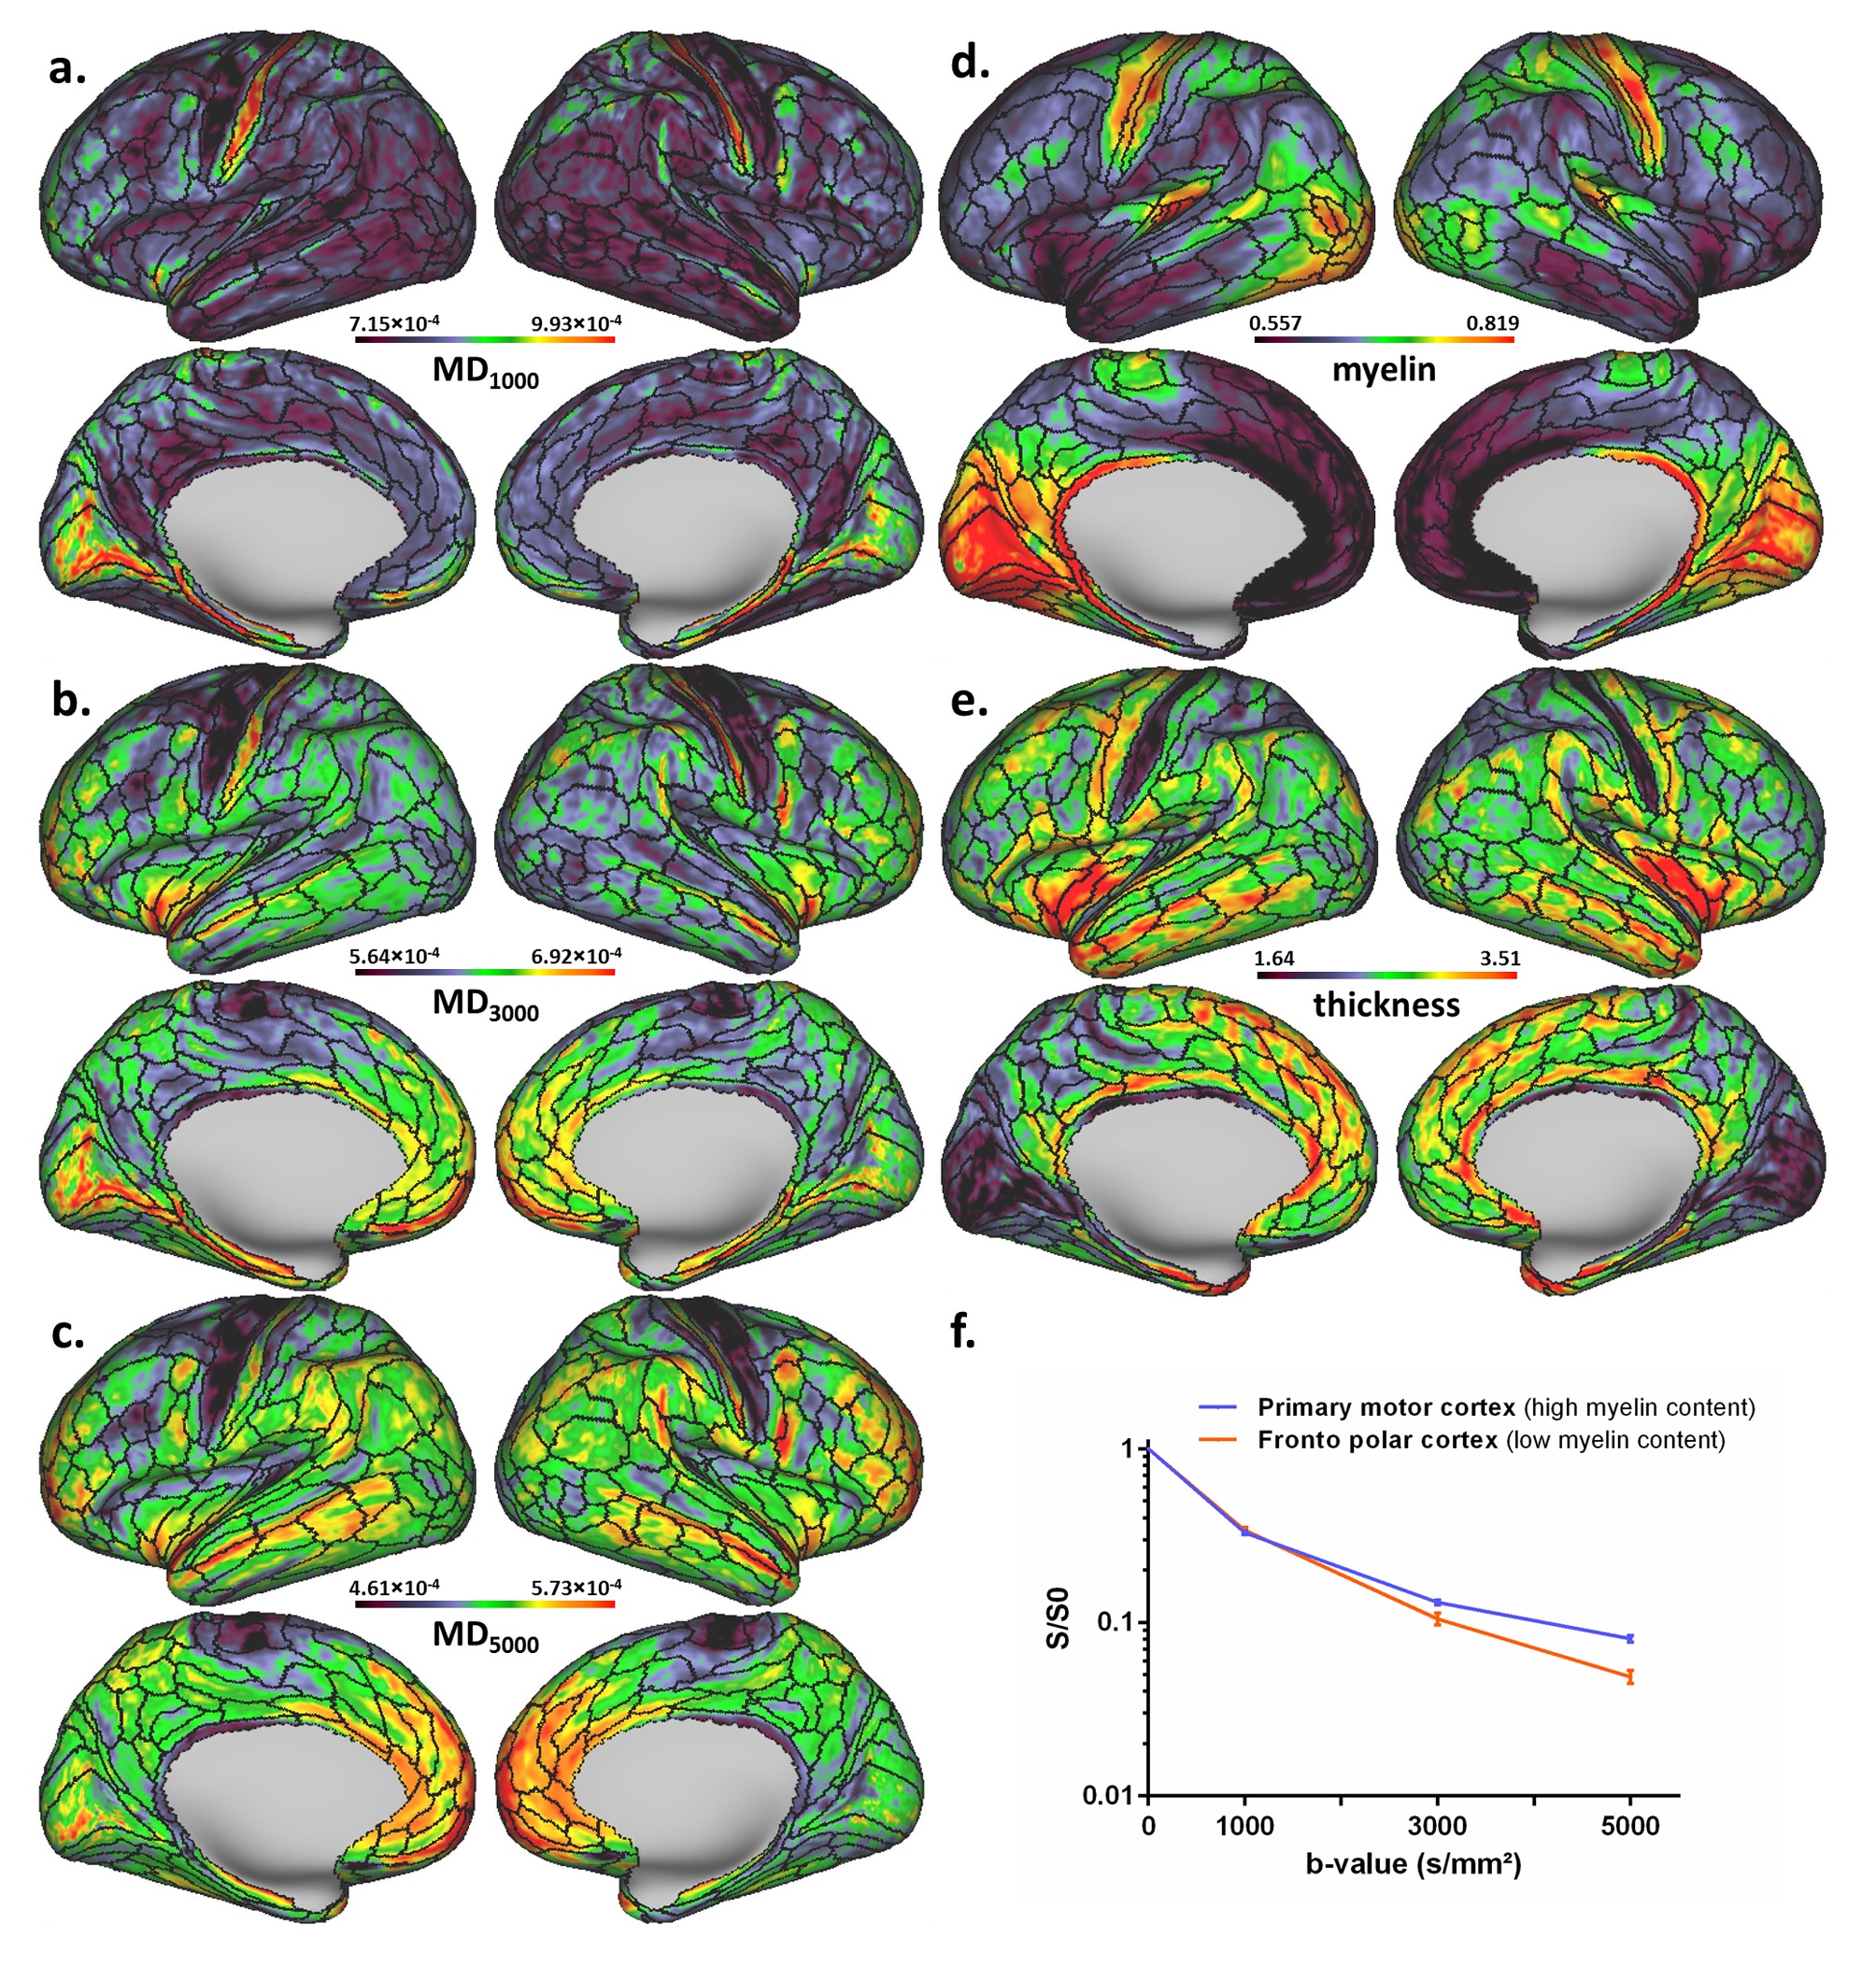
Figure 2: Cortical surface maps averaged across the 9 subjects for (a) MD1000, (b) MD3000, (c) MD5000, (d) estimated myelin content as
assessed by T1-WI/T2-WI and (e)
cortical thickness. Black lines indicate the boundaries of the HCP multi-modal
parcellation. In (f) the logarithm
of the mean signal along the 30 directions, normalized to b0, is showed for the
highly myelinated parcel corresponding to the primary motor cortex (blue) and
the lightly myelinated parcel corresponding to the fronto-polar cortex (red).
Error bars indicate standard deviation along the 30 directions.
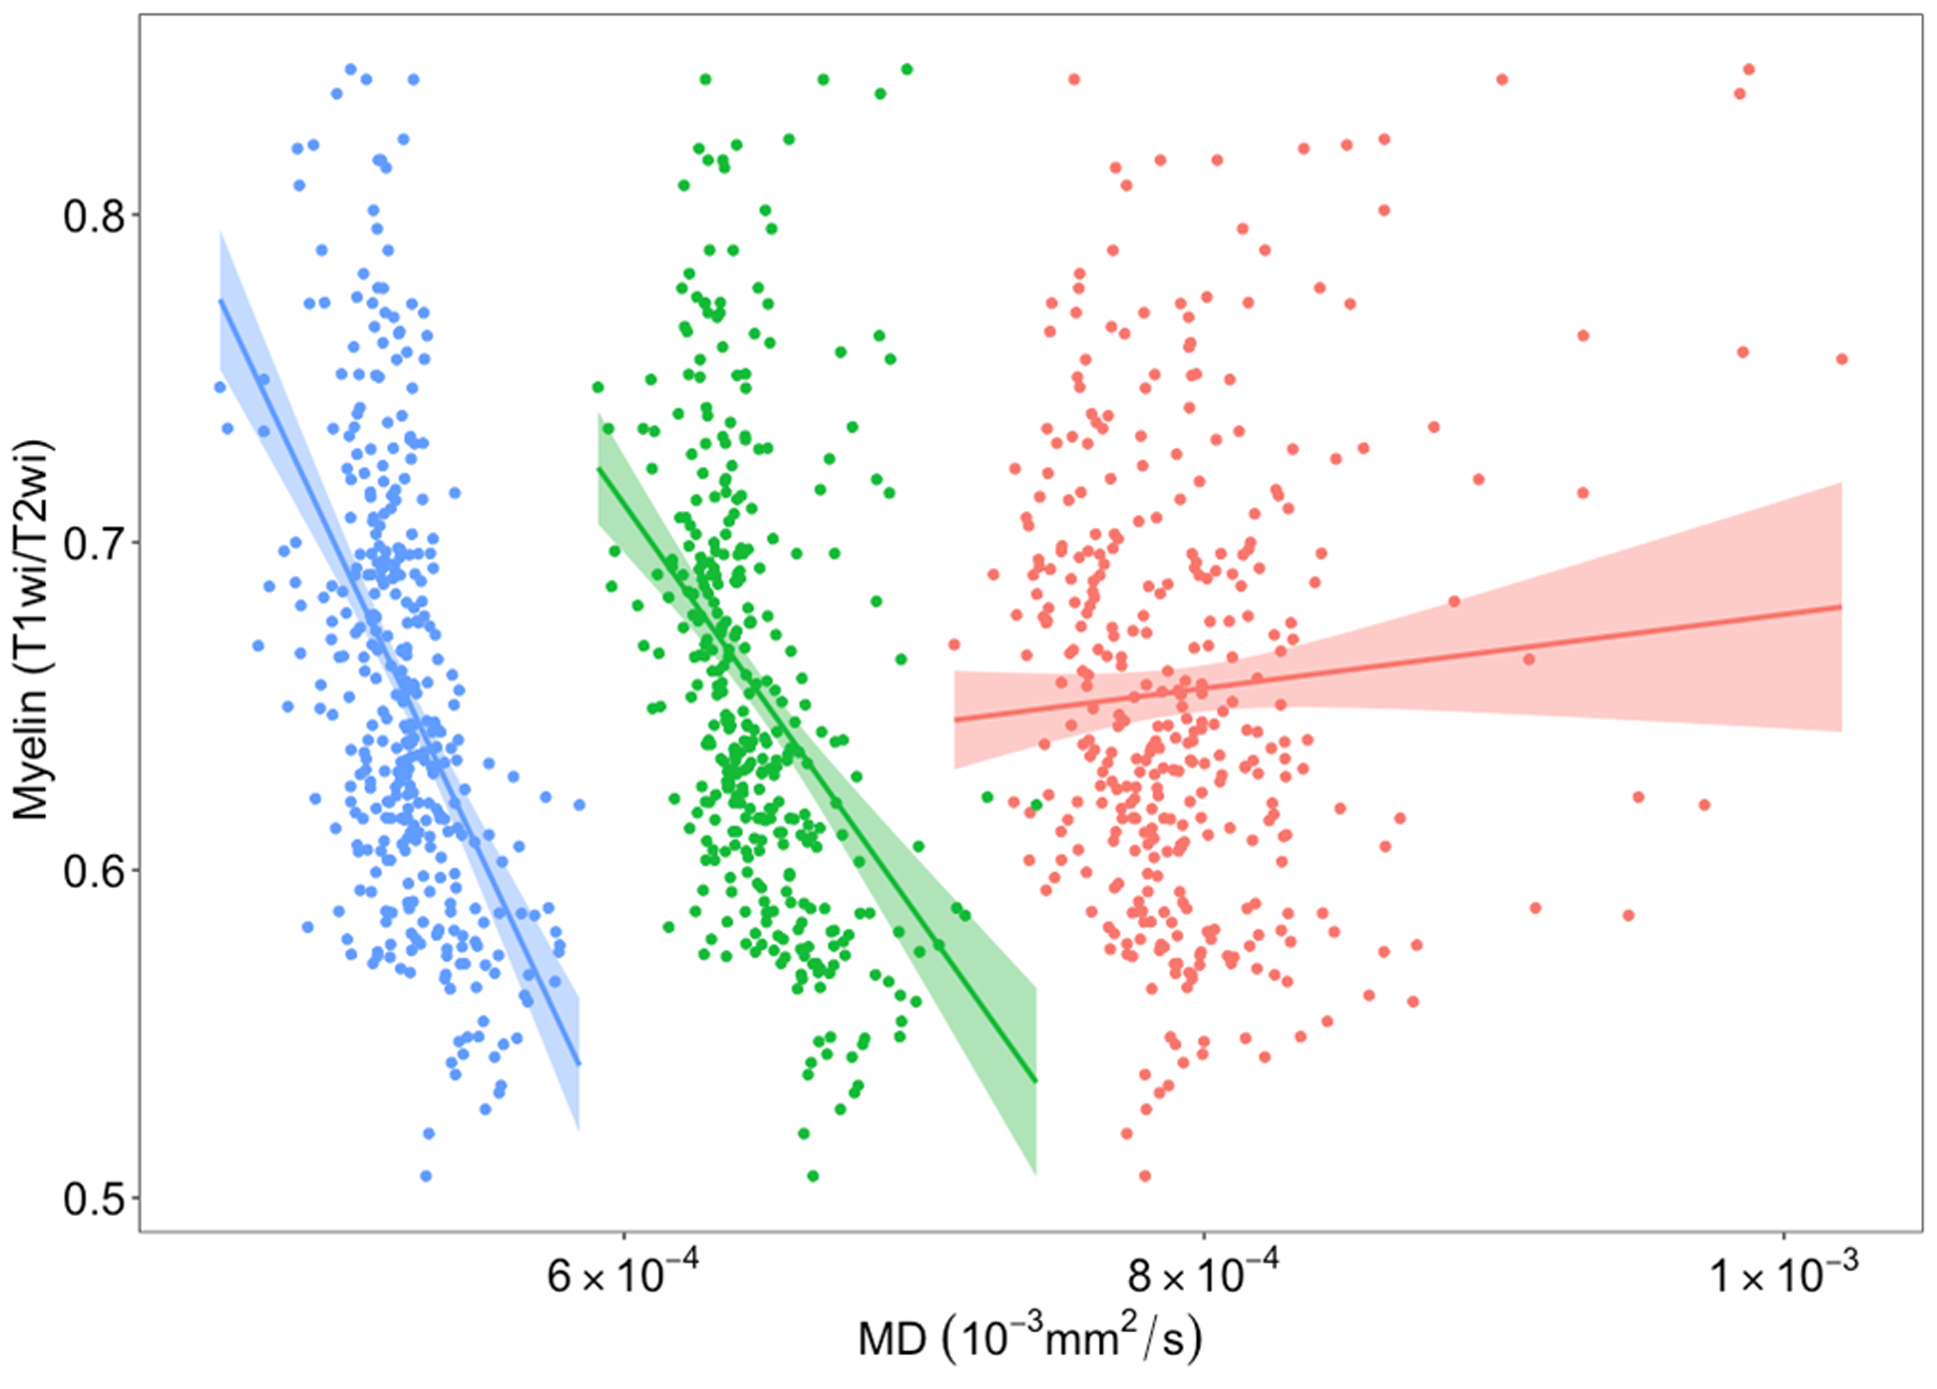
Figure 3: Scatter
plots of estimated myelin content (T1-WI/T2-WI) versus MD1000 (red),
MD3000 (green) and MD5000 (blue) for the averaged values
across the 9 subjects within the 360 cortical parcels. Lines indicate simple
linear regressions and their 95% confidence interval.