1795
Patterns of grey matter atrophy in patients with MS: a multivariate analysis using source-based morphometry
Paola Valsasina1, Maria A. Rocca1,2, Alessandro Meani1, Claudio Gobbi3, Chiara Zecca3, Alex Rovira4, Xavier Montalban5, Hugh Kearney6, Olga Ciccarelli6, Lucy Matthews7, Jacqueline Palace7, Antonio Gallo8, Alvino Bisecco8, Carsten Lukas9, Barbara Bellenberg9, Frederik Barkhof10,11, Hugo Vrenken10, Paolo Preziosa1,2, and Massimo Filippi1,2,12
1Neuroimaging Research Unit, Institute of Experimental Neurology, Division of Neuroscience, IRCCS San Raffaele Scientific Institute, Milan, Italy, 2Neurology Unit, IRCCS San Raffaele Scientific Institute, Milan, Italy, 3Department of Neurology, Neurocenter of Southern Switzerland, Civic Hospital, Lugano, Switzerland, 4Section of Neuroradiology and MRI Unit, Department of Radiology, Hospital Universitari Vall d'Hebron, Barcelona, Spain, 5Department of Neurology/Neuroimmunology, Multiple Sclerosis Centre of Catalonia, Hospital Universitari Vall d'Hebron, Barcelona, Spain, 6NMR Research Unit, Queen Square MS Centre, Department of Neuroinflammation, UCL Institute of Neurology, London, United Kingdom, 7Nuffield Department of Clinical Neurosciences, University of Oxford, Oxford, United Kingdom, 8Department of Advanced Medical and Surgical Sciences, and 3T MRI Center, University of Campania “Luigi Vanvitelli”, Naples, Italy, 9Department of Radiology and Nuclear Medicine, and Institute of Neuroradiology, St. Josef Hospital, Ruhr-University Bochum, Bochum, Germany, 10Department of Radiology and Nuclear Medicine, MS Center Amsterdam, Amsterdam Neuroscience, Amsterdam UMC, location VUmc, Amsterdam, Netherlands, 11Institutes of Neurology and Healthcare Engineering, University College London, London, United Kingdom, 12Vita-Salute San Raffaele University, Milan, Italy
1Neuroimaging Research Unit, Institute of Experimental Neurology, Division of Neuroscience, IRCCS San Raffaele Scientific Institute, Milan, Italy, 2Neurology Unit, IRCCS San Raffaele Scientific Institute, Milan, Italy, 3Department of Neurology, Neurocenter of Southern Switzerland, Civic Hospital, Lugano, Switzerland, 4Section of Neuroradiology and MRI Unit, Department of Radiology, Hospital Universitari Vall d'Hebron, Barcelona, Spain, 5Department of Neurology/Neuroimmunology, Multiple Sclerosis Centre of Catalonia, Hospital Universitari Vall d'Hebron, Barcelona, Spain, 6NMR Research Unit, Queen Square MS Centre, Department of Neuroinflammation, UCL Institute of Neurology, London, United Kingdom, 7Nuffield Department of Clinical Neurosciences, University of Oxford, Oxford, United Kingdom, 8Department of Advanced Medical and Surgical Sciences, and 3T MRI Center, University of Campania “Luigi Vanvitelli”, Naples, Italy, 9Department of Radiology and Nuclear Medicine, and Institute of Neuroradiology, St. Josef Hospital, Ruhr-University Bochum, Bochum, Germany, 10Department of Radiology and Nuclear Medicine, MS Center Amsterdam, Amsterdam Neuroscience, Amsterdam UMC, location VUmc, Amsterdam, Netherlands, 11Institutes of Neurology and Healthcare Engineering, University College London, London, United Kingdom, 12Vita-Salute San Raffaele University, Milan, Italy
Synopsis
In this study, we used source-based morphometry to identify patterns of grey matter tissue loss in a large, multicenter cohort of patients with multiple sclerosis (MS) acquired at 8 European sites. We detected a differential involvement of grey matter networks across the different stages of the disease. Cortical and subcortical grey matter atrophy progressed significantly in MS patients over 1-year of follow-up. Grey matter atrophy, especially in the sensorimotor network, was able to explain patients’ clinical disability, while cerebellar atrophy was able to predict clinical disability worsening over 1-year follow-up.
Introduction
Grey matter (GM) involvement been recognized to be a crucial component of multiple sclerosis (MS) pathophysiology [1]. Source-based morphometry (SBM) is a method able to do a multivariate GM decomposition into co-varying patterns of GM density [2]. Aim of this study was to characterize atrophy of GM patterns across different stages of MS, and its evolution over 1-year follow-up, by analyzing a large, multicentre dataset acquired at 8 European sites.Methods
MRI and clinical evaluations were obtained from 170 healthy controls (HC) and 398 MS patients (34 clinically isolated syndromes [CIS], 226 relapsing-remitting [RR], 95 secondary progressive [SP] and 43 primary progressive [PP] MS). Fifty-seven HC and 144 MS patients underwent 1-year follow-up. At follow-up, patients were classified as clinically stable or worsened, according to changes in the Expanded Disability Status Scale (EDSS) score [3]. Baseline GM loss, longitudinal GM atrophy changes, and correlations with disability and 1-year clinical worsening were assessed.Results
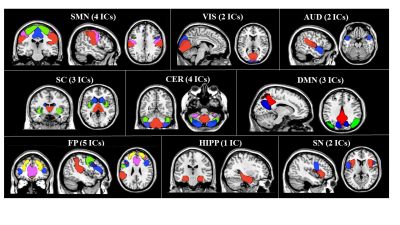
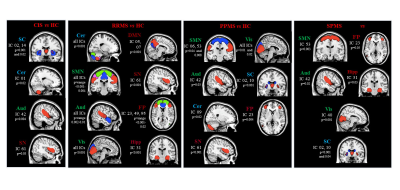
SBM identified 26 relevant GM components, which were assigned to cerebellar, subcortical, sensorimotor, visual, temporal, default-mode, fronto-parietal, hippocampal, executive and salience networks (Figure 1). Compared to HC, MS patients showed significant GM atrophy in almost all components (p=range <0.001-0.04). CIS patients showed circumscribed GM atrophy in subcortical, cerebellar, temporal and salience components vs HC, while RRMS patients exhibited widespread GM atrophy involving most GM components (Figure 2). PPMS patients showed GM loss vs HC mainly located in cerebellar, subcortical, sensorimotor, salience and fronto-parietal regions (Figure 2). Such components showed additional GM atrophy in SPMS vs RRMS. At 1-year, 21 (15%) MS patients had clinically worsened. GM atrophy significantly progressed over time in MS patients in subcortical, cerebellar, sensorimotor, temporal and fronto-parietal regions (Figure 3). Baseline higher disability was associated (R2=0.65) with lower normalized brain volume (b=-0.13, p=0.001), higher sensorimotor GM loss (b=-0.12, p=0.002) and longer disease duration (b=0.09, p=0.04). Normalized GM volume (odds ratio=0.98, p=0.008) and cerebellar GM volume (odds ratio=0.40, p=0.01) were independent predictors of clinical worsening (area-under-the-curve=0.83).Discussion
In our study, we found widespread GM atrophy, which started from subcortical and cerebellar networks at the earliest disease stages, and progressively spread to cortical areas, especially those involved in sensory and motor functions. Diffuse GM loss became more severe in progressive than in relapsing MS patients. Also, GM atrophy significantly progressed over time in MS patients in distinct structural systems. Sensorimotor and cerebellar GM atrophy were able to explain baseline disability and clinical worsening.Conclusions
SBM highlighted a differential regional GM involvement across disease stages and significant atrophy progression at 1-year in MS patients. Neuroprotection therapies or neurorehabilitative programs targeting vulnerable regions might be particularly valuable in MS patients to counteract MS-related damage and stop disease progression.Acknowledgements
The authors, for the MAGNIMS Study GroupReferences
[1] Filippi M., et al. Curr Opin Neurol, 2014. 27: 290-299. [2] Xu L., et al. Hum Brain Mapp, 2009. 30: 711-724. [3] Filippi, M., et al. Neurology, 2013. 81: 1759-1767.Figures

Figure
1. Independent components
(ICs) of co-varying grey matter identified by source-based morphometry. SMN= sensorimotor network; VIS=
visual network; AUD= auditory network; SC= subcortical network; CER= cerebellar
network; DMN= default mode network; FP= fronto-parietal network; HIPP=
hippocampal network; SN= salience network.

Figure 2. Differences
of atrophy in source-based morphometry-derived independent components (ICs) among
MS phenotypes at baseline. HC=healthy controls; CIS=clinically isolated
syndrome; RRMS=relapsing-remitting multiple sclerosis; SPMS=secondary
progressive multiple sclerosis; PPMS=primary progressive multiple sclerosis.

Figure 3. One-year grey
matter atrophy progression in source-based morphometry-derived grey matter
components in healthy controls (left panel) and patients with multiple
sclerosis (right panel).