1788
Penumbra Quantification from SWI visible Prominent Veins and its comparison with ASL-derived penumbra in patients with acute stroke1Center for Biomedical Engineering, Indian Institute of Technology Delhi, New Delhi, India, 2Philips Health Systems, Philips India Limited, Gurugram, India, 3Department of Radiology, Fortis Memorial Research Institute, Gurugram, India, 4Department of Interventional Neuroradiology, Fortis Memorial research Institute, Gurugram, India, 5Department of Neurology, Fortis Memorial research Institute, Gurugram, India, 6Department of Biomedical Engineering, All India Institute of Medical Sciences, New Delhi, India
Synopsis
Objectives are to enhance the PHVS visibility in SWI, quantify stroke penumbra from it and calculate the mismatch ratio between PHVS(SWI) and DWI. For algorithm performance evaluation, 3D non-contrast pCASL as a gold standard was used to calculate true mismatch ratio with DWI. The proposed approach demonstrates high correlation between the two mismatch ratios, suggesting that PHVS and SWI based penumbra quantification has the potential to be used as an alternative for perfusion based methods. If mismatch ratio can accurately be produced from PHVS SWI, it could potentially reduce the scan time for acute stroke.
Introduction:
Definition and extent of penumbra in acute stroke patients, is an important information for thrombolytic/ recanalization therapies which target to recover the salvageable brain tissue. Hypo-perfusion is established as standard [1-2] to calculate penumbra and mismatch ratio with core of the infarct highlighted on diffusion-weighted-imaging(DWI). Various methods of estimating hypo-perfusion are reported for MRI-based penumbra calculation: such as dynamic-susceptibility-contrast(DSC) based metrics (MTT or rCBF) [3]. pseudo-continuous-arterial-spin-labeling(pCASL) has also been used as a method of qualitatively assessing stroke penumbra area in recent studies[4-5] and it has been proven as comparable with DSC perfusion based penumbra indications. In acute ischemic stroke, there is a sudden reduction in oxygen, which further increases the OEF and results in higher concentration of deoxyhaemoglobin in the draining vein. These can be visualized as a prominent hypo-intense-vein-sign(PHVS) in the ischemic region on susceptibility-weighted-imaging(SWI) sequence. Studies suggest that PHVS can be an equivalent sign of penumbra region [6]. But, visualization of PHVS and penumbra identification based on it, is rather poor compared to perfusion-weighted-imaging(PWI)-based hypo-perfusion. In this study, objectives are to enhance the PHVS visibility in SWI, quantify stroke penumbra from it and calculate the mismatch ratio between PHVS(SWI) and DWI. For algorithm performance evaluation, 3D non-contrast pCASL as a gold standard was used to calculate true mismatch ratio with DWI.Methods
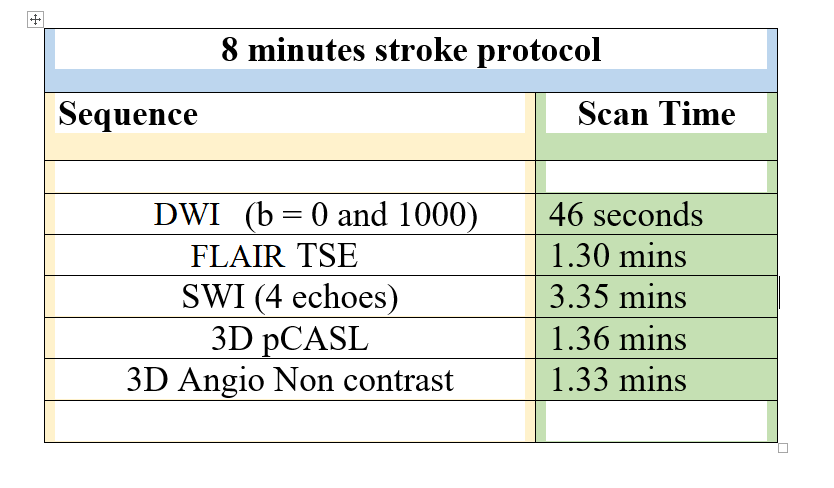
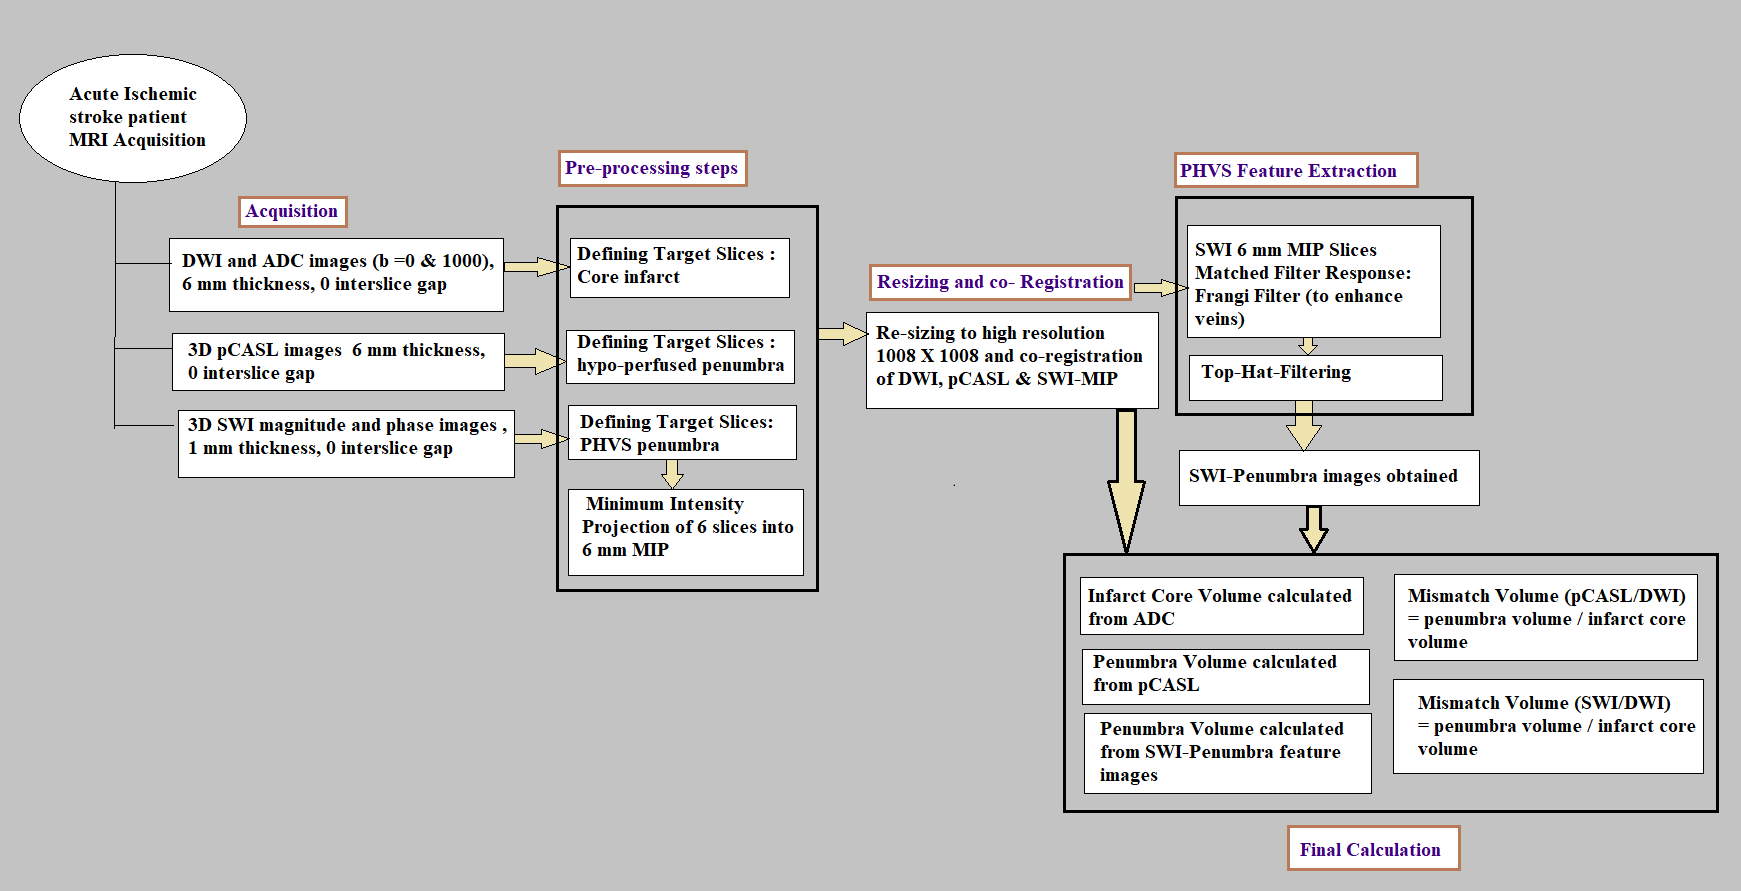
This retrospective study, approved by IRB, included total 10 acute ischemic stroke patients (age range) presented in the stroke onset of <4hours). These patients underwent MRI on a 3.0T scanner (Ingenia, Philips Healthcare, The Netherlands). Scan protocol used in summarized in Table 1. SWI data were acquired with 4 echoes at 5.6, 11.8, 18, 24.2ms (TR=31ms; flip-angle=17°, slice-thickness=1.0mm, acquisition-matrix=1008×1008, FO4V=240×240mm2). The SW-Magnitude images were obtained from scanner by multiplying fast-field-echo(FFE)-M image with a phase mask derived from PADRE(Phase-Difference-Enhanced-imaging) filtering process. PADRE algorithm calculates phase-mask from the homodyne-filtered phase image. DWI (b =0, 1000 s/mm2) and 3D non contrast pCASL images were acquired as part of standard protocol with a slice thickness of 6 mm, with no gap between slices. Apparent diffusion coefficient (ADC) and 3D pCASL based perfusion images were automatically generated. In-house algorithm was developed in MATLAB-2018, as explained in Figure-1 to enhance PHVS features which are otherwise poorly visible. This was followed by PHVS segmentation and quantification of stroke-penumbra. Penumbra volume (in mL) was calculated from multiple slices in SWI containing PHVS and 3D pCASL hypo-perfusion regions. Infarct core volume (in mL) was quantified from the DWI and ADC images. Mismatch ratio was defined as:1) Mismatch ratio (pCASL-DWI) = Penumbra volume in pCASL/ Infarct core volume in DWI.
2) Mismatch ratio (SWI-DWI) = Penumbra volume in SWI/ Infarct core volume in DWI
Mismatch (pCASL-DWI) is taken as gold standard. Regression and Bland-Altman’s plots were used to calculate the correlation, 95% limits of agreement between the two mismatch ratios to compare the performance of this algorithm. All statistical analysis were performed using MedCalc[7]. p ≤ 0.05 indicated a statistically significant difference.
Results
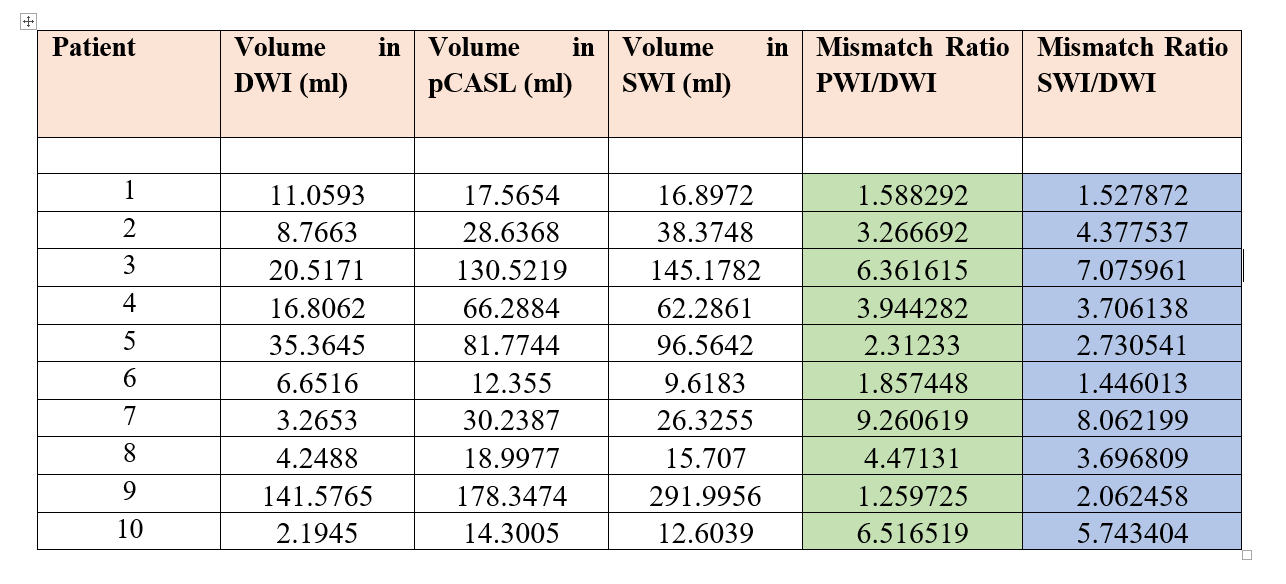
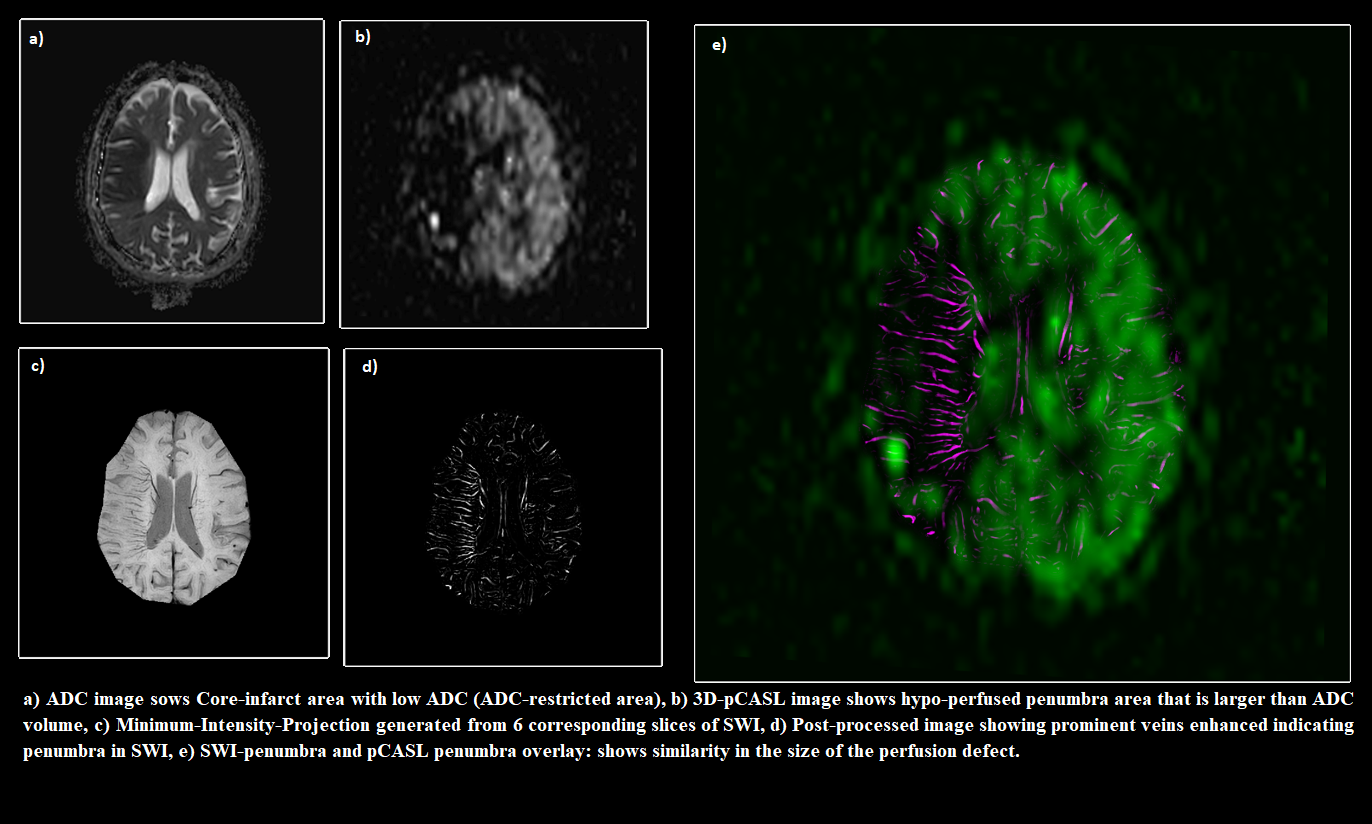
Table 2 summarizes the results of core infarct volume from DWI, penumbra volume from SWI and 3D pCASL and mismatch ratios (SWI-DWI) and (pCASL-DWI) respectively. Correlation and Bland–Altman analysis using SWI and 3D pCASL and mismatch ratios (SWI-DWI) and (pCASL-DWI) from 10 subjects are shown in Figure 2. The correlation was r = 0.96 and 95% confidence interval for r was 0.83 to 0.99 between these two mismatch ratios. Figure 3 shows a sample case where penumbra and mismatch ratio has been calculated using both of these approaches.Discussion and Conclusion
The proposed approach demonstrates high correlation between the two mismatch ratios, suggesting that PHVS and SWI based penumbra quantification has the potential to be used as an alternative for perfusion based methods. In case of stroke, perfusion is often ignored both in CT and MRI because of contrast implications and stroke time constraints, but SWI is an unavoidable sequence in the stroke screening protocol across hospitals to differentiate ischemic stroke from hemorrhagic ones. Thus, if mismatch ratio can accurately be produced from PHVS SWI, it could potentially reduce the scan time and at the same time it can increase the information content delivered. Visual enhancement of PHVS makes it easy to extract features related to penumbra calculation, automatic quantification of penumbra and mismatch ratio can guide the thrombolytic or recanalization therapy process without running an additional perfusion sequence. This SWI-based-penumbra quantification approach needs to be further evaluated in a larger sample size. Relationship of prominent hypo-intense veins with stroke time window and behavior post-therapy can further be explored.Acknowledgements
No acknowledgement found.References
[1] Schaefer PW, Barak ER, et al. Quantitative assessment of core/penumbra mismatch in acute stroke: CT and MR perfusion imaging are strongly correlated when sufficient brain volume is imaged. Stroke (2008) 39:2986–92. doi:10.1161/STROKEAHA. 107.513358
[2] Yoo AJ, Verduzco LA, et al. MRI-based selection for intra-arterial stroke therapy: value of pretreatment diffusion-weighted imaging lesion volume in selecting patients with acute stroke who will benefit from early recanalization. Stroke (2009) 40:2046–54. doi:10.1161/STROKEAHA.108.541656
[3] Parsons MW, Yang Q, et al. Perfusion magnetic resonance imaging maps in hyperacute stroke: Relative cerebral blood flowmost accurately identifies tissue destined to infarct. Stroke. 2001; 32:1581–1587. [PubMed:11441205]
[4] Huang YC, Liu HL, Lee JD, Yang JT, Weng HH, Lee M, et al. Comparison of arterial spin labeling and dynamic susceptibility contrast perfusion MRI in patients with acute stroke. PLoS One 2013; 8: e69085. doi: 10.1371/journal.pone.0069085
[5] Bivard A, Krishnamurthy V, Stanwell P,Levi C, Spratt NJ, Davis S, et al. Arterial spin labeling versus bolus-tracking perfusion in hyperacute stroke. Stroke 2014; 45: 127–33.
[6] Wang Y, Shi T, Chen B, Lin G, Xu Y, Geng Y. Prominent hypointense vessel sign on susceptibility-weighted imaging is associated with clinical outcome in acute ischaemic stroke. Eur Neurol 2018;79:231-239
[7] MedCalc Statistical Software Version 14.8.1 (2014) MedCalc Software, Ostend, Belgium.
Figures