1786
Optimizing Fusion Bootstrap Moves Solver (FBMS) regularization for improved B1+ mapping using Multi Spin-Echo brain sequences1ISR-Lisboa/LARSyS and Department of Bioengineering, Instituto Superior Técnico – Universidade de Lisboa, Lisbon, Portugal, 2Centre for the Developing Brain, King's College London, London, United Kingdom
Synopsis
T2 mapping provides valuable tissue-specific MR information. To enable shorter scan times, multi spin-echo (MSE) sequences are commonly used but the achieved T2 accuracy using conventional mono-exponential fitting is poor. Improvements are possible by matching the measured signal to a pre-computed dictionary. Although simultaneous B1+ estimation is feasible, previous work demonstrated a bimodal behaviour. We investigate further improvements in B1+ accuracy using an iterative pixel-neighborhood based method (the Fusion Bootstrap Moves Solver), comparing different levels of spatial regularization. Improved B1+ accuracy and recovery of spatially smooth maps was demonstrated both in simulated and in-vivo brain data.
Introduction
Multi spin-echo (MSE) sequences have been suggested for T2 mapping due to shorter scan times compared to single spin-echo protocols. MSE employs a train of refocusing pulses after a single excitation RF pulse. The disadvantage of MSE sequences is that strong signal contamination arising from stimulated echo pathways lead to erroneous T2 estimation when applying the standard mono-exponential model. Recent work demonstrated that further improvements can be achieved when using echo modulation curves (EMC), which can be pre-computed given the sequence timings and RF pulses characteristics to account for all echo pathways1. Previous work showed that simultaneous voxel-wise B1+ estimation with this method is possible but the estimated B1+ values display a bimodal distribution with the main peak coinciding with the true value2,3. In this work, we seek to exploit the expected spatial smoothness of the B1+ field to iteratively improve B1+ estimation using the Fusion Bootstrap Moves Solver (FBMS)4,5. We investigate the use of FBMS to improve B1+ accuracy in the brain and establish spatial homogeneity metrics to evaluate the effect of optimized FBMS regularization parameters compared to the non-regularized EMC method.Methodology
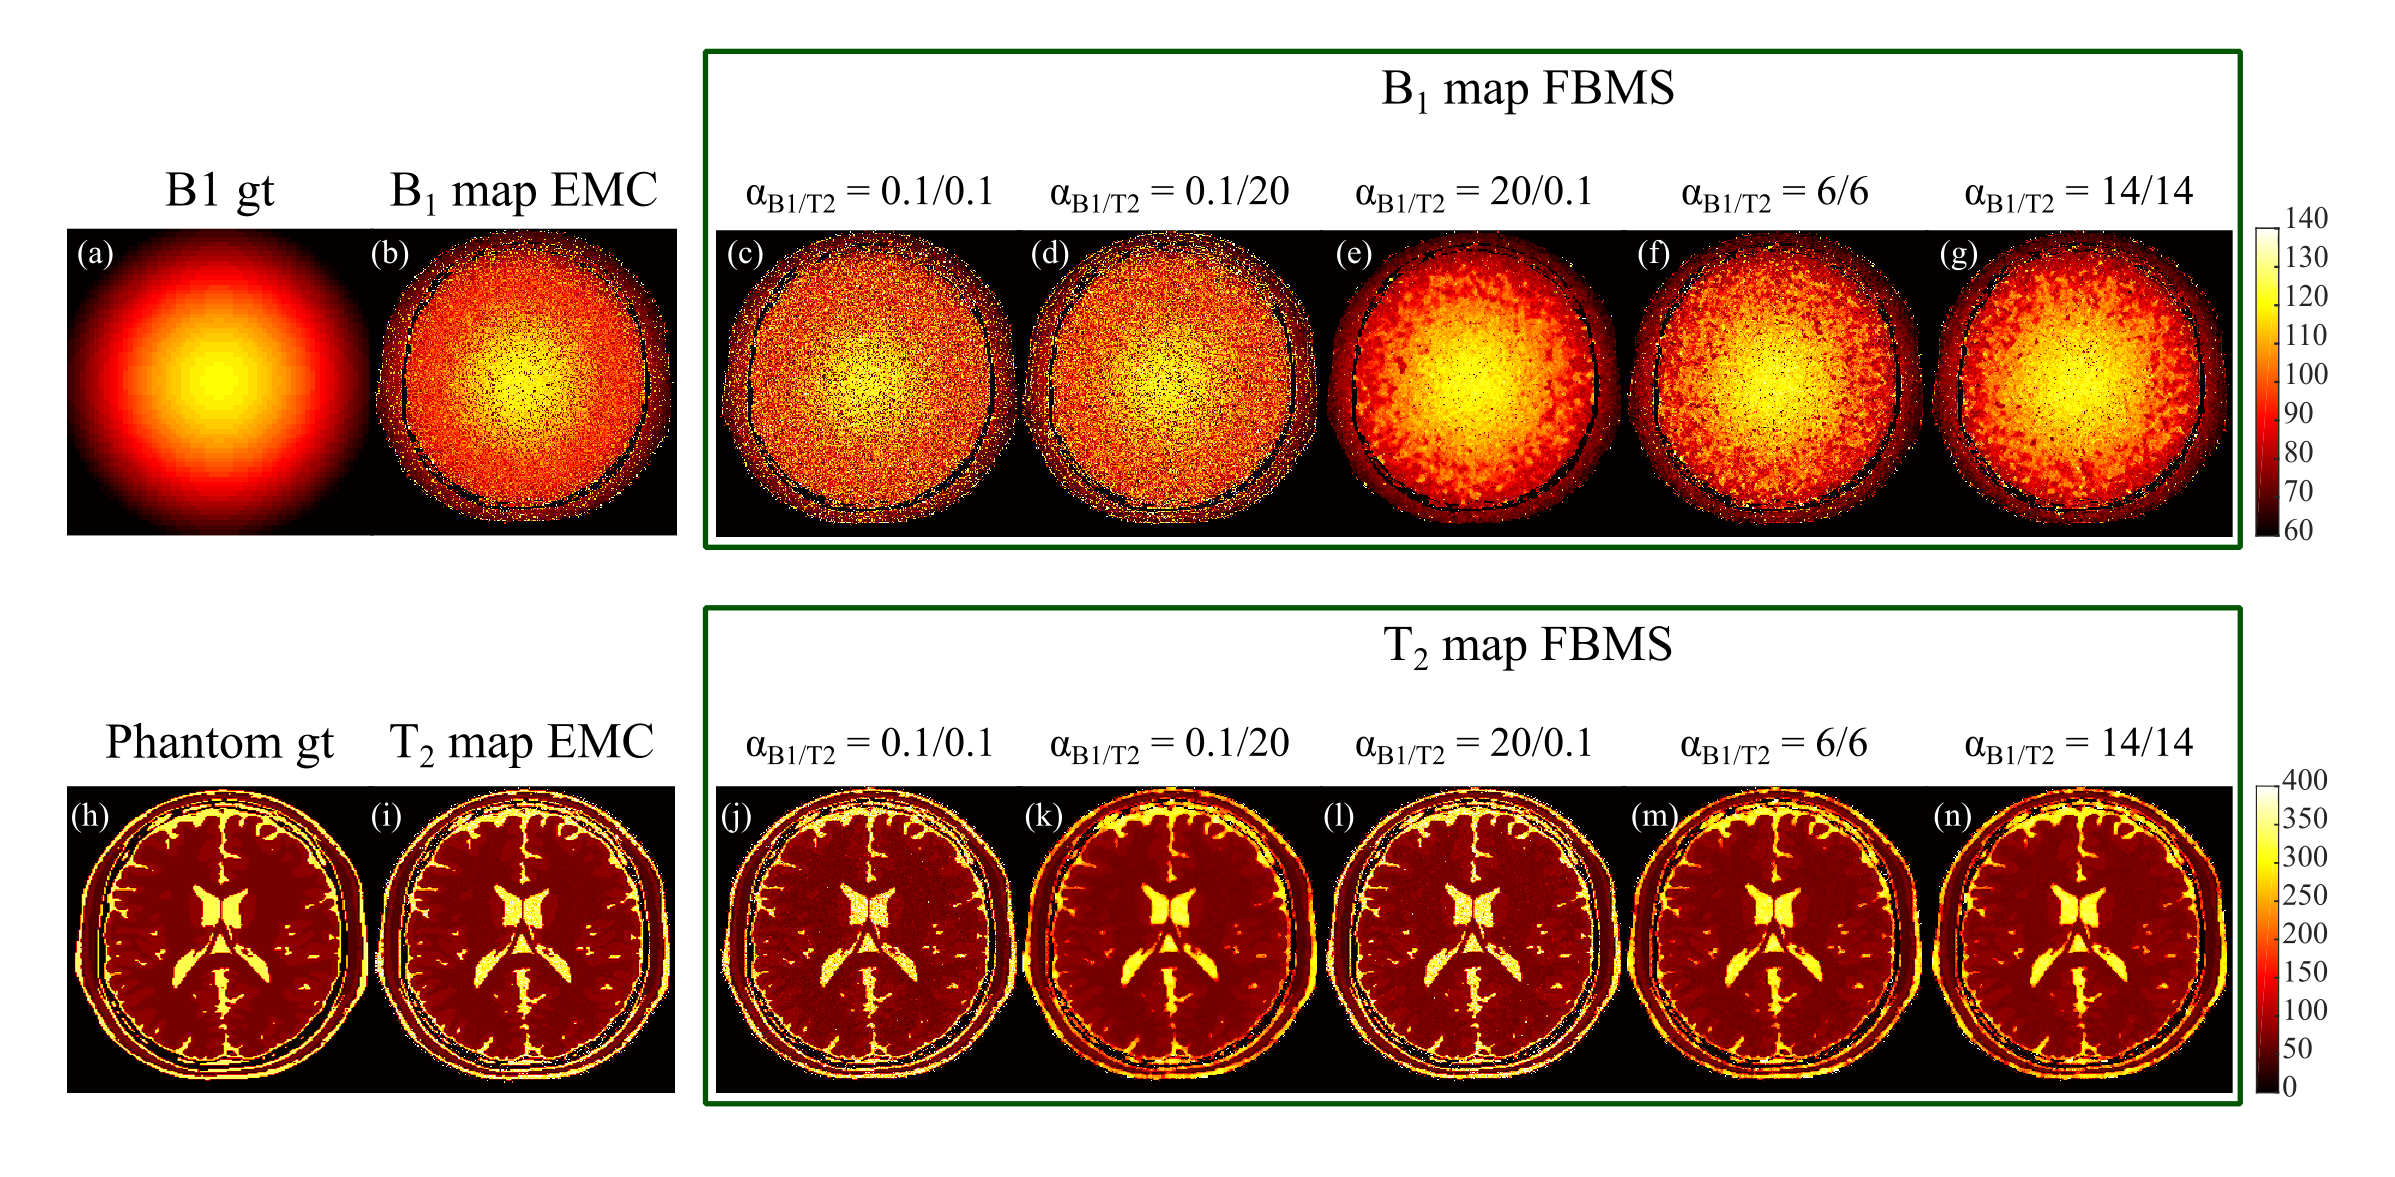
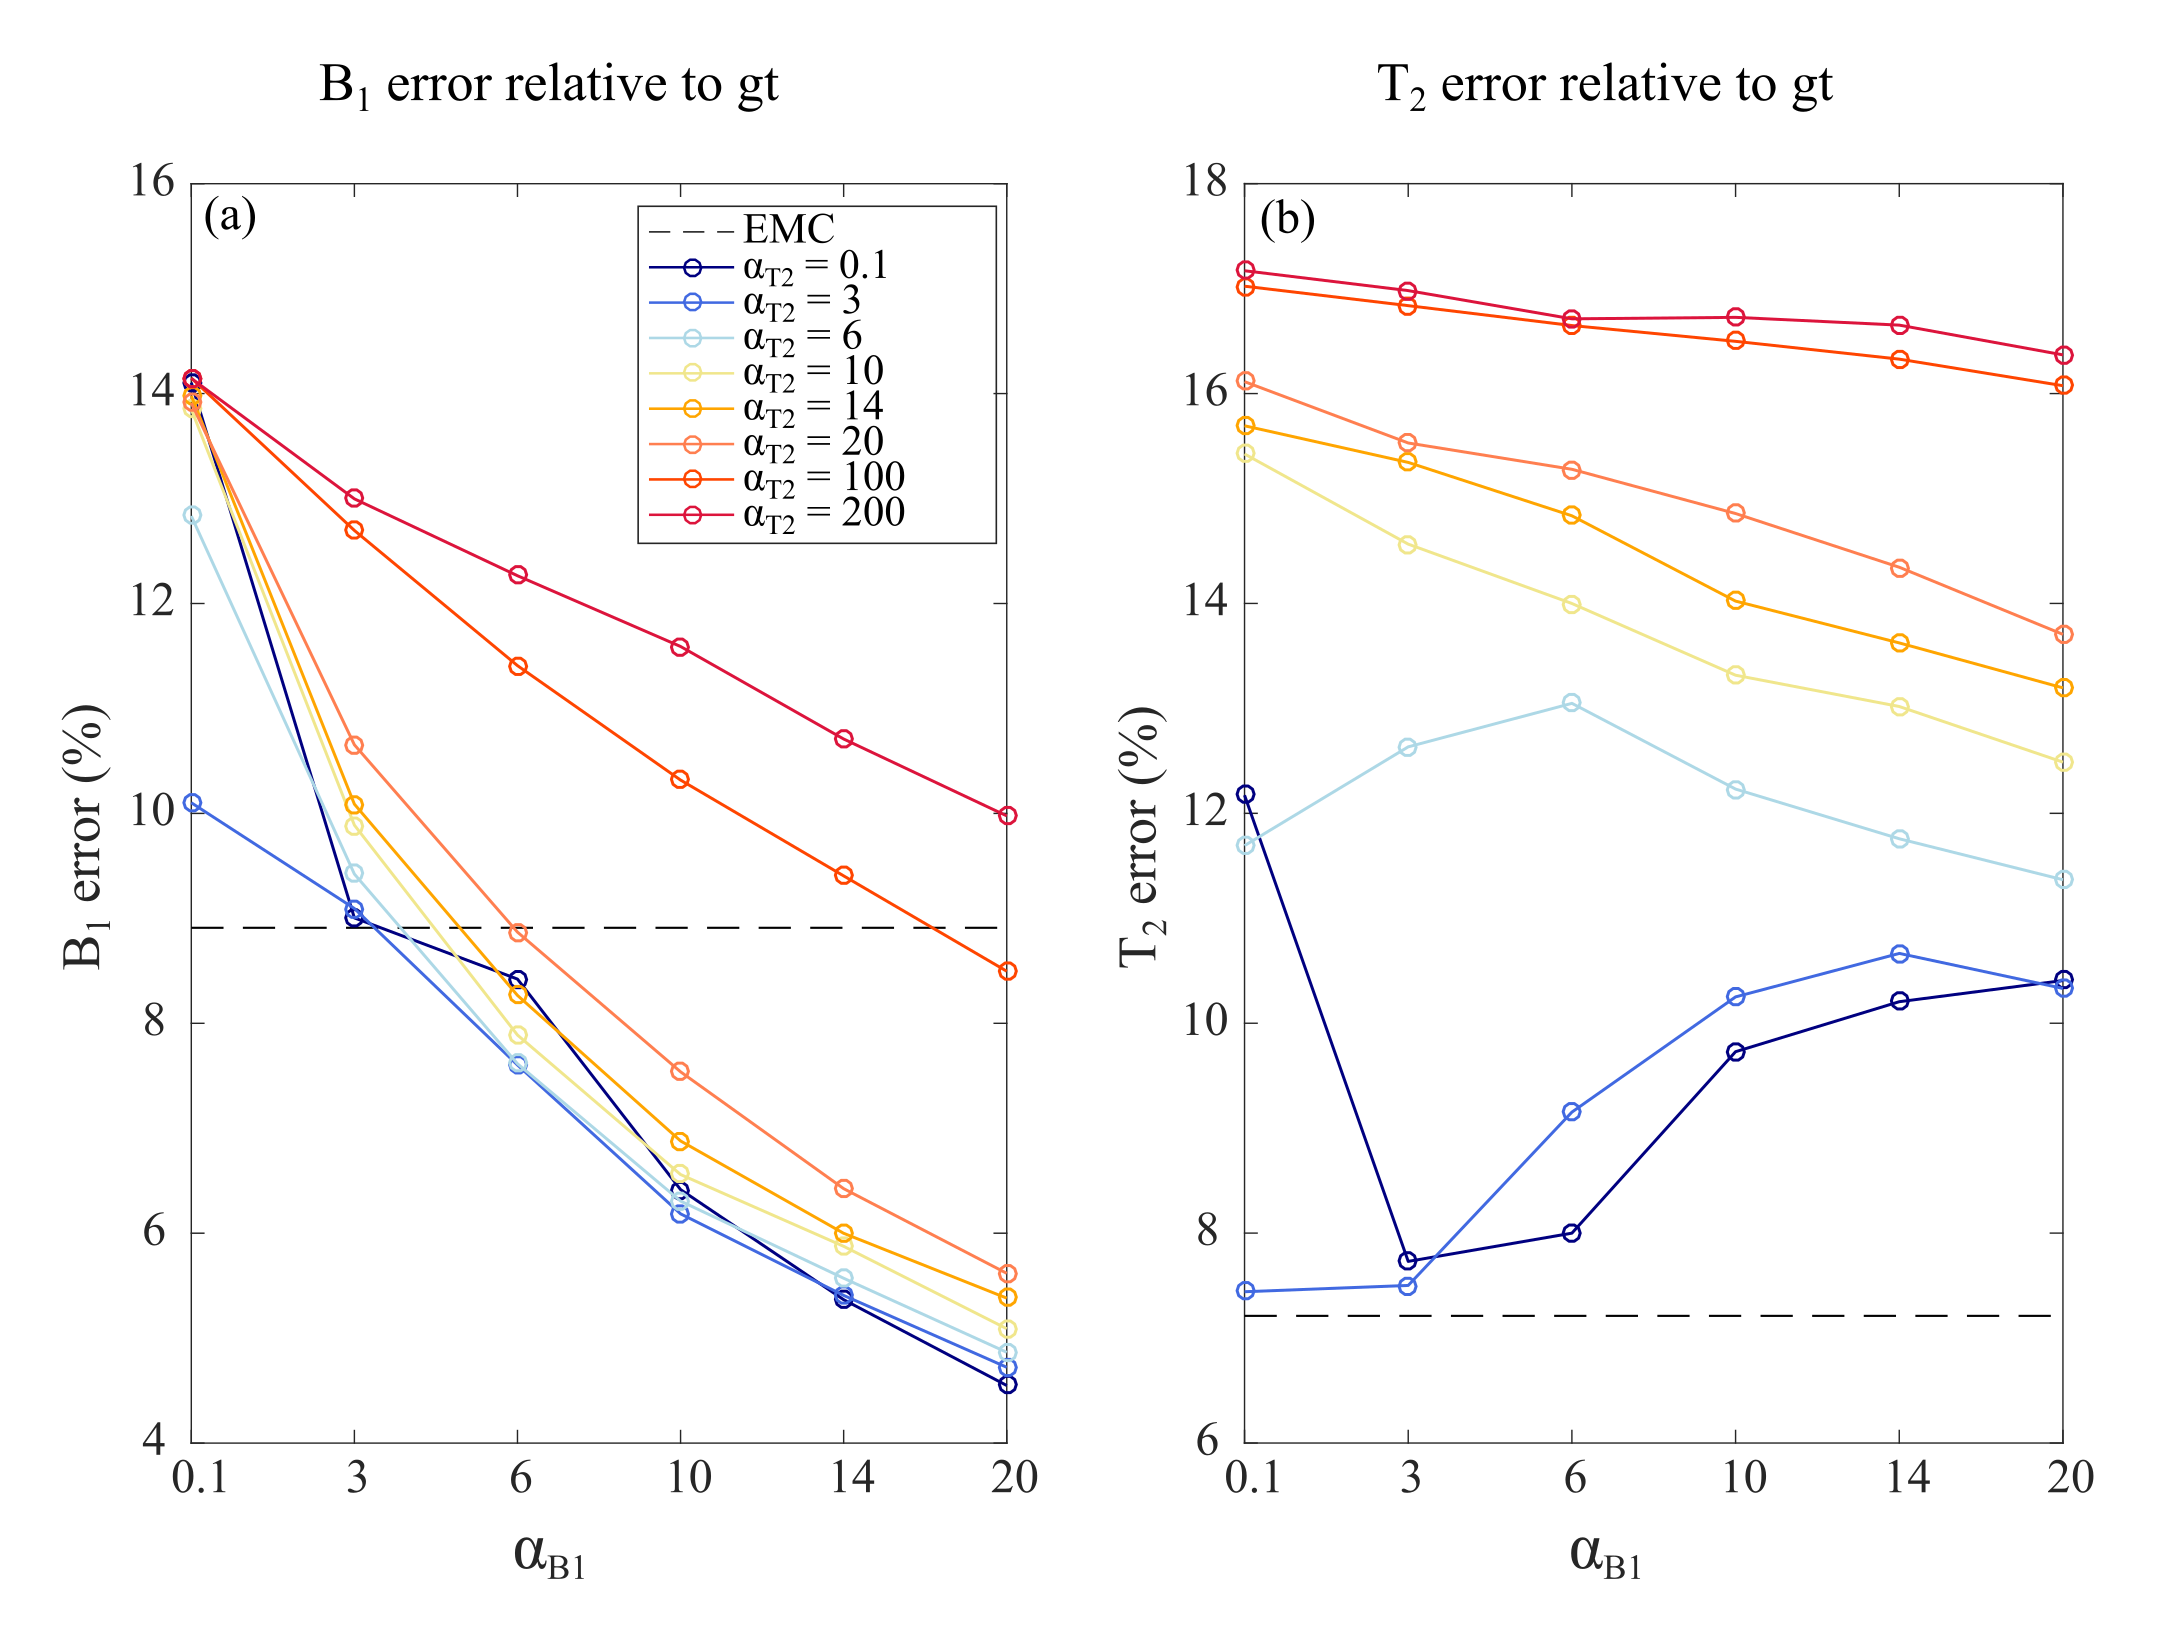
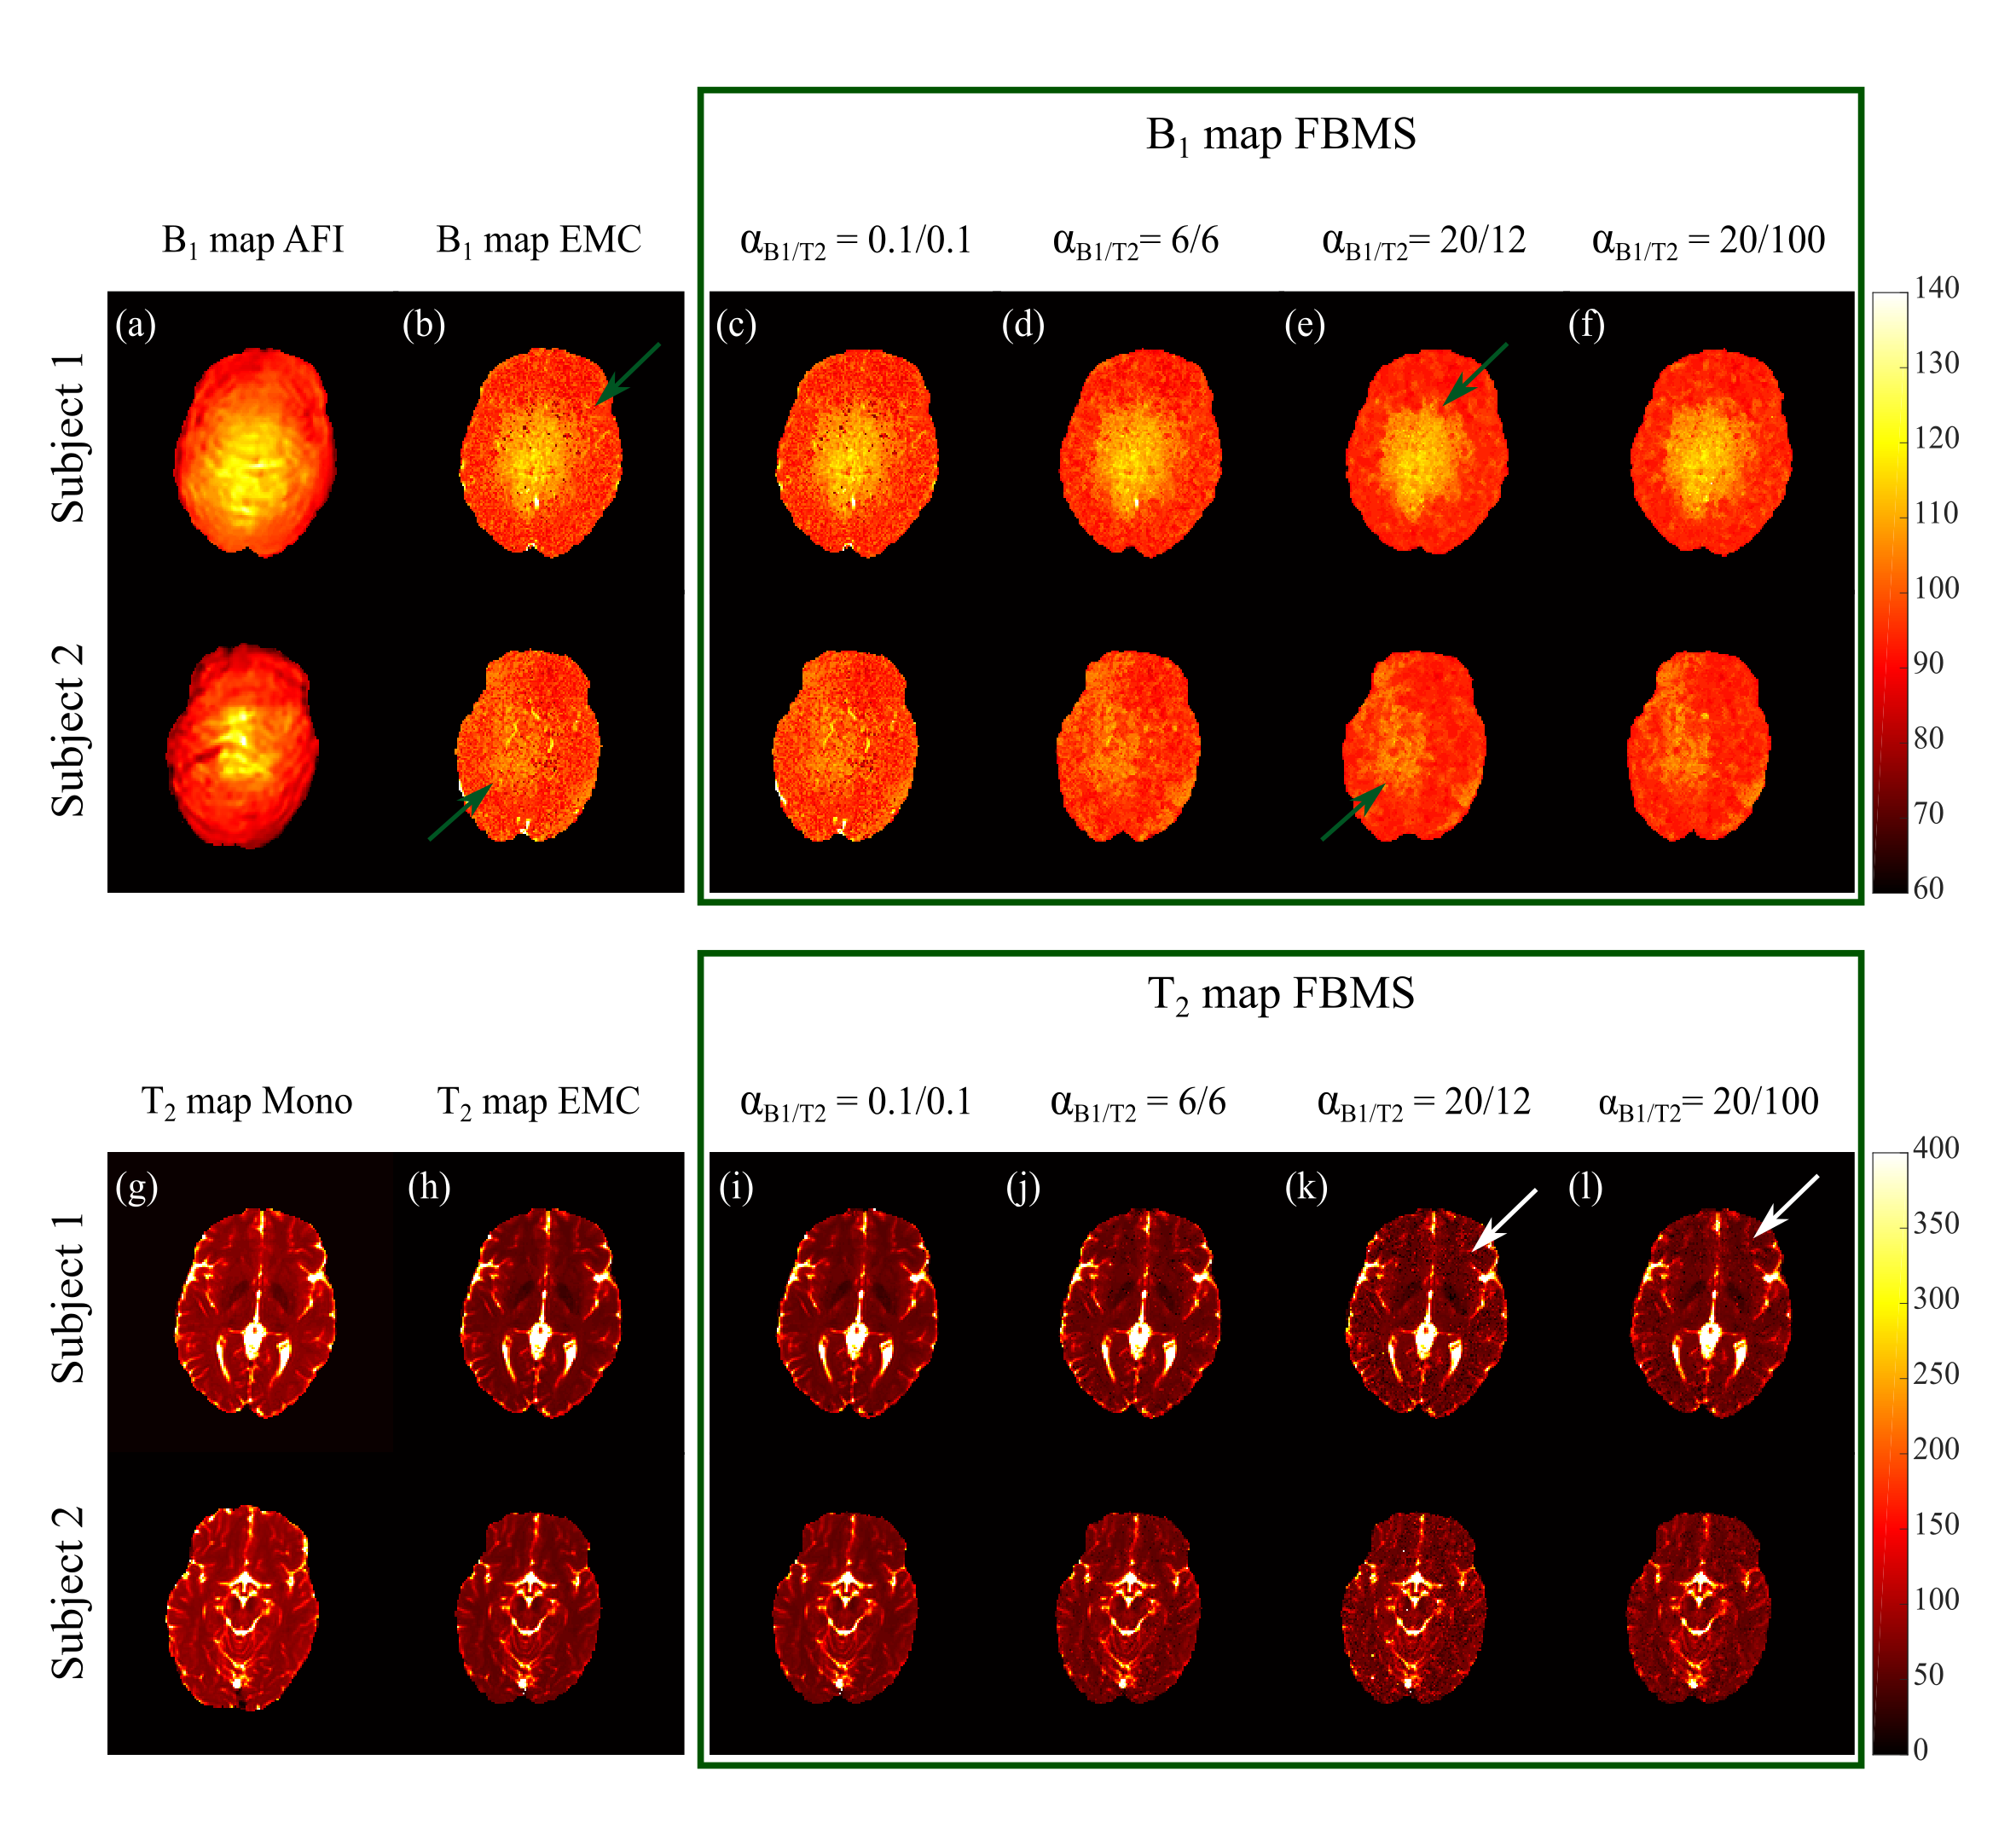
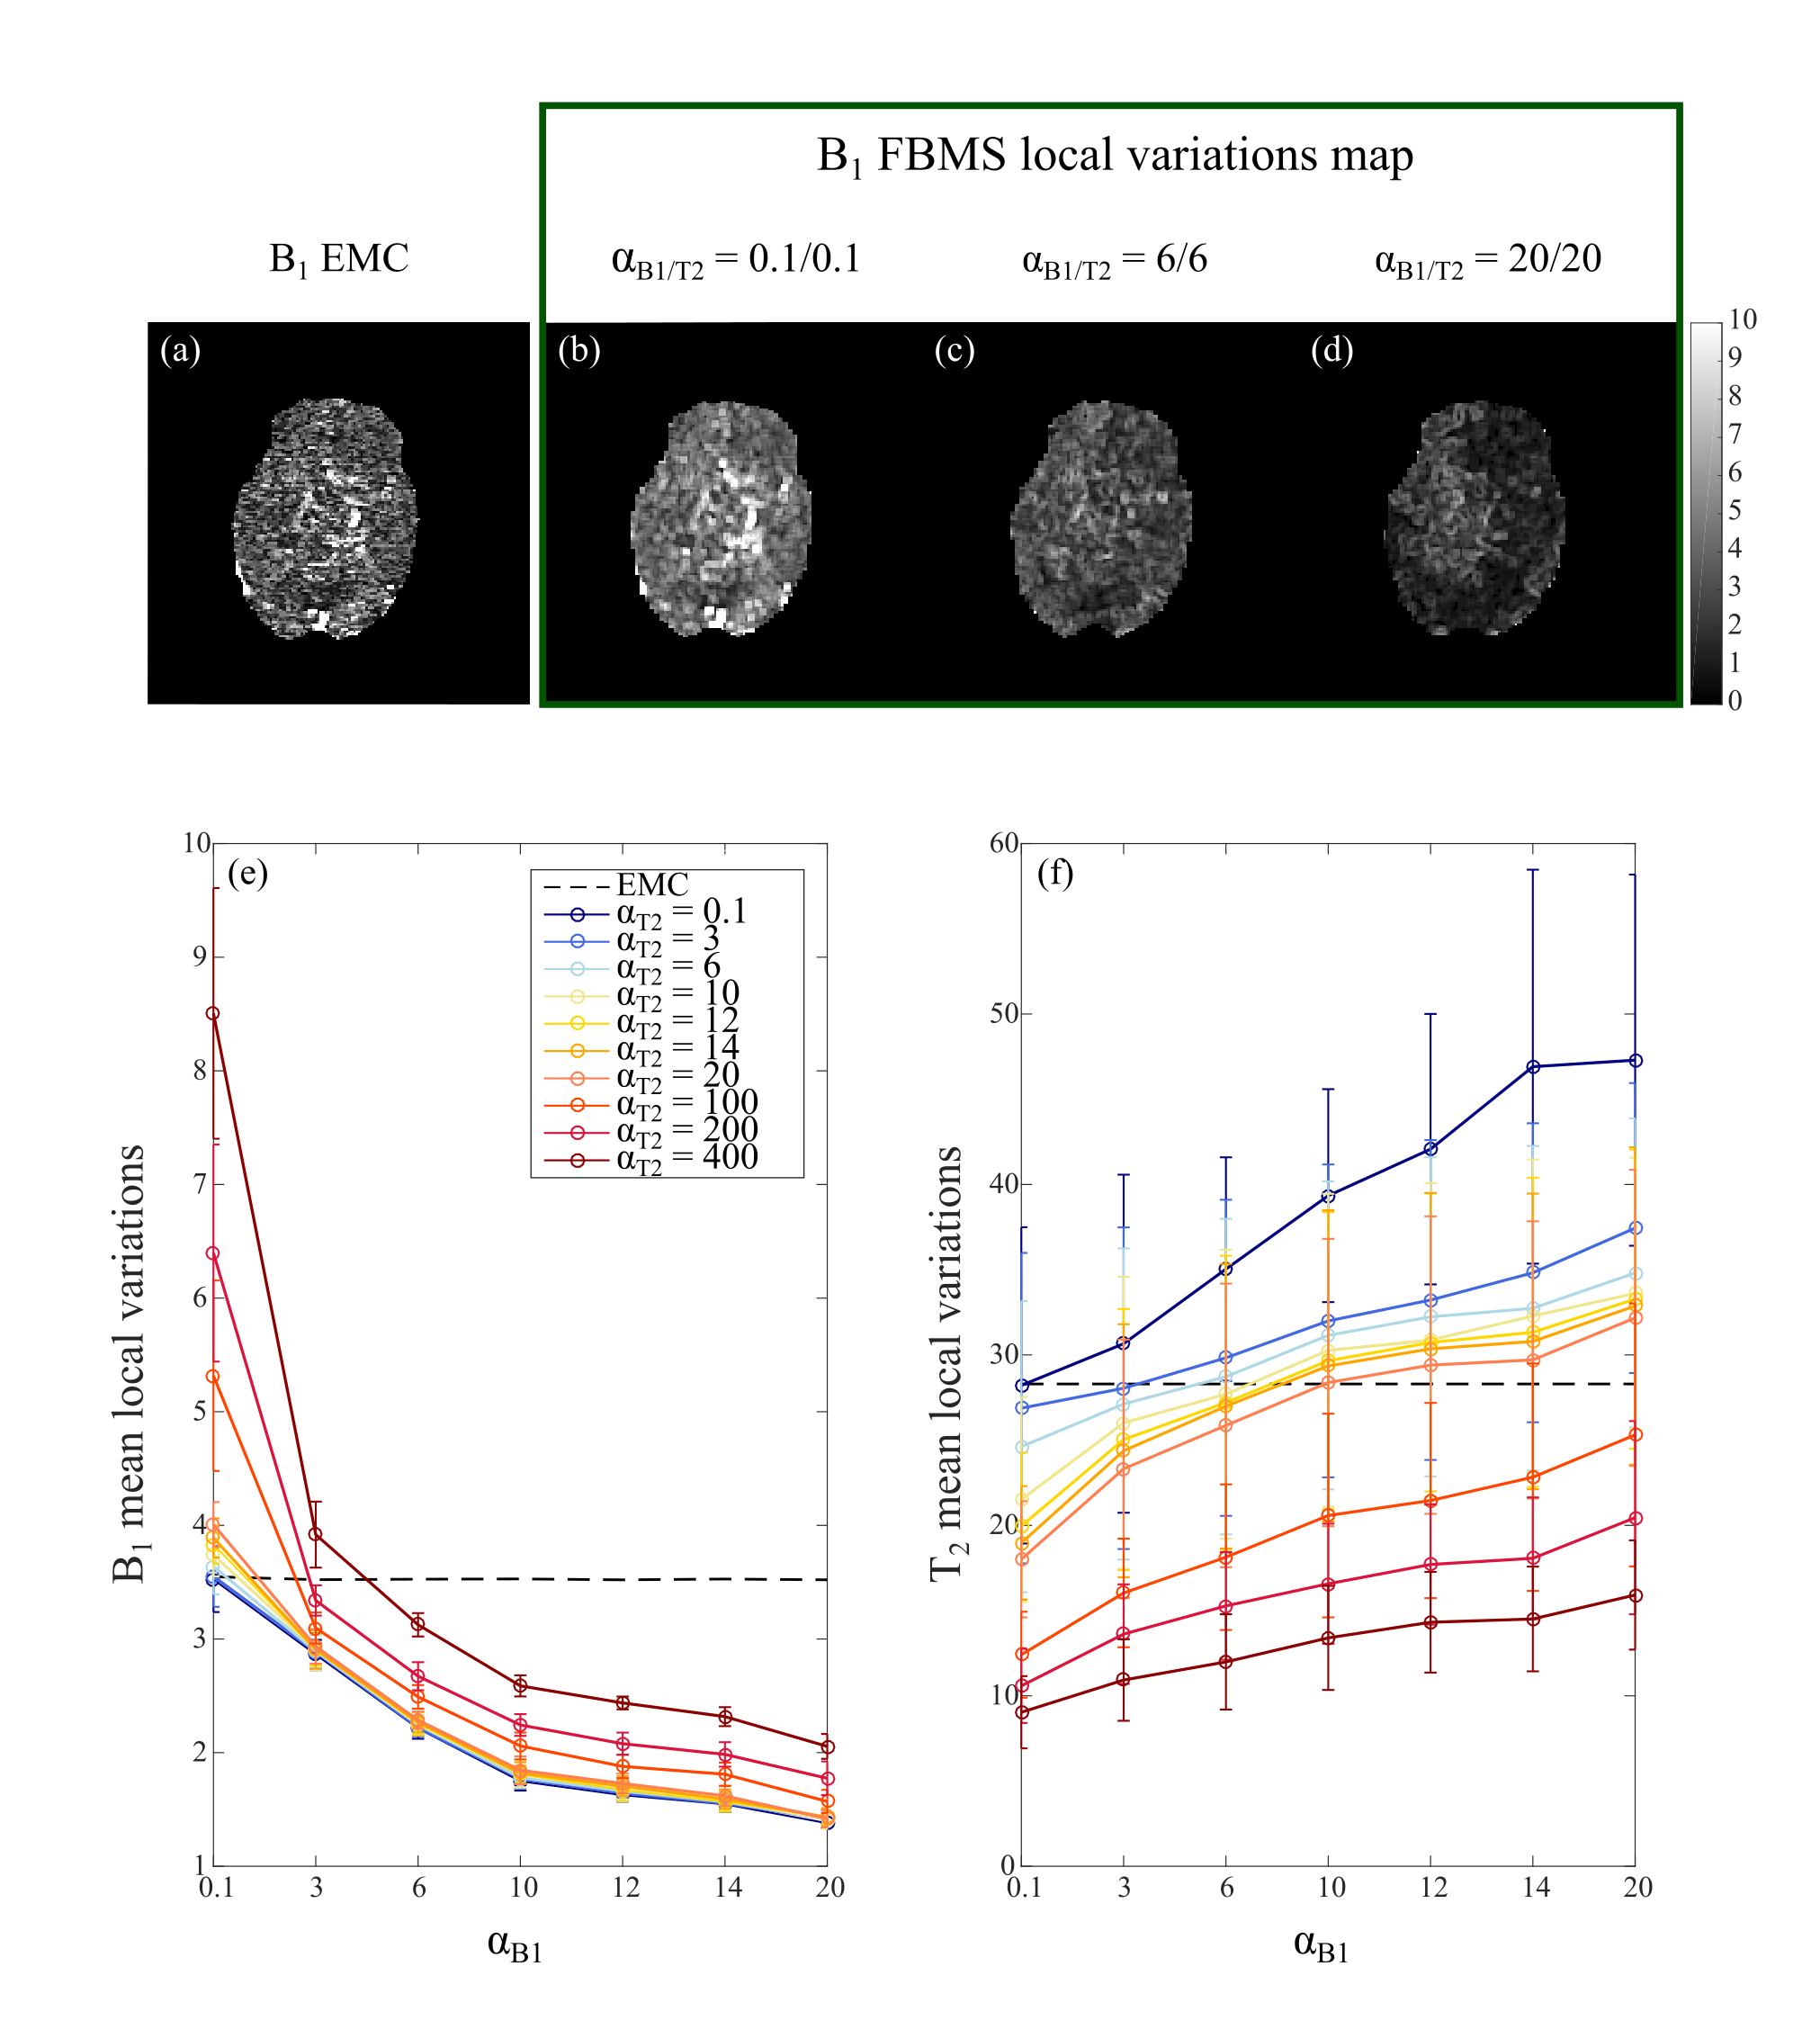
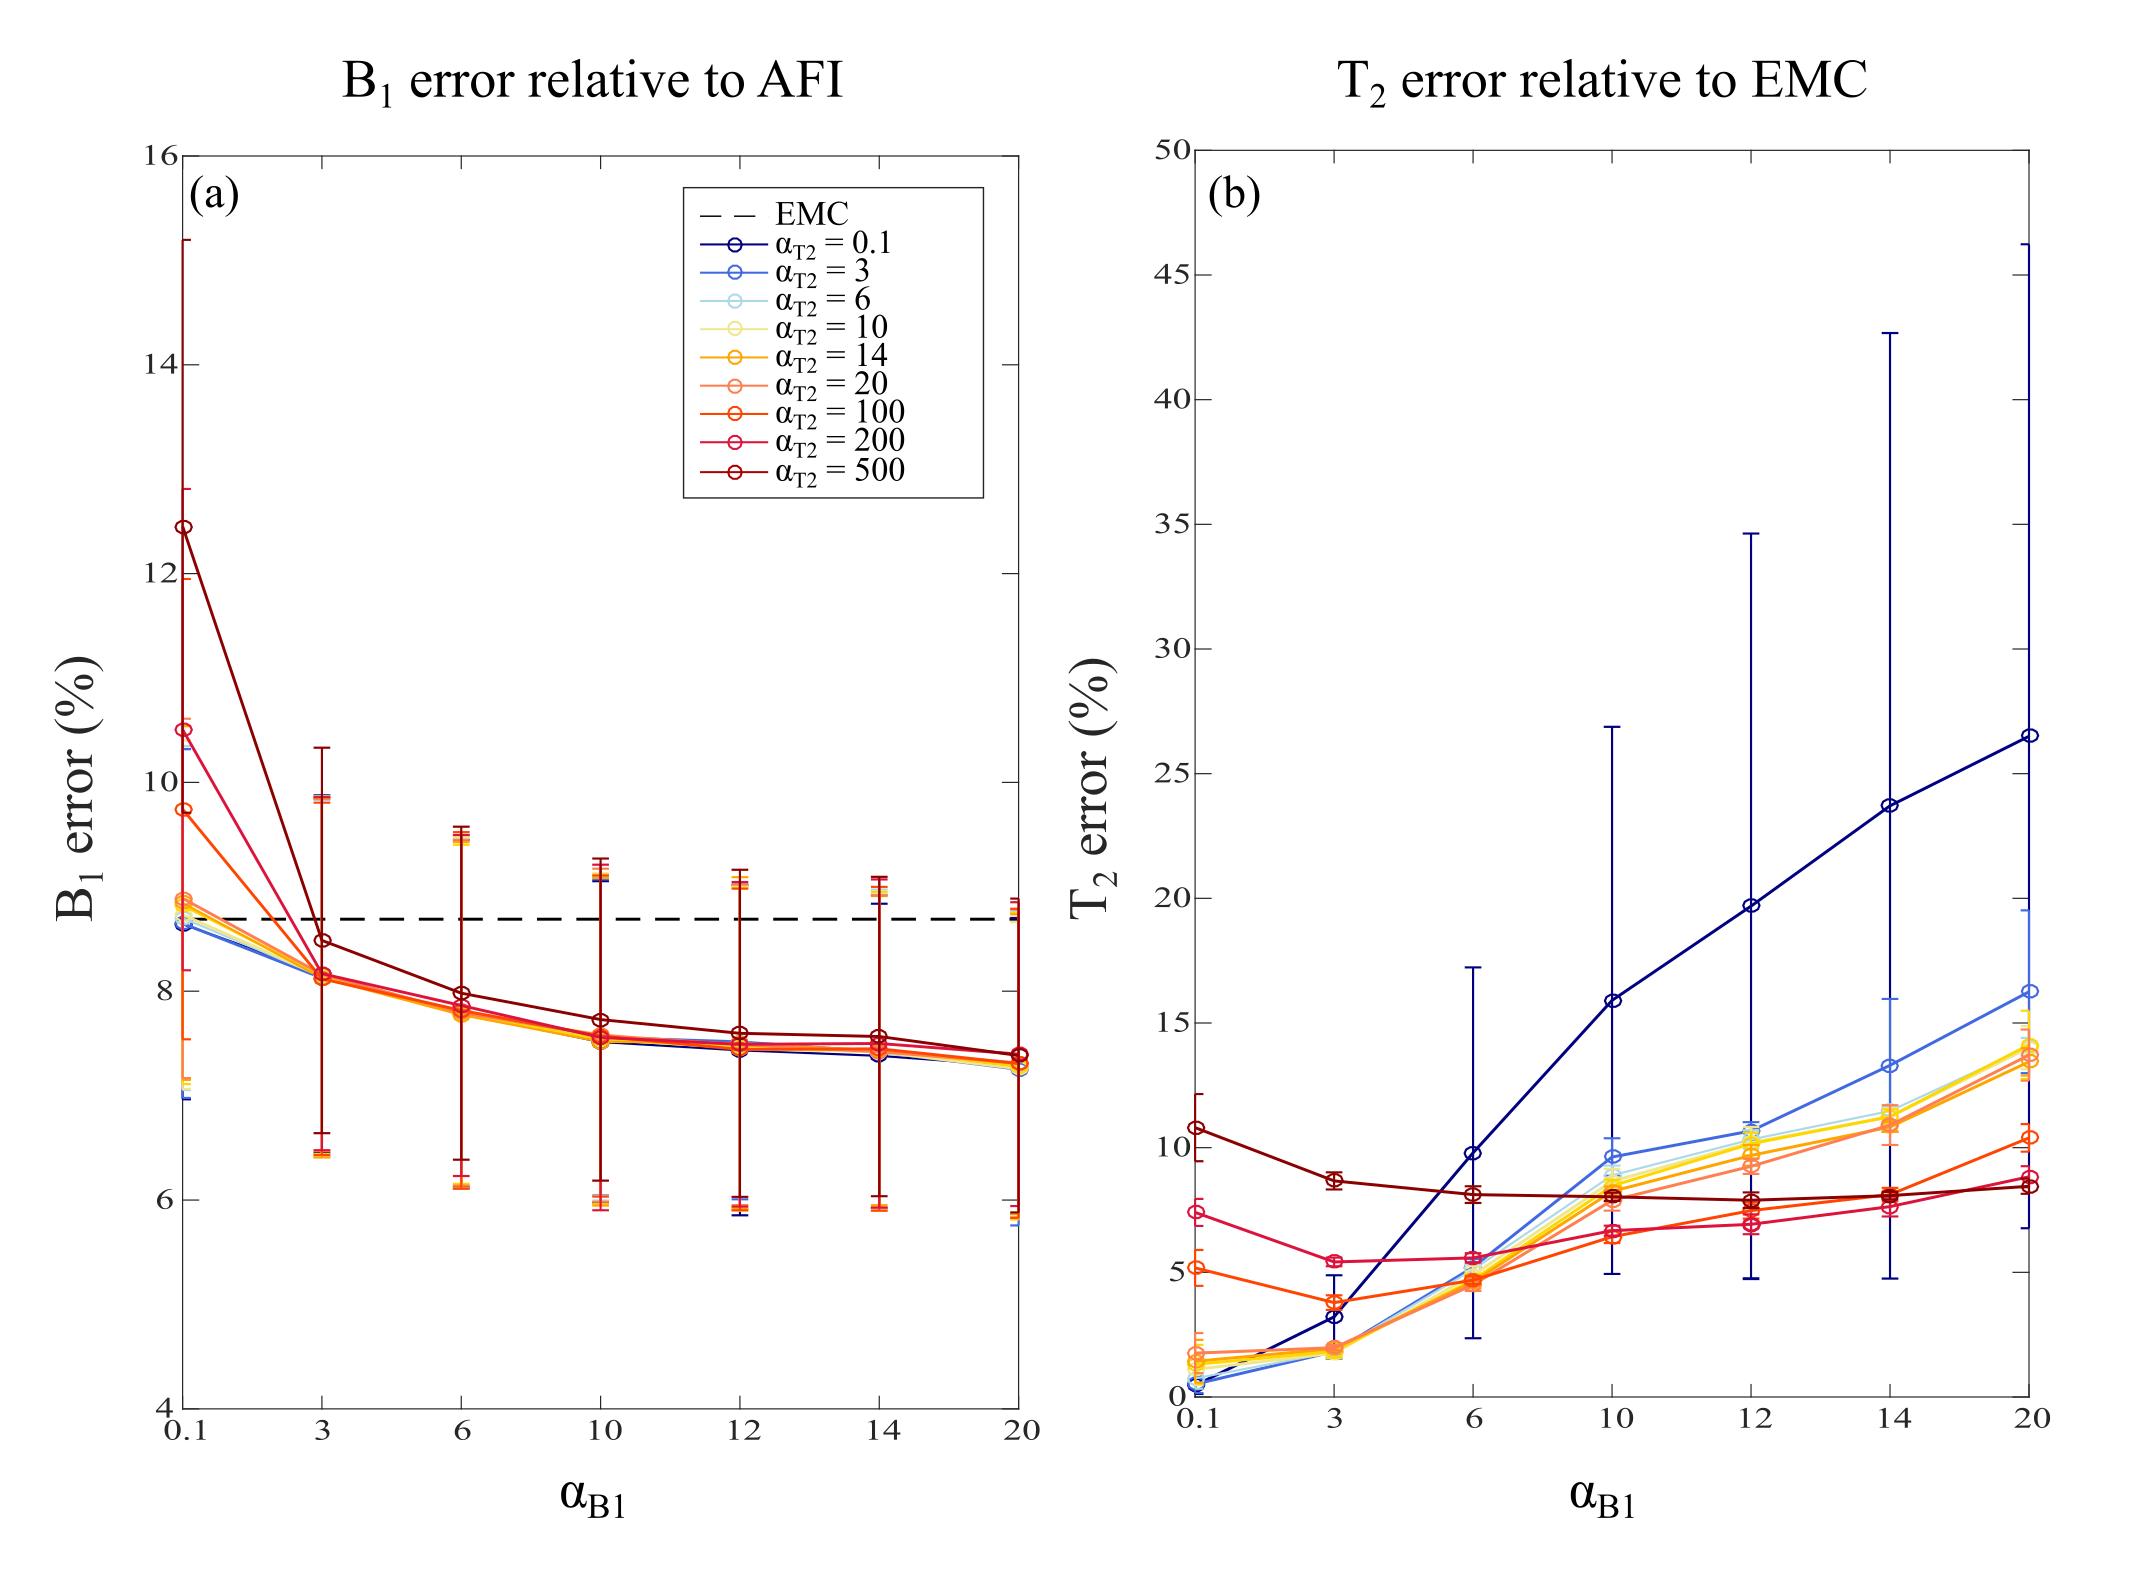
A numerical brain phantom was generated considering three tissue types: cerebrospinal fluid (CSF), white matter (WM) and grey matter (GM), with distinct T2 and proton density values at 3T3. Simulation of the MSE signal and computation of the EMC dictionary was implemented using the Extended Phase Graph (EPG) formalism6, considering a fixed T1 = 1000 ms (previously reported here1), a T2 range of 20:5:400 and 400:100:2000 ms and a B1+ range of 60:2:140%2,3. B1+ and T2 mapping were obtained using signal matching to the pre-computed EMC dictionary and the proposed FBMS method4,5. FBMS was implemented with Matlab 2015b (Mathworks, USA). The FBMS algorithm starts by using the B1+ and T2 EMC estimated maps as initialization for the iterative model. Then, it applies a binary graph-cut solver, allowing to combine a previous and an updated B1+/T2 estimated proposal until it better fits the acquired T2-weighted signal. Spatial regularization of the B1+/T2 maps was controlled using the factors ɑB1 and ɑT2, respectively. Since FBMS improves B1+ estimation by taking into account the surrounding pixels’ estimates, a spatial smoothness metric was established by calculating the local standard deviation within a 3x3 pixel neighborhood. In-vivo brain data was acquired in a cohort of three healthy subjects using a Philips Achieva 3T scanner. MSE sequence was implemented with: TR = 4s, ETL = 32 (dTE = 10ms), spatial resolution 1.6×1.6×4.0mm3 and FOV 250×250mm2. B1+ maps were also acquired with the Actual Flip Angle (AFI)7 method (3.9mm isotropic resolution, FOV = 250×250×250mm3, TE/TR = 0.78/25ms, TR extension 100ms). B1+ estimation with FBMS and EMC was analyzed considering both accuracy (error relative to ground truth or in-vivo reference) and spatial homogeneity metric (standard deviation within pixel-neighborhood). For in-vivo analysis, B1+ FBMS estimation was compared to B1+ AFI method (considered as gold standard) and the T2 FBMS was compared to the original EMC estimate (here considered as reference), since mono-exponential fitting is known to be erroneous1. Optimization of the regularization factors and their impact on B1+ smoothness (novel local variations metric) and accuracy were here investigated in a larger cohort, compared to previous work3.Results
Numerical phantom results are shown in Figure 1. B1+ accuracy was improved with FBMS compared to EMC (Figure 2 a). However, T2 accuracy worsens (Figure 2 b) with the use of FBMS regularization due to adding of textured noise and enforced T2 smoothness where it should not be expected (Figure 1). Example of in-vivo B1+ and T2 brain maps computed with EMC and FBMS are shown in Figure 3. B1+ and T2 local variations metric (smoothness) and corresponding maps are summarized in Figure 4. B1+ spatial smoothness was improved with FBMS, as demonstrated by the decrease in local neighborhood variations around the initial pixel-wise estimation (Figure 4 e). Similarly to simulations, overall B1+ accuracy with FBMS also improved in-vivo (Figure 5 a), proportionally to the increase in ɑB1 regularization. A systematic bias when comparing the B1 FBMS estimation to AFI is present of approximately 7%, however simulation work showed good B1 FBMS accuracy improvement when compared to true value. Although simulations reported a lower T2 accuracy with FBMS compared to ground truth, in-vivo results demonstrated that the reduced T2 accuracy can be kept at acceptable values compared to the initial T2 EMC estimate, by adjusting the T2 relative weights (Figure 5 b).Discussion and Conclusions
B1+ spatial smoothness and accuracy compared to simulated ground truth and AFI in-vivo was improved with FBMS. As expected, the improvement was proportional to the ɑB1 parameter. However, an increase in textured noise can be seen in the T2 maps when applying FBMS due to enforced smoothness. This can be partially counteracted using the ɑT2 parameter albeit with limitations, since T2 is intrinsically spatially variant depending on tissue-type properties. In summary, FBMS is a promising tool to improve B1+ accuracy and spatial smoothness, though careful use should be considered to minimize the effects on T2 estimation.Acknowledgements
Portuguese Foundation for Science and Technology (FCT - IF/00364/2013, UID/EEA/50009/2019, SFRH/BD/120006/2016), and POR Lisboa 2020 (LISBOA-01-0145-FEDER-029686).References
1 Ben-Eliezer N, Sodickson D K, Block K T. Rapid and accurate T2 mapping from multi-spin-echo data using Bloch-simulation-based reconstruction. Magn Reson Med. 2015; 73: 809-817.
2 Santos N, Teixeira R, Hajnal J and Nunes RG. Assessing the accuracy of T2 and B1 maps estimated from multi-echo spin echo MRI sequences using extended phase graph signal predictions. In the proceedings of 24th ISMRM, Singapore, 2016.
3 Freitas AC, Sousa I, Gaspar AS, Teixeira R PAG, Hajnal J and Nunes RG. Improving T2 and B1 parametric estimation in the brain with multi spin-echo MR and fusion bootstrap moves solver (FBMS). In proceedings of 27th ISMRM, Montreal 2019.
4 Freiman M, Perez-Rossello J M, Callahan M J, Voss S D, Ecklund K, Mulkern R V, Warfield S K. Reliable estimation of incoherent motion parametric maps from diffusion-weighted MRI using fusion bootstrap moves. Med Image Anal. 2013; 17: 325-336.
5 While P. A comparative simulation study of bayesian fitting approaches to intravoxel incoherent motion modeling in diffusion-weighted MRI. Magn Reson Med. 2017; 78: 2373-2387.
6 Weigel M. Extended phase graphs: dephasing, RF pulses and echoes - pure and simple. J Magn Reson Imaging. 2015; 41: 266-295.
7 Yarnykh VL. Actual Flip-angle imaging in the pulsed steady state: a method for rapid three-dimensional mapping of the transmitted radiofrequency Field. Magn Reson Med. 2007; 57(1):192-200.
Figures