1782
A Quantitative MRI-Based Method of Repolarization of T1 for the Mixed Turbo Spin Echo Pulse Sequence1Mechanical Engineering, Boston University, Boston, MA, United States, 2Boston University Medical Center, Boston, MA, United States
Synopsis
Purpose: To develop quantitative MRI-based algorithms for correction of signal polarity for measurement of T1. Methods: Two polarity maps of T1 are calculated according to the mixed-TSE acquisition, and repolarized on a voxel-wise basis. The two polarity maps are compared to thresholds for PD and T2. The correct polarity is selected based on which T1 more accurately describes the selected voxel. Maps of the T1/T2 ratio repolarize the remaining unpolarized tissue. Results: Repolarized T1 maps exhibit an accurate bimodal distribution in vivo. Conclusion: A qMRI-based repolarization technique allows T1 measurement from mixed-TSE magnitude data, toward studying the extremely preterm brain.
Purpose
The Extremely Low Gestational Age Newborn (ELGAN) study has tracked children born extremely preterm throughout childhood and into adolescence. Early implementation of the protocol at age 10 was insufficient to conduct quantitative MR (qMR) due to the direct-acquisition of magnitude images generated by the mixed turbo spin echo pulse sequence. While this allowed implementation across vendors, at all 12 sites of the ELGAN study, the magnitude data makes it impossible to distinguish between very long T1 and short T1 tissue. A common method of polarity correction utilizes phase information generated from a comparison of inversion and saturation recovery images (1), to fit the real component of the signal. In the context of the ELGAN study; however, phase information is not available. As such, this study poses a novel algorithm for repolarization of T1 maps obtained from the mixed turbo spin echo. Adequate repolarization of the magnitude data has implications toward identifying new markers of development in the extremely preterm brain and will allow for more complete longitudinal analysis between childhood and adolescence.Materials and Methods
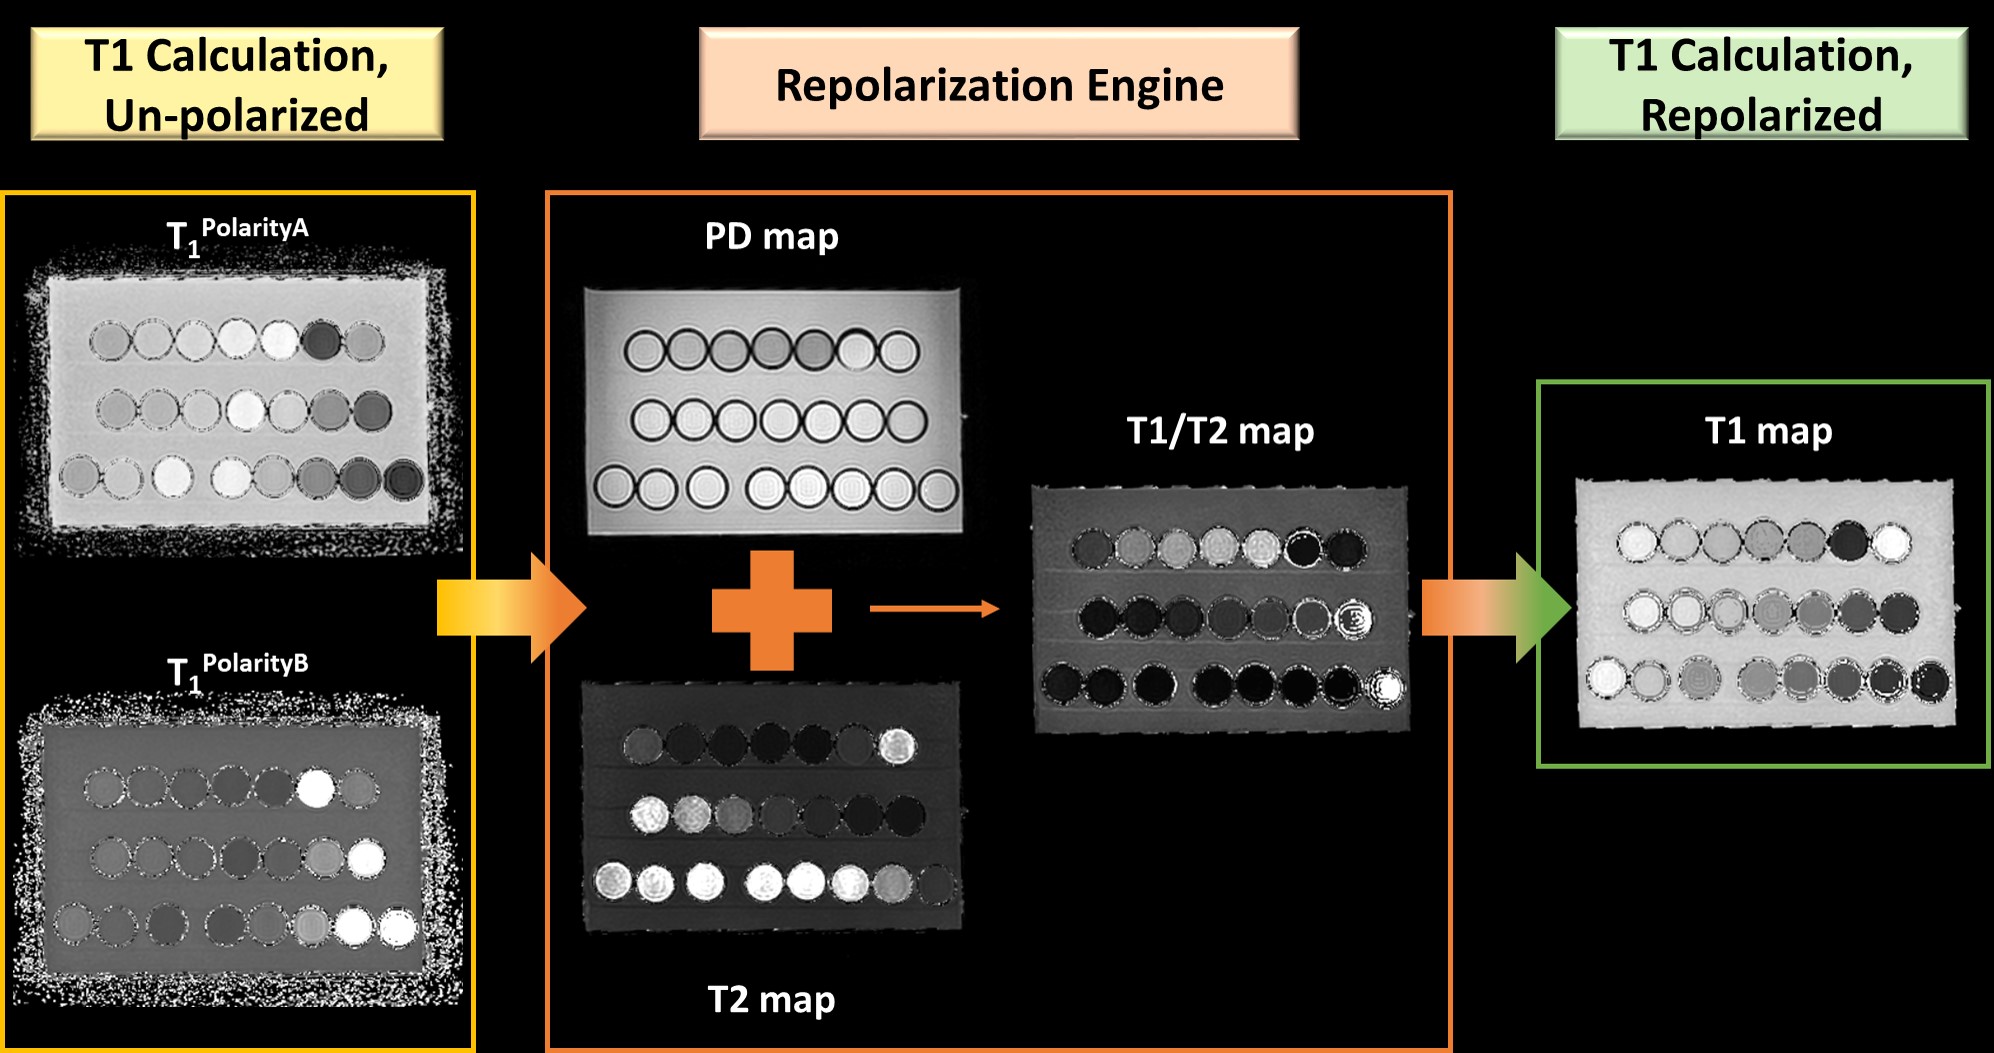
The T1 repolarization, multispectral qMRI and dual-clustering segmentation algorithms were developed with Python 3.5 in the Canopy integrated development environment. Directly-acquired images of from the second dual echo spin echo readout of the mixed-TSE were used to create maps of the transverse relaxation time (T2), and of normalized proton density (qPD) using custom qMRI algorithms (2,3). In this mixed-TSE experiment, two inversion times are considered (TI1&2 of 700ms and 0ms), where the second inversion time represents the second dual echo spin echo readout. Taking the ratio of the pixel values for the first echoes in each dual echo readout enables calculation of T1 (Equation 1). Since the directly-acquired data is does not contain phase information, where two solutions are necessary to account for both potential polarities of the directly-acquired magnitude images.Eq.1: $$T_1^{PolarityA} = \frac{-TI_{1}}{ln(0.5\times(1-\frac{pv_{E2}}{pv_{E1}}))} , T_1^{PolarityB} = \frac{-TI_{1}}{ln(0.5\times(1+\frac{pv_{E2}}{pv_{E1}}))}$$
The two polarity maps for T1 are fed to a qMRI-based repolarization engine (Figure 1). The repolarization engine utilizes the PD and T2, and a newly calculated T1-divided by-T2 map at each voxel location to select the proper polarity T1. Specifically, upon inspection of the two T1 maps, polarity B correctly maps cerebrospinal fluid (CSF) and heavily hydrated grey matter, while polarity A correctly maps white matter, lightly hydrated grey matter, and fat. Therefore, a threshold is applied to PD and T2 to isolate the very wet tissues of the brain (PD above 700 and T2 above 200) and stored as Polarity B. The remaining tissues are stored as Polarity A. This first pass calculation of T1 accurately maps all intracranial tissues. Fat is then isolated by taking the ratio of this partially repolarized T1 map with the T2 map, utilizing the difference in transverse relaxation time for CSF and fat. Very large ratios are selected as Polarity A, completing the repolarization.
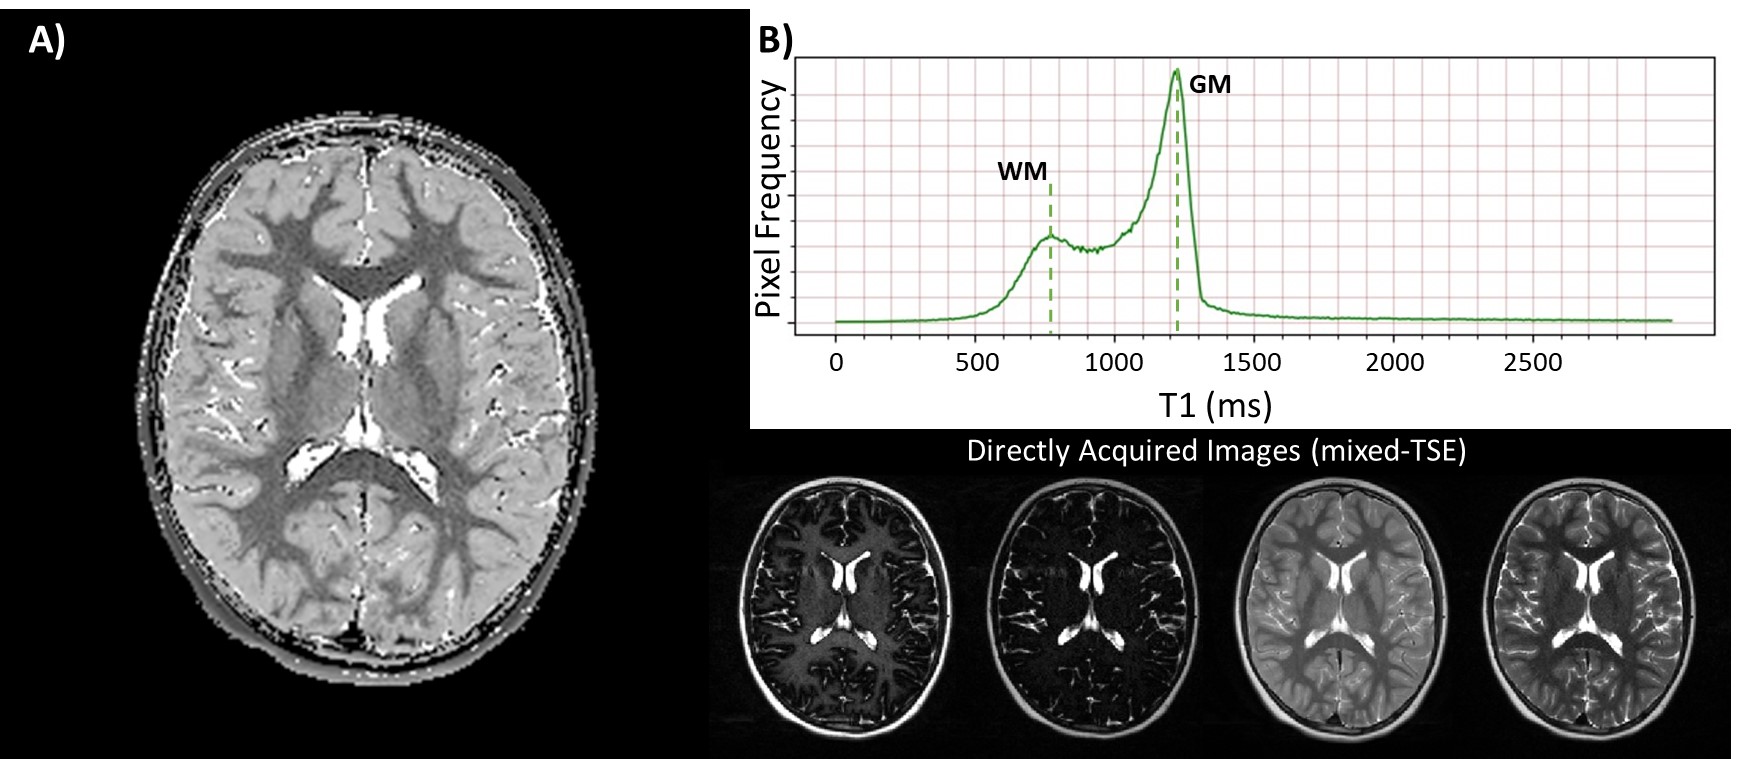
All in vivo images used for this study were obtained with Institutional Review Board approval and informed consent. One extremely preterm born individual at ages 9 was scanned with a 3T MRI protocol using a variant of the mixed turbo spin echo pulse sequence that is compatible across vendors (TI1 of 700ms, TE1&2eff of 6.3ms and 107ms, and TR of 11s). The distribution of T1’s throughout the intracranial matter was plotted to validate the presence of a bimodal distribution.
Results
Python algorithms were shown to reliably calculate an accurate T1 map for phantom and in vivo data via qMRI-based repolarization of magnitude images (Figure 2). The repolarization methodology is demonstrated in Figure 1. In vivo application of the qMRI-based T1 repolarization algorithm resulted in high contrast, qualitatively accurate maps throughout the whole head. A single slice at the lateral ventricles is shown for reference (Figure 2A). Furthermore, the characteristic bimodal distribution of T1 in vivo was demonstrated (Figure 2B).Discussion and Conclusions
A T1 calculation and qMRI-based repolarization technique using a variant of the mixed-TSE pulse sequence has been described and validated in vivo. This technique allows for calculation of T1 from directly-acquired magnitude images with two inversion times and lacking phase information. The second phase of the ELGAN study implemented a mixed-TSE pulse sequence variant to ensure applicability across all vendors. Therefore, a qMRI-based repolarization algorithm will allow longitudinal analysis of T1 evolution in the extremely preterm brain. Since this technique relies upon multispectral qMRI and dual-clustering segmentation algorithms, repolarization error is prone to develop at the boundaries between tissue types. Future work is required to ameliorate boundary error to ensure perfect qMRI-based T1 mapping.Acknowledgements
This work was supported in part by the National Institute of Neurological Disorders and Stroke (5U01NS040069-05 and 2R01NS040069-09), National Institutes of Health Office of the Director (1UG3OD022348-01), and the National Institute of Child Health and Human Development (5P30HD018655-28). We are indebted to Mr. Mitchell Horn for his assistance in preparing and scanning the phantom.References
1. Gowland, P. and M. Leach. A simple method for the restoration of signal polarity in multi‐image inversion recovery sequences for measuring T1. Magnetic resonance in Medicine 1991;18(1).
2. Jara, H. (2006). Synthetic images for a magnetic resonance imaging scanner using linear combinations of source images, Google Patents.
3. Suzuki, S., et al.. Combined volumetric T1, T2 and secular-T2 quantitative MRI of the brain: age-related global changes (preliminary results). Magnetic resonance imaging 2006;24(7).
Figures