1781
Cerebral oxygen extraction fraction mapping: comparison of dual-gas challenge calibrated BOLD and challenge-free gradient echo QSM+qBOLD1Biomedical Engineering, Cornell University, New York, NY, United States, 2McConnell Brain Imaging Centre, McGill University, Montreal, QC, Canada, 3Radiology, Weill Cornell Medical College, New York, NY, United States, 4Radiology, University of Calgary, Calgary, AB, Canada
Synopsis
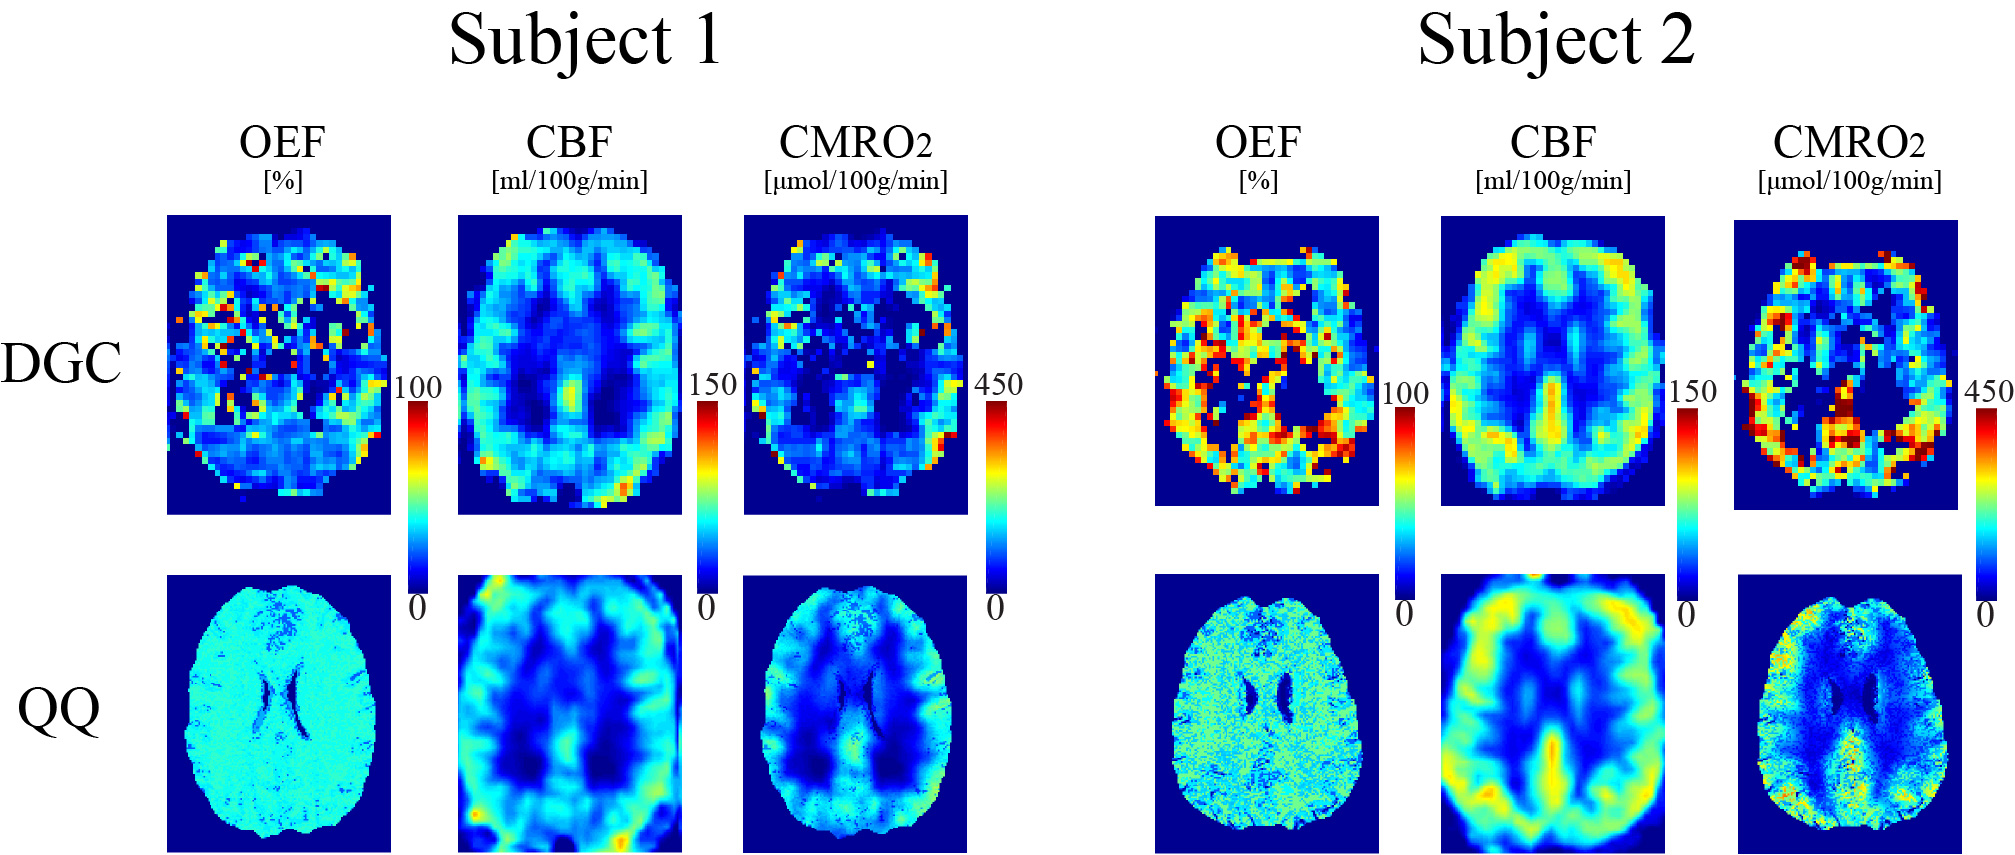
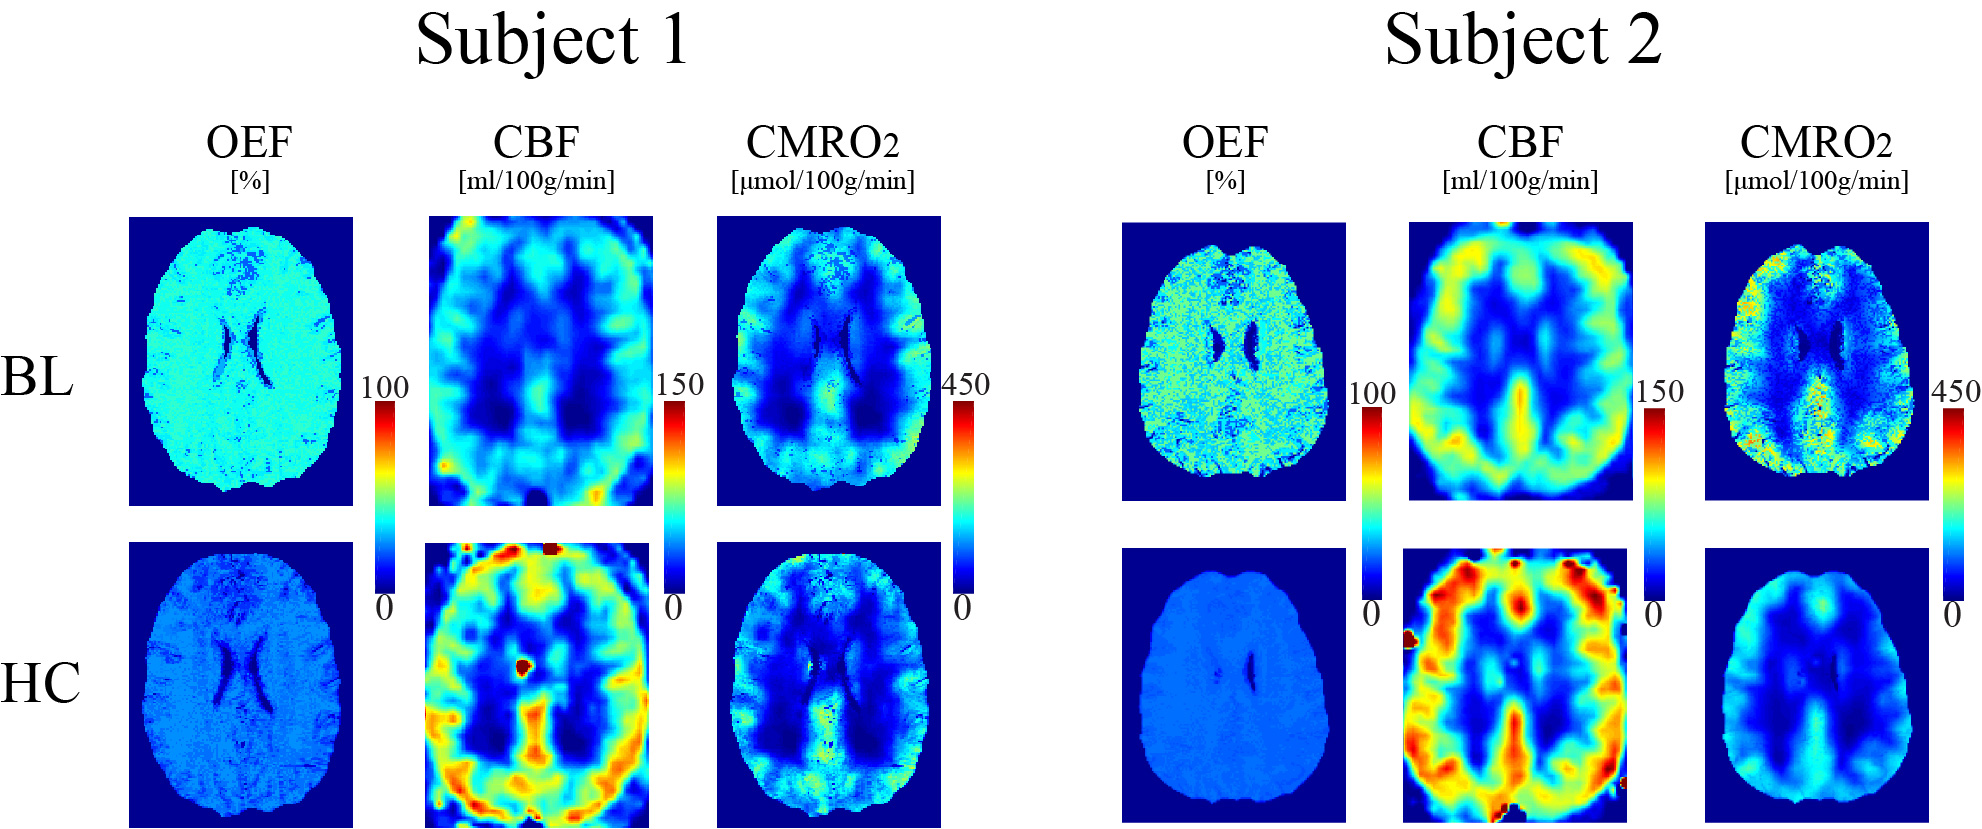
In this study, we compare cerebral oxygen extraction fraction (OEF) and metabolic rate of oxygen consumption (CMRO2) maps obtained using dual-gas challenge calibrated-BOLD (DGC) and challenge-free gradient echo quantitative susceptibility mapping plus quantitative blood oxygen level-dependent modeling (QSM+qBOLD or QQ) to explore the important clinical advantage of challenging-free data acquisition. In n=11 healthy subjects, cortical gray matter average OEF was not significantly different (36.4±1.9% and 38.0±9.1%, P=0.63) as was CMRO2 (151.4±17.6 and 168.2±54.1 μmolO2/min/100g, P=0.26), for QQ and DGC, respectively. QQ can measure OEF and CMRO2 at both baseline and hypercapnia independently, showing a 14% CMRO2 decrease in hypercapnia (P=0.039).
Introduction
Cerebral metabolic rate of oxygen consumption (CMRO2) and oxygen extraction fraction (OEF) are crucial for studying various diseases (1-4)(5)(6). Dual-gas challenge calibrated BOLD (DGC) (7) has been developed to map OEF and CMRO2 using hypercapnia and hyperoxia (8,9), but is difficult to administrate in clinical practice. Recently, a combined QSM modeling of phase signal and qBOLD modeling of phase signal (QSM+qBOLD or QQ) has been introduced to map OEF and CMRO2 without challenge (10,11), showing great potential for clinical use. The purpose here is to compare QQ with DGC and investigate changes in CMRO2 during hypercapnia, which is assumed to be constant in calibrated BOLD (7).Theory and Methods
OEF and CMRO2 can be expressed: $$$CMRO2 = CBF\cdot Y_{a}\cdot [H]\cdot OEF$$$ with $$$CBF$$$ as cerebral blood flow (m/100g/min), $$$Y_{a}$$$ arterial oxygenation, $$$[H]$$$ heme concentration.Oxygenation $$$Y$$$ and other parameters are estimated from multiecho gradient echo (mGRE) data through a combined QSM (phase) and qBOLD (magnitude) model (10,11): $$Y^{*},v^{*},R_{2}^{*},S_0^*,\chi_{nb}^{*}=\begin{array}{c}argmin\\Y,v,R_{2}, S_0, \chi_{nb}\end{array}\left\{ \begin{array}{c}\begin{array}{c}w||F_{QSM}\left(Y,v,\chi_{nb}\right)-\chi||_{2}^{2}\\+||S(t)-S_{qBOLD}\left(S_{0,},Y,v,R_{2,}\chi_{nb},t\right)||_{2}^{2}+\lambda\left(\overline{OEF(Y)}-OEF_{wb}\right)^{2}\end{array}\end{array}\right\} $$ Here $$$w$$$ is a weighting factor; $$F_{QSM}(Y,v,\chi_{nb})=\left[\frac{\chi_{ba}}{\alpha}+\psi_{Hb}\cdot\Delta\chi_{Hb}\cdot\left(-Y+\frac{1-\left(1-\alpha\right)\cdot Y_{a}}{\alpha}\right)\right]\cdot v + \left(1-\frac{v}{\alpha}\right)\cdot \chi_{nb}$$ where $$$v$$$ venous blood volume, $$$\chi_{nb}$$$ non-blood tissue susceptibility, $$$\chi_{ba}=-108.3$$$ppb (12), $$$\alpha$$$=0.77 (13), $$$\psi_{Hb}$$$=0.0909 for Hct=0.357 (14-17), $$$\Delta \chi_{Hb}$$$ = 12522 ppb (18,19);$$S_{qBOLD}\left(t\right)=S_0\cdot e^{-R_2\cdot t}\cdot F_{BOLD}\left(Y,v,\chi_{nb},t\right)\cdot G(t)$$ where $$$G(t)$$$ a macroscopic field effect (10), $$$F_{BOLD}\left(Y,v,\chi_{nb},t\right)=exp\left(-v\cdot f_{s}\left(\delta\omega\cdot t\right)\right)$$$ (20) with $$$f_s$$$ a signal decay by the blood vessel network (21), $$\delta \omega\left(Y,\chi_{nb}\right)=\frac{1}{3}\cdot \gamma \cdot B_{0}\cdot \left[Hct\cdot \Delta \chi_{0}\cdot \left(1-Y\right) + \chi_{ba}-\chi_{nb}\right]$$ where $$$\gamma$$$=267.513MHz/T, $$$B_0$$$=3T, $$$\Delta \chi_{0}=4\pi\times0.27 ppm$$$ (22). The third term is the physiological constraint that the whole brain average OEF, $$$\overline{OEF(Y)}$$$, should be similar to $$$OEF_{wb}$$$, the OEF value estimated from the straight sinus (11). We used cluster analysis of time evolution (CAT) to improve the robustness against noise (11).
DGC
BOLD signal difference by R2* change between rest and respiratory challenges (hypercapnia and hyperoxia) (7) was modeled for baseline OEF calculation (9). First, the calibration parameter M was calculated based on the Davis model (23,24) from the BOLD and CBF changes during a hypercapnic condition, assuming that CMRO2 is not altered. $$\frac{\Delta BOLD}{BOLD_{0}}=M\left(1-\left(\frac{CBF}{CBF_0}\right)^{\eta-\beta}\left(\frac{CMRO_2}{CMRO_{2,0}}\right)^{\beta}\right)$$ where $$M\equiv TE\cdot A\cdot CBV_{0}\cdot \left[dHb\right]^{\beta}_{v_0}$$ with $$$\eta$$$=0.18 (25). $$$\beta$$$ =1.3 at 3T (26). The hyperoxic condition induces BOLD signal changes by decreasing [dHb] in venous and capillary blood (27,28):$$\frac{\Delta BOLD}{\Delta BOLD_{0}}=M\left(1-\left(\frac{CBF}{CBF_{0}}\right)^{\eta}\left(\frac{[dHb]_{v}}{[dHb]_{v_{0}}}+\frac{CBF_{0}}{CBF}-1\right)^{\beta}\right)$$ M is obtained from hypercapnia with Eq. 5. OEF then can be calculated from the [dHb] change with an assumed CBF decrease of -3.11% (9).
Validation
QQ was compared with DGC in 10 healthy subjects at 3T: 1) For QQ, 3D mGRE data (1 mm3 voxel size, TE1/ΔTE/TE7 = 4.6/4.06/29.0 ms, TR= 32 ms) was acquired at baseline and during a hypercapnic condition. 2) For DGC BOLD, dual-echo pCASL (TR/TE1/TE2 = 4000/10/30 ms, label duration/post-label delay = 1665/900 ms; 3.9 mm3 voxel size) was acquired under a baseline condition, a hypercapnic challenge condition (increased PetCO2 of 7 mmHg above baseline), and two hyperoxic conditions (increased PetO2 of 150 mmHg and 300 mmHg above baseline). For ROI analysis, the cortical gray matter (CGM) mask was automatically segmented (29), and retaining the voxels with significant BOLD response to hyperoxia z > 2.3 and realistic OEF values from 0 to 1. The obtained CGM mask was resampled to the QSM resolution for ROI analysis of the QQ result.
Result
QQ showed a small and statistically non-significant difference in OEF values compared to DGC (n=10): 36.4 ± 1.9 and 38.0 ± 9.1 % (P=0.63), with corresponding CMRO2 of 151.4 ± 17.6 and 168.2 ± 54.1 μmol O2/min/100g (P=0.26) for QQ and DGC, respectively (Fig. 1) Also, QQ showed more uniform OEF map than DGC (Fig. 1). In hypercapnia (n=10), QQ showed lower OEF (36.4 ± 1.9 vs. 22.0 ± 3.6 %, P<0.01), higher CBF (57.0 ± 9.9 vs. 80.2 ± 11.6 %, P<0.01), slightly lower CMRO2 maps (151.4 ± 17.6 vs. 130.2 ± 28.6 μmol O2/min/100g, P=0.039) compared to those at baseline (Fig. 2).Discussion
OEF values from both QQ and DGC agree with literature values based on PET-OEF: 35 ± 7 % (30) and 40 ± 9 % (31). A high inter-subject variation in DGC may be attributed to low SNR in both BOLD and CBF signals, e.g. only 2.3 ± 0.5 % hypercapnia induced BOLD signal increase. The small OEF variation in QQ may have benefited from the usage of cluster analysis of time evolution (CAT) which improves effective SNR(11). Uniform OEF maps from QQ (Figure 1) is consistent with PET studies (31-33), which is difficult to investigate in DGC due to inaccuracies in white matter OEF caused by low BOLD and CBF SNR. QQ showed a 14% CMRO2 reduction in CGM due to hypercapnia. This agrees well with a recent study suggesting 10~15 % reduction with the similar hypercapnic level (34).Conclusion
This study shows that a recently proposed QQ provided similar OEF values in CGM, compared to a well-established DGC. Based on this validation, QQ can be readily applied in various diseases, such as stroke (35), tumor (36), multiple sclerosis (37), since it does not require a gas challenge. Furthermore, QQ revealed a mild decrease in CMRO2 with hypercapnia, which shall be considered in future calibrated BOLD studies.Acknowledgements
No acknowledgement found.References
1. Derdeyn CP, Yundt KD, Videen TO, Carpenter DA, Grubb RL, Jr., Powers WJ. Increased oxygen extraction fraction is associated with prior ischemic events in patients with carotid occlusion. Stroke 1998;29(4):754-758.
2. Yamauchi H, Fukuyama H, Nagahama Y, Nabatame H, Ueno M, Nishizawa S, Konishi J, Shio H. Significance of increased oxygen extraction fraction in five-year prognosis of major cerebral arterial occlusive diseases. Journal of nuclear medicine : official publication, Society of Nuclear Medicine 1999;40(12):1992-1998.
3. Derdeyn CP, Videen TO, Yundt KD, Fritsch SM, Carpenter DA, Grubb RL, Powers WJ. Variability of cerebral blood volume and oxygen extraction: stages of cerebral haemodynamic impairment revisited. Brain 2002;125(Pt 3):595-607.
4. Gupta A, Chazen JL, Hartman M, Delgado D, Anumula N, Shao H, Mazumdar M, Segal AZ, Kamel H, Leifer D, Sanelli PC. Cerebrovascular reserve and stroke risk in patients with carotid stenosis or occlusion: a systematic review and meta-analysis. Stroke 2012;43(11):2884-2891.
5. Ito M, Lammertsma AA, Wise RJS, Bernardi S, Frackowiak RSJ, Heather JD, McKenzie CG, Thomas DGT, Jones T. Measurement of regional cerebral blood flow and oxygen utilisation in patients with cerebral tumours using 15O and positron emission tomography: Analytical techniques and preliminary results. Neuroradiology 1982;23(2):63-74.
6. Ishii K, Kitagaki H, Kono M, Mori E. Decreased medial temporal oxygen metabolism in Alzheimer's disease shown by PET. Journal of nuclear medicine : official publication, Society of Nuclear Medicine 1996;37(7):1159-1165.
7. Blockley NP, Griffeth VE, Simon AB, Buxton RB. A review of calibrated blood oxygenation level-dependent (BOLD) methods for the measurement of task-induced changes in brain oxygen metabolism. NMR in biomedicine 2013;26(8):987-1003.
8. Gauthier CJ, Hoge RD. Magnetic resonance imaging of resting OEF and CMRO2 using a generalized calibration model for hypercapnia and hyperoxia. NeuroImage 2012;60(2):1212-1225.
9. Bulte DP, Kelly M, Germuska M, Xie J, Chappell MA, Okell TW, Bright MG, Jezzard P. Quantitative measurement of cerebral physiology using respiratory-calibrated MRI. NeuroImage 2012;60(1):582-591.
10. Cho J, Kee Y, Spincemaille P, Nguyen TD, Zhang J, Gupta A, Zhang S, Wang Y. Cerebral metabolic rate of oxygen (CMRO2) mapping by combining quantitative susceptibility mapping (QSM) and quantitative blood oxygenation level-dependent imaging (qBOLD). Magnetic resonance in medicine 2018;80(4):1595-1604.
11. Cho J, Zhang S, Kee Y, Spincemaille P, Nguyen TD, Hubertus S, Gupta A, Wang Y. Cluster analysis of time evolution (CAT) for quantitative susceptibility mapping (QSM) and quantitative blood oxygen level-dependent magnitude (qBOLD)-based oxygen extraction fraction (OEF) and cerebral metabolic rate of oxygen (CMRO2) mapping. Magnetic Resonance in Medicine;0(0).
12. Zhang J, Zhou D, Nguyen TD, Spincemaille P, Gupta A, Wang Y. Cerebral metabolic rate of oxygen (CMRO2) mapping with hyperventilation challenge using quantitative susceptibility mapping (QSM). Magnetic resonance in medicine 2017;77(5):1762-1773.
13. Hongyu A, Weili L. Cerebral venous and arterial blood volumes can be estimated separately in humans using magnetic resonance imaging. Magnetic resonance in medicine 2002;48(4):583-588.
14. Zhang J, Cho J, Zhou D, Nguyen TD, Spincemaille P, Gupta A, Wang Y. Quantitative susceptibility mapping-based cerebral metabolic rate of oxygen mapping with minimum local variance. Magn Reson Med 2017.
15. Sakai F, Nakazawa K, Tazaki Y, Ishii K, Hino H, Igarashi H, Kanda T. Regional cerebral blood volume and hematocrit measured in normal human volunteers by single-photon emission computed tomography. Journal of cerebral blood flow and metabolism : official journal of the International Society of Cerebral Blood Flow and Metabolism 1985;5(2):207-213.
16. Savicki JP, Lang G, Ikeda-Saito M. Magnetic susceptibility of oxy- and carbonmonoxyhemoglobins. Proceedings of the National Academy of Sciences 1984;81(17):5417-5419.
17. Hoffman R. Hematology: Basic Principles and Practice: Churchill Livingstone; 2005.
18. Zhang J, Liu T, Gupta A, Spincemaille P, Nguyen TD, Wang Y. Quantitative mapping of cerebral metabolic rate of oxygen (CMRO2) using quantitative susceptibility mapping (QSM). Magnetic Resonance in Medicine 2015;74(4):945-952.
19. Spees WM, Yablonskiy DA, Oswood MC, Ackerman JJ. Water proton MR properties of human blood at 1.5 Tesla: magnetic susceptibility, T(1), T(2), T*(2), and non-Lorentzian signal behavior. Magn Reson Med 2001;45(4):533-542.
20. Yablonskiy DA, Sukstanskii AL, He X. BOLD-based Techniques for Quantifying Brain Hemodynamic and Metabolic Properties – Theoretical Models and Experimental Approaches. NMR in biomedicine 2013;26(8):963-986.
21. Ulrich X, Yablonskiy DA. Separation of cellular and BOLD contributions to T2* signal relaxation. Magn Reson Med 2016;75(2):606-615.
22. Sukstanskii AL, Yablonskiy DA. Theory of FID NMR signal dephasing induced by mesoscopic magnetic field inhomogeneities in biological systems. J Magn Reson 2001;151(1):107-117.
23. Davis TL, Kwong KK, Weisskoff RM, Rosen BR. Calibrated functional MRI: mapping the dynamics of oxidative metabolism. Proc Natl Acad Sci U S A 1998;95(4):1834-1839.
24. Hoge RD, Atkinson J, Gill B, Crelier GR, Marrett S, Pike GB. Investigation of BOLD signal dependence on cerebral blood flow and oxygen consumption: the deoxyhemoglobin dilution model. Magn Reson Med 1999;42(5):849-863.
25. Chen JJ, Pike GB. MRI measurement of the BOLD-specific flow-volume relationship during hypercapnia and hypocapnia in humans. NeuroImage 2010;53(2):383-391.
26. Bulte DP, Drescher K, Jezzard P. Comparison of hypercapnia-based calibration techniques for measurement of cerebral oxygen metabolism with MRI. Magn Reson Med 2009;61(2):391-398.
27. Chiarelli PA, Bulte DP, Wise R, Gallichan D, Jezzard P. A calibration method for quantitative BOLD fMRI based on hyperoxia. NeuroImage 2007;37(3):808-820.
28. Mark CI, Fisher JA, Pike GB. Improved fMRI calibration: precisely controlled hyperoxic versus hypercapnic stimuli. NeuroImage 2011;54(2):1102-1111.
29. Kosior RK, Lauzon ML, Steffenhagen N, Kosior JC, Demchuk A, Frayne R. Atlas-based topographical scoring for magnetic resonance imaging of acute stroke. Stroke 2010;41(3):455-460.
30. Carpenter DA, Grubb RL, Jr., Tempel LW, Powers WJ. Cerebral oxygen metabolism after aneurysmal subarachnoid hemorrhage. Journal of cerebral blood flow and metabolism : official journal of the International Society of Cerebral Blood Flow and Metabolism 1991;11(5):837-844.
31. Raichle ME, MacLeod AM, Snyder AZ, Powers WJ, Gusnard DA, Shulman GL. A default mode of brain function. Proceedings of the National Academy of Sciences 2001;98(2):676-682.
32. Mintun MA, Raichle ME, Martin WR, Herscovitch P. Brain oxygen utilization measured with O-15 radiotracers and positron emission tomography. Journal of nuclear medicine : official publication, Society of Nuclear Medicine 1984;25(2):177-187.
33. Ito H, Kanno I, Kato C, Sasaki T, Ishii K, Ouchi Y, Iida A, Okazawa H, Hayashida K, Tsuyuguchi N, Ishii K, Kuwabara Y, Senda M. Database of normal human cerebral blood flow, cerebral blood volume, cerebral oxygen extraction fraction and cerebral metabolic rate of oxygen measured by positron emission tomography with 15O-labelled carbon dioxide or water, carbon monoxide and oxygen: a multicentre study in Japan. European Journal of Nuclear Medicine and Molecular Imaging 2004;31(5):635-643.
34. Driver ID, Wise RG, Murphy K. Graded Hypercapnia-Calibrated BOLD: Beyond the Iso-metabolic Hypercapnic Assumption. Frontiers in Neuroscience 2017;11(276).
35. Kudo K, Liu T, Murakami T, Goodwin J, Uwano I, Yamashita F, Higuchi S, Wang Y, Ogasawara K, Ogawa A, Sasaki M. Oxygen extraction fraction measurement using quantitative susceptibility mapping: Comparison with positron emission tomography. Journal of cerebral blood flow and metabolism : official journal of the International Society of Cerebral Blood Flow and Metabolism 2016;36(8):1424-1433.
36. Stadlbauer A, Zimmermann M, Kitzwogerer M, Oberndorfer S, Rossler K, Dorfler A, Buchfelder M, Heinz G. MR Imaging-derived Oxygen Metabolism and Neovascularization Characterization for Grading and IDH Gene Mutation Detection of Gliomas. Radiology 2017;283(3):799-809.
37. Trapp BD, Stys PK. Virtual hypoxia and chronic necrosis of demyelinated axons in multiple sclerosis. Lancet Neurol 2009;8(3):280-291.
Figures