1779
PCA-multiFuse: Visualising multi-dimensional data in a single colorised image1School of Engineering, Cardiff University, Cardiff, United Kingdom
Synopsis
A novel approach for image colorisation is presented, intended for situations where multiple contrasts are available covering the same anatomy. A colormap is created in a PCA-based hybrid parameter space, allowing signals from all contrasts to contribute to the final image colorization. Examples are shown from a dataset of high grade glioma patients, enabling rapid visual comparison between subjects. Within-subject there is clear contrast between healthy and pathological tissue, while contrast between healthy GM/WM/CSF is preserved.
Introduction
MR parameter flexibility often leads to protocols involving multiple acquisitions with different, and complementary, image contrast. It then becomes the challenge for the radiologist to amalgamate the information within each separate image to reach a single interpretation. In this work we attempted to find a method for image colorisation (fusing multiple contrasts into one) which would allow rapid visual identification of the shape and form of abnormal regions of tissue – and where features of interest are clearly represented regardless of whether the feature is present in one, several or all of the contributing contrasts.Methods
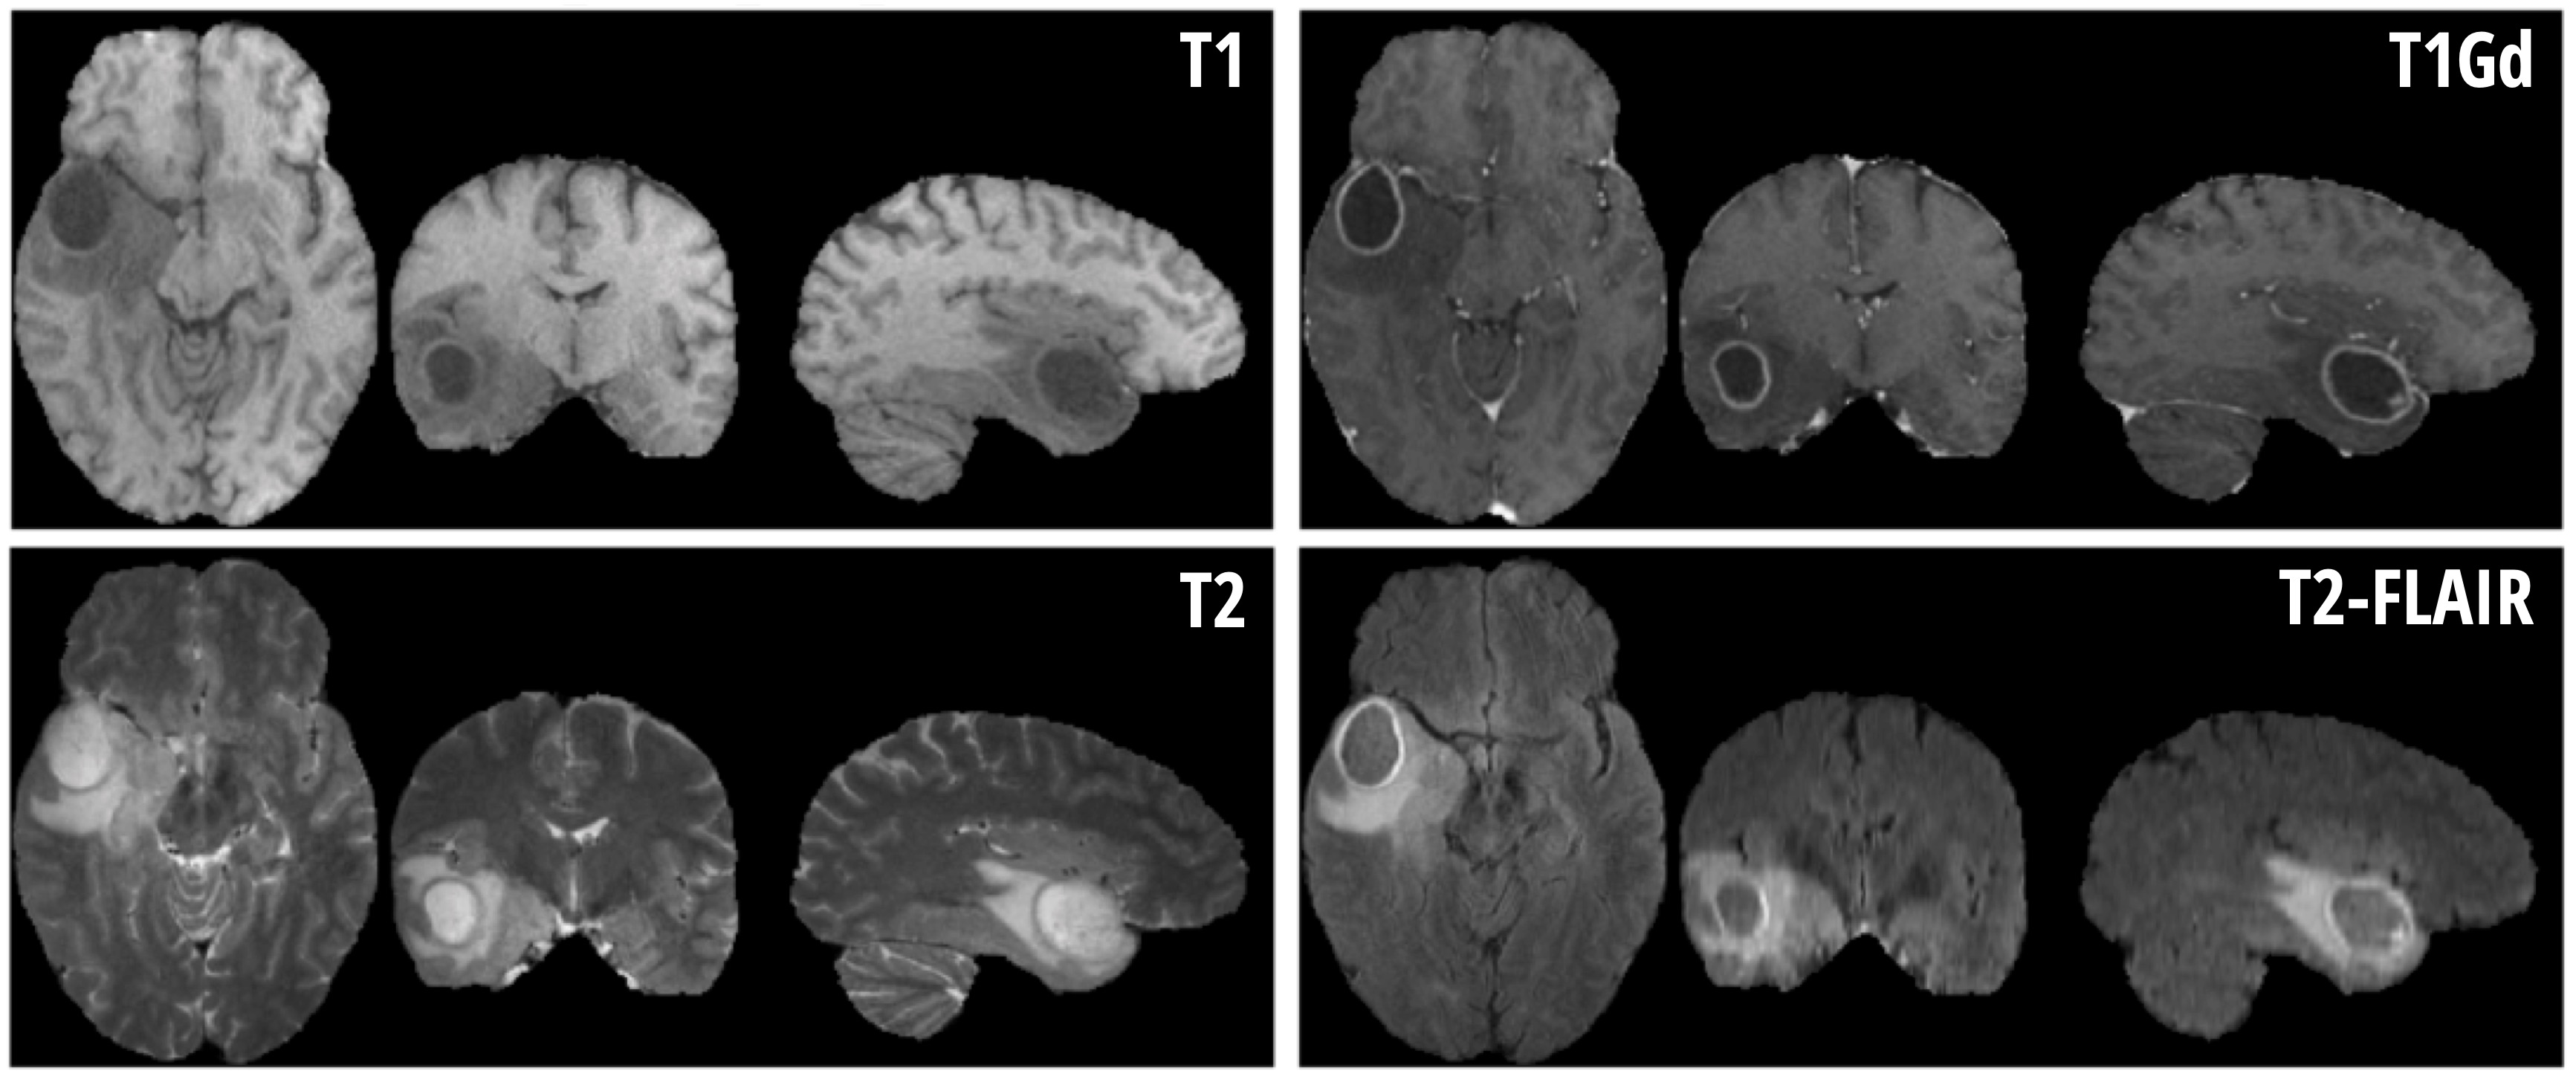
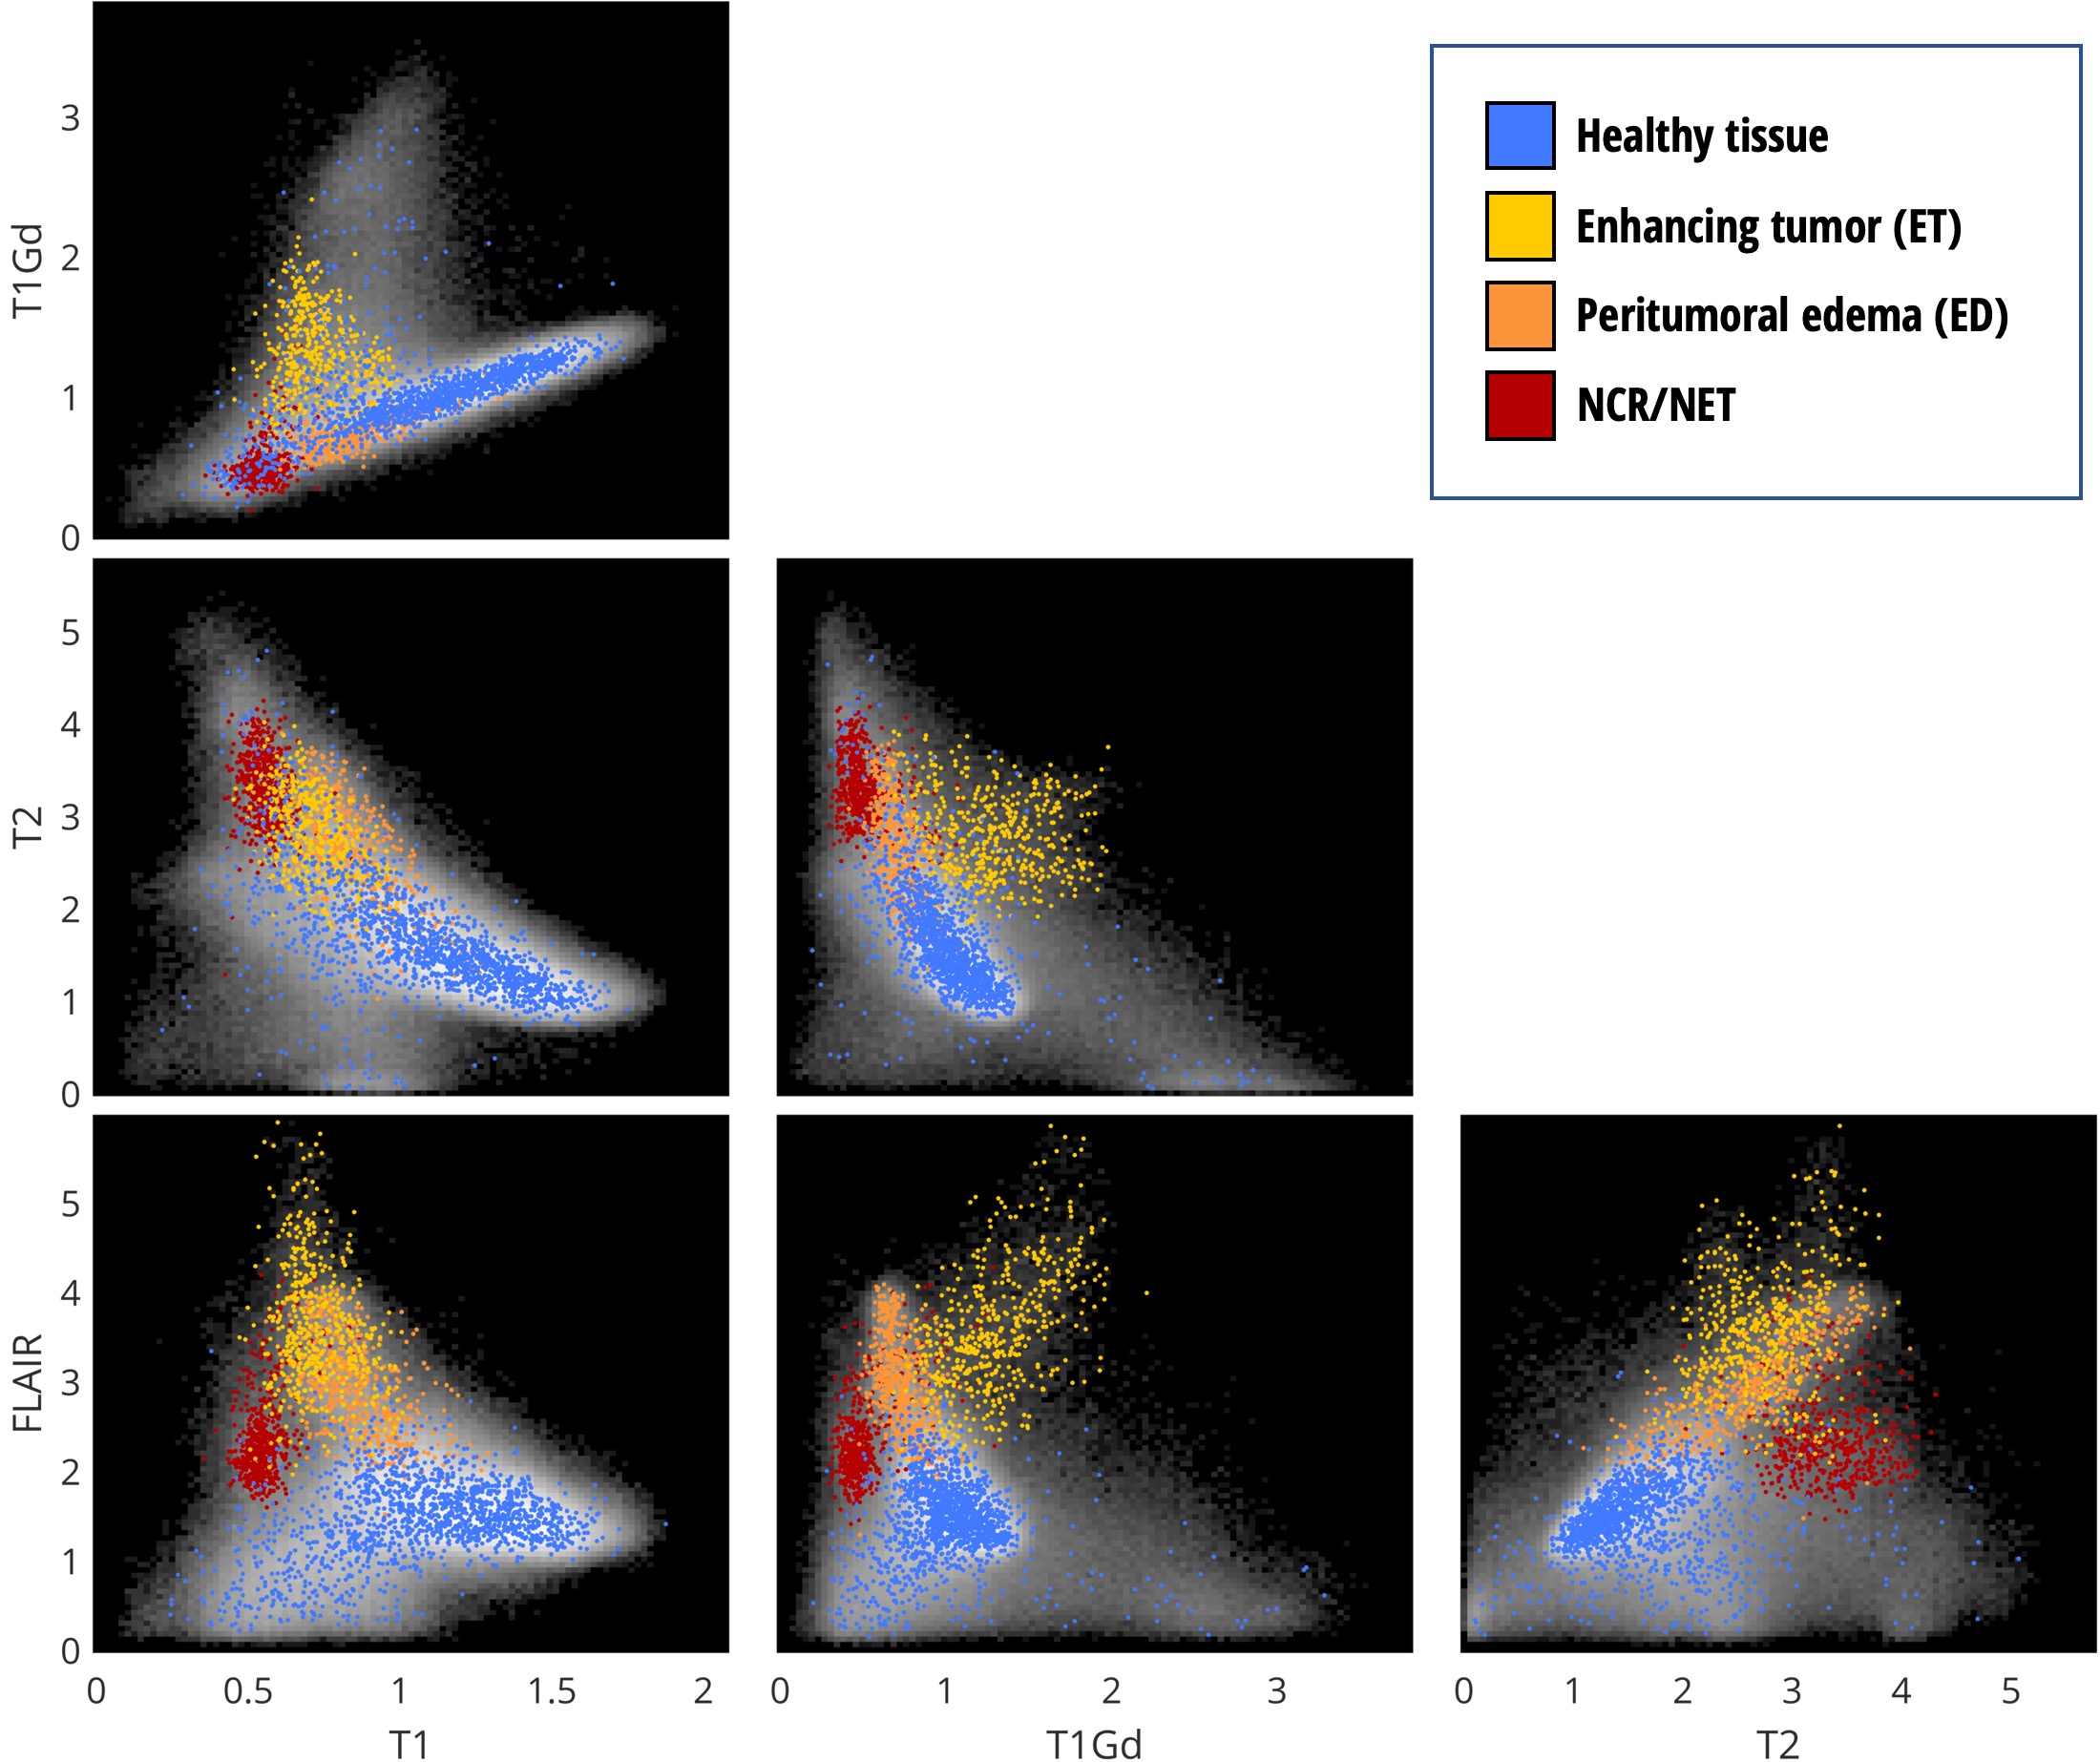
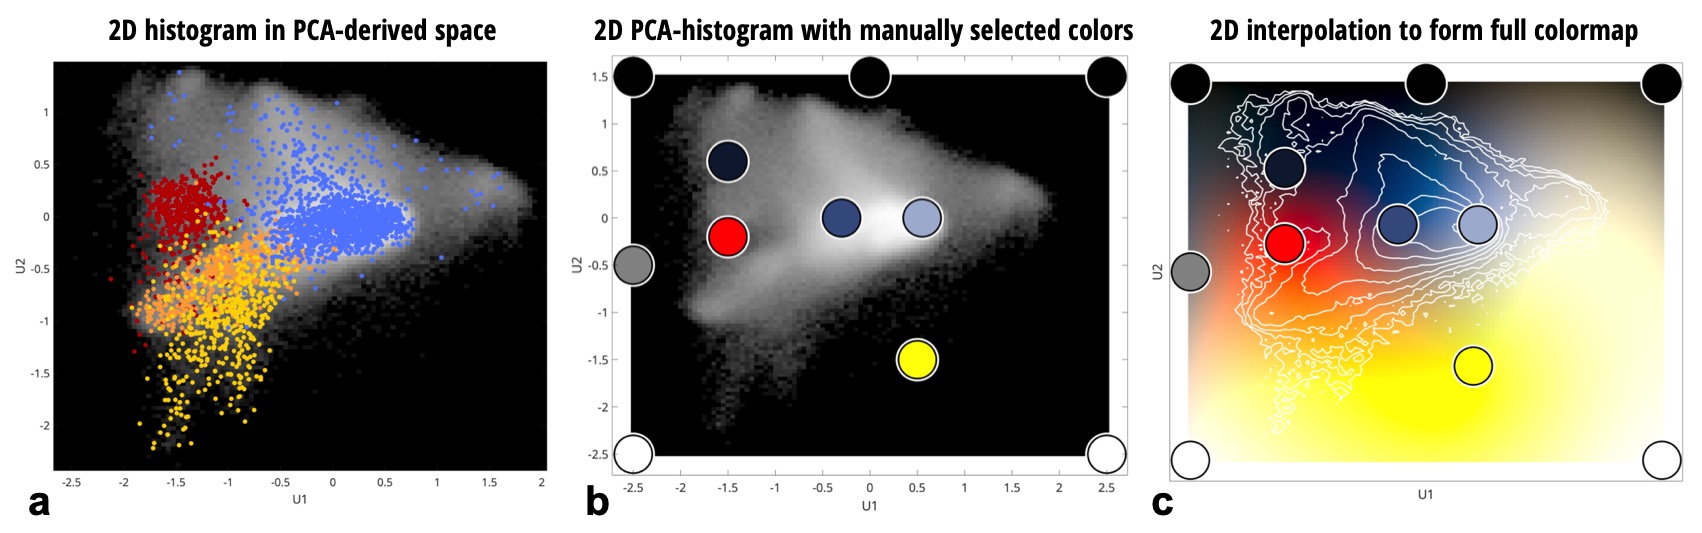
For this proof-of-concept work, a dataset made available through the Multimodal Brain Tumor Segmentation Challenge 2019 (BraTS ’19) 1-3 was used. Importantly, the dataset contains examples of pathology – as the method aims to highlight boundaries between healthy and pathological tissue. Due to the heterogeneity of the full dataset, a subset of 20 subjects with high-grade glioma were selected where the data were collected at a single institution and with visually similar image contrast and native resolution. For each subject in BraTS’19 there are four imaging contrasts available: T1, T1 with gadolinium contrast enhancement (T1Gd), T2 and T2-FLAIR (see Fig. 1). Prior to distribution, the data are already co-registered, interpolated to the same resolution (1mm isotropic) and skull-stripped. The ‘training’ data also has manually assigned labels available for Gadolinium-enhancing tumor (ET), peritumoral edema (ED) and necrotic and non-enhancing tumor core (NCR/NET).Figure 2 shows the 2D histograms between each of the image contrasts available for Subject 1, along with coloring to indicate the available labels from manual segmentation. Principal Component Analysis (PCA) was used to create a hybrid space from the first two PCA-eigenvectors of the 4 contrasts for Subject 1 – and is shown in Fig. 3a. Healthy and pathological tissue are well-separated in this space, and there remains reasonable spread of healthy signals to generate background GM/WM/CSF contrast. The linear weights from the PCA decomposition were saved – such that the same weights could then be applied to all other subjects to create the same hybrid space without further calculations being necessary.
A set of 11 color-control points were then manually defined in this PCA hybrid-space as shown in Fig. 3b. Shades of blue were used to define the region of healthy GM/WM/CSF and the boundaries were set to black, white or grey. A red point and a yellow point were defined to approximately correspond to the NCR/NET label and the ET label, respectively. These points are offset slightly from their apparent optimal position for this subject as there was found to be some variation between subjects in where these regions fall within the PCA hybrid space – and it was desired to have a single set of color-control points for all subjects in order to minimise any user intervention required once the colors have been defined.
The color-control points were then interpolated in CIELAB space across the full 2D PCA hybrid-space (CIELAB was used rather than RGB in order to allow variations in signal to be more uniformly perceptible as color changes). This resulted in the 2D colormap shown in Fig. 3c. This 2D colormap acts as a look-up table and allows full recolorisation of a new dataset (i.e. the combined set of T1, T1Gd, T2 and T2-FLAIR images) without further user intervention.
Results
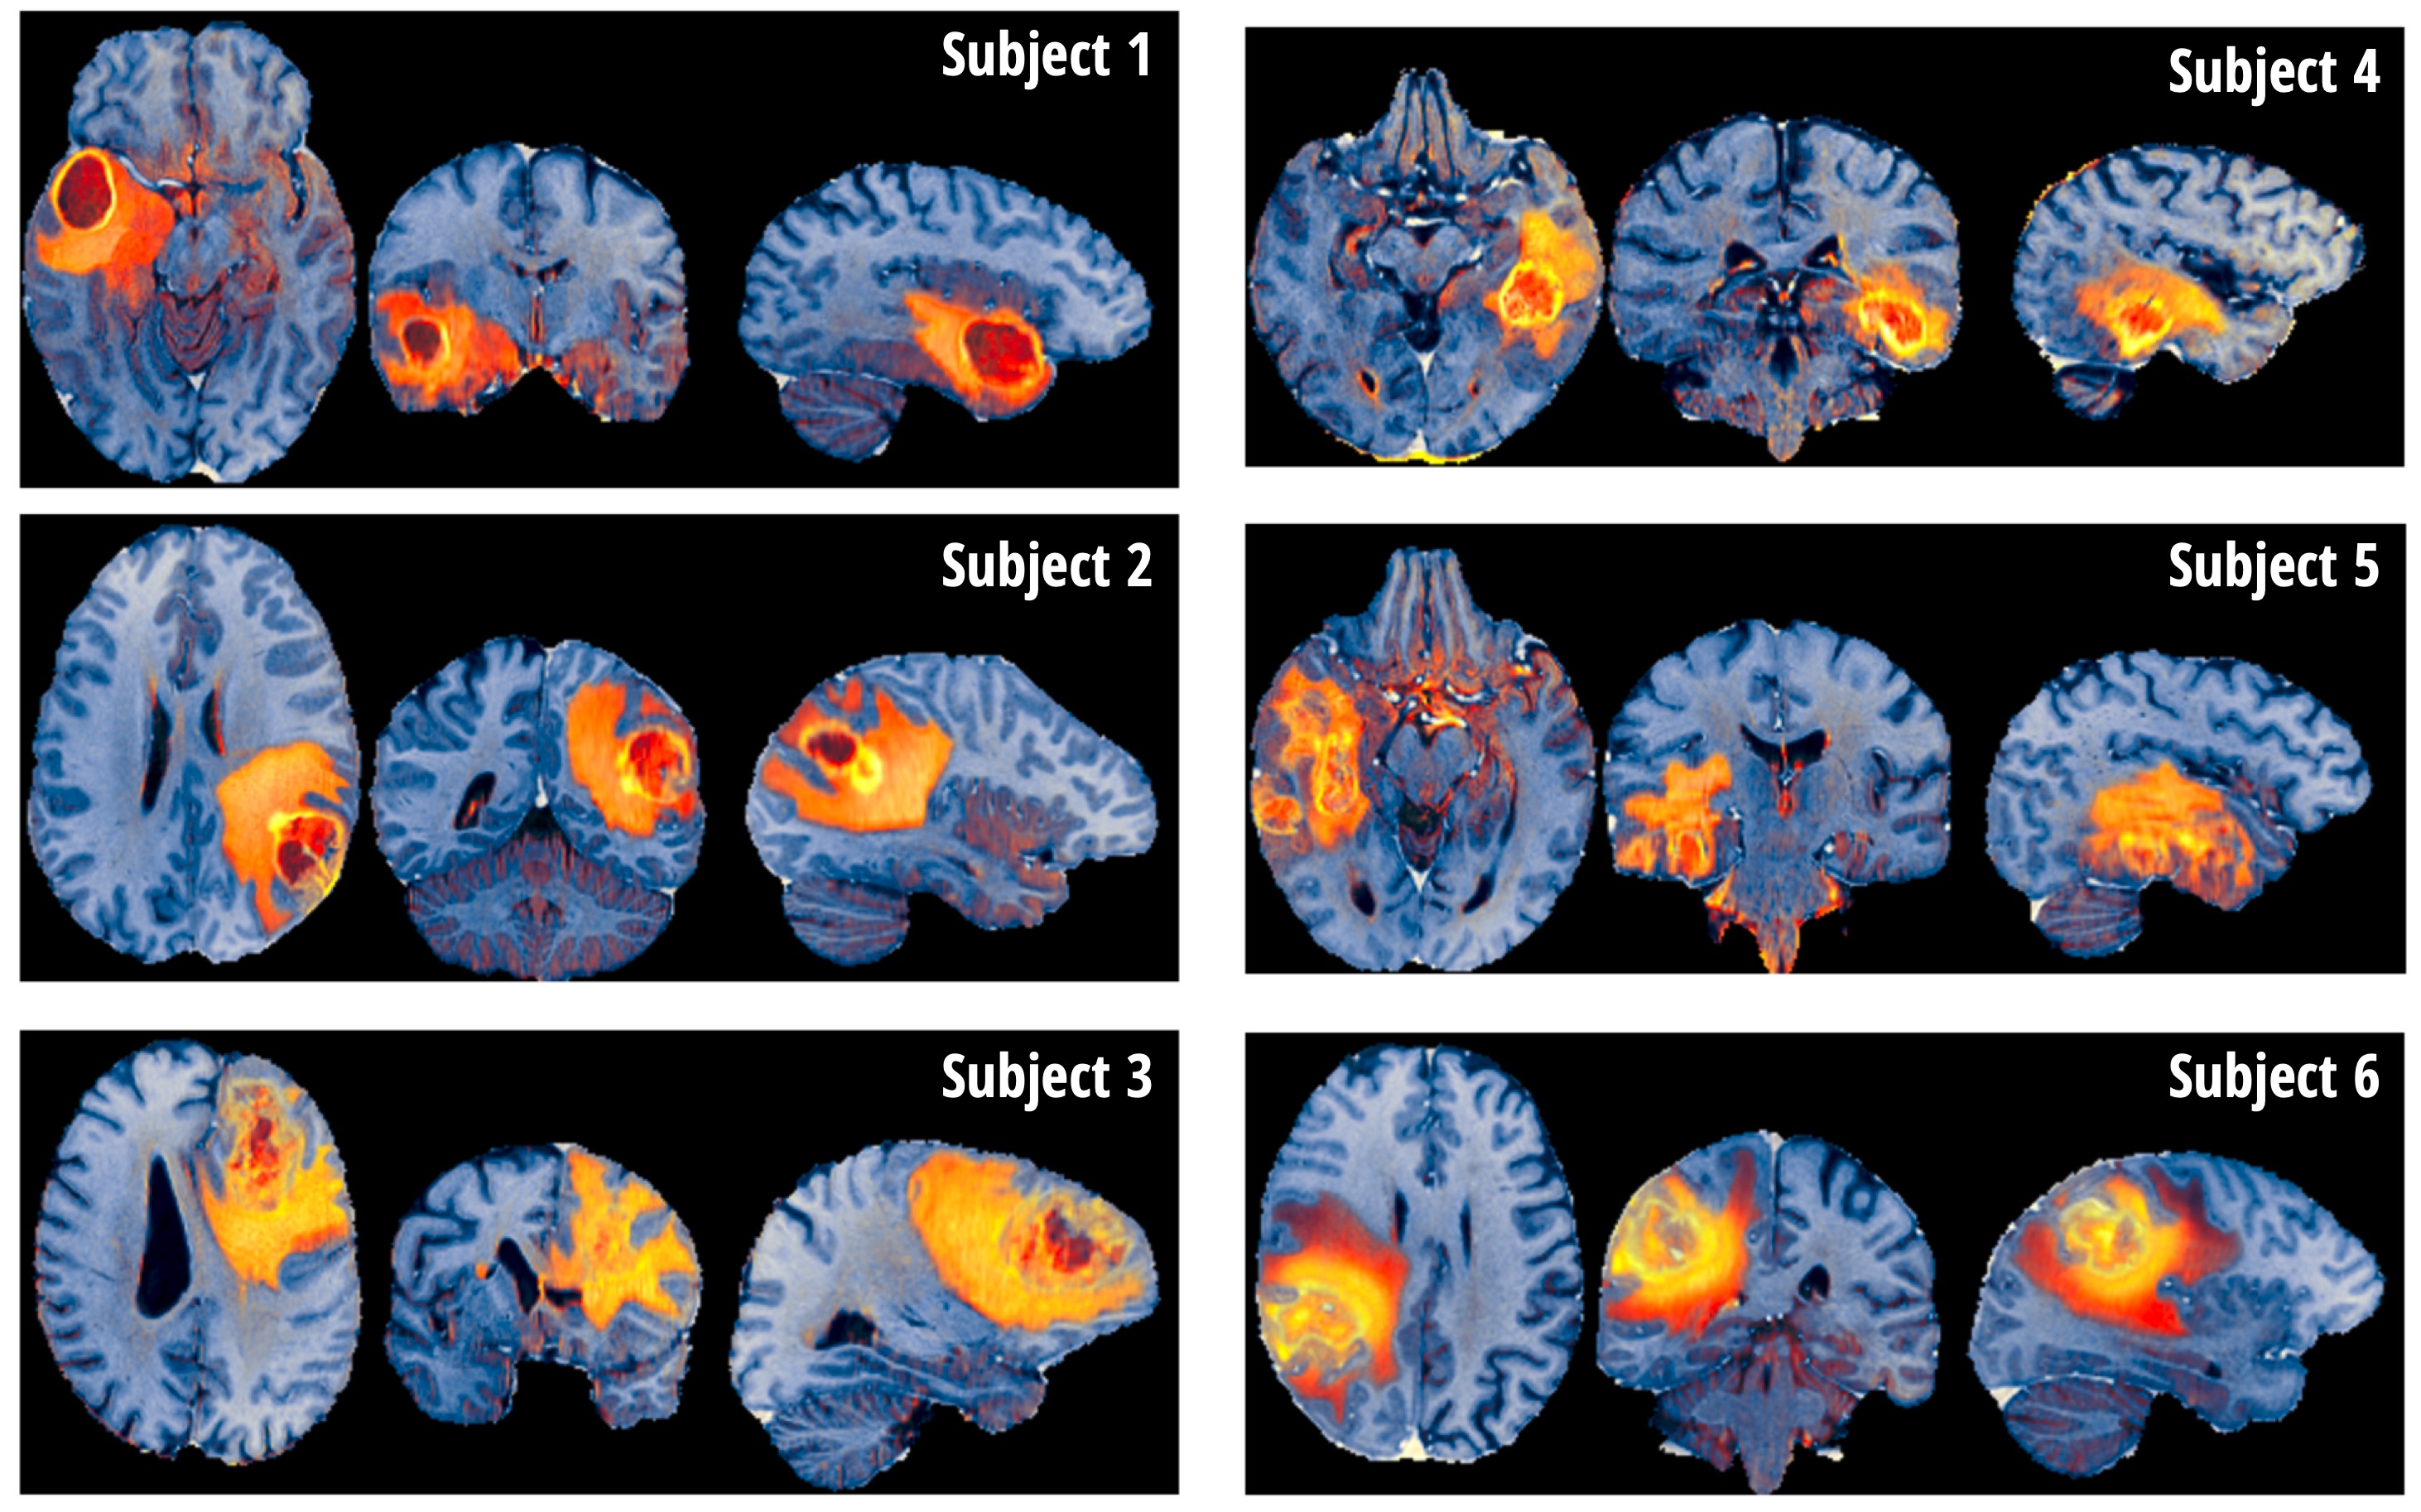
Figure 4 shows the proposed contrast, termed PCA-multiFuse, applied to data from 6 subjects. The PCA-multiFuse colorisation allows striking contrast between healthy and pathological tissue, while simultaneously preserving both healthy tissue contrast and intra-tumoral contrast.Discussion and Conclusion
The novel contrast afforded by PCA-multiFuse allows information from all 4 original contrasts to be conveyed in a single colorised image. Many 3D MRI dataviewers support data with (R,G,B) values, so the colorised image can be readily browsed in full 3D. As demonstrated in Fig. 4, collapsing the 4 contrasts into a single image allows rapid visual comparison between subjects. No further manual adjustment is required (e.g. windowing) and the full dynamic range of the signal variation is captured in a single image per subject.It should be noted that although the dataset used here included a manual segmentation of the pathological tissue, this is not a requirement to implement the PCA-multiFuse approach. As demonstrated, if this information is available it can be used to help identify signal clusters in joint histogram representations.
For the method to work well on unseen data, it is clear that it is necessary for the underlying images to have been acquired with similar protocols across subjects. We do not see this as a major limitation, as within an institution it is typical for the same protocols to be applied to similar patient groups.
Existing methods for image colorisation typically assign a color to a signal channel and allow color-mixing to represent their combination4. Such an approach is inherently limited to 3 signal channels, and leaves little control over the final image contrast and coloring. The PCA-multiFuse approach demonstrated here adds the flexibility of the choice of color-control points – and use of PCA allows an arbitrary number of original signal channels to contribute to the final image.
Acknowledgements
No acknowledgement found.References
[1] B. H. Menze, A. Jakab, S. Bauer, J. Kalpathy-Cramer, K. Farahani, J. Kirby, et al. "The Multimodal Brain Tumor Image Segmentation Benchmark (BRATS)", IEEE Transactions on Medical Imaging 34(10), 1993-2024 (2015) DOI: 10.1109/TMI.2014.2377694
[2] S. Bakas, H. Akbari, A. Sotiras, M. Bilello, M. Rozycki, J.S. Kirby, et al., "Advancing The Cancer Genome Atlas glioma MRI collections with expert segmentation labels and radiomic features", Nature Scientific Data, 4:170117 (2017) DOI: 10.1038/sdata.2017.117
[3] S. Bakas, M. Reyes, A. Jakab, S. Bauer, M. Rempfler, A. Crimi, et al., "Identifying the Best Machine Learning Algorithms for Brain Tumor Segmentation, Progression Assessment, and Overall Survival Prediction in the BRATS Challenge", arXiv preprint arXiv:1811.02629 (2018)
[4] Kather, J. N. et al. (2017) ‘Color-coded visualization of magnetic resonance imaging multiparametric maps’, Scientific Reports. Nature Publishing Group, 7, pp. 1–11. doi: 10.1038/srep41107.
Figures