1777
Comparison of EPI- and SSFP-PC with S-Transform for Separating Cardiac- and Respiratory-driven Intracranial CSF Motions under Free Breathing1Department of Human and Information Science, School of Information Science and Technology, Tokai University, Hiratsuka, Kanagawa, Japan, 2Department of Radiological Technology, Tokai University Hospital, Isehara, Kanagawa, Japan, 3Department of Neurosurgery, School of Medicine, Tokai University, Isehara, Kanagawa, Japan
Synopsis
To compare the performance of separating cardiac- and respiratory-driven intracranial CSF motions under free breathing with Stockwell transform (ST), real time phase contrast imaging based on echo planar imaging (EPI-PC) and steady state free precession (SSFP-PC) were compared. In 3 healthy volunteers, 3 patients with idiopathic normal pressure hydrocephalus (iNPH), and 2 patients with Chiari malformation, both PC schemes yielded almost the same image quality, although EPI-PC had relatively higher frame rate than SSFP-PC. These preliminary results indicated that both techniques in conjunction with ST will be useful to seize the CSF motions under free breathing.
Introduction
Needs for analyzing cerebrospinal fluid (CSF) dynamics has been increasing lately because the mass transfer function of CSF relates to neurodegenerative diseases, such as Alzheimer's disease.1,2 CSF motion seems to be governed by cardiac pulsation, respiration, and so-called bulk flow. Real-time phase contrast (PC) technique based on steady state free precession (SSFP) sequence, SSFP-PC, separated and quantified the cardiac- and respiratory-driven CSF velocities in the intracranial space under instructed breathing.3 Moreover, Stockwell transform or S-transform (ST) in conjunction with SSFP-PC represented the cardiac-driven and respiratory-driven CSF motions under free breathing through spectrogram analyses.4,5 However the temporal resolution of 217 ms/frame may not be sufficient to acquire the cardiac-driven CSF velocity. Meanwhile, PC based on echo planar imaging (EPI), EPI-PC, is expected to shorten the acquisition time. To examine and compare the performance of EPI-PC and SSFP-PC in quantifying the intracranial CSF motions under free breathing, in the present study, both techniques were conducted in combination with ST.Methods
Real-time SSFP-PC imaging using 3.0T MRI was conducted for 3 healthy volunteers (2 males; 1 female; 51±3 y-o), 3 patients with idiopathic hydrocephalus (iNPH) (2 males; 1 female; 74±1 y-o), and 2 patients with Chiari malformation (2 females; 18±5 y-o). An electrocardiogram (ECG) and a bellows-type pressure sensor were used to monitor the subjects’ cardiac pulsation and respiration. The following SSFP-PC images were acquired: flow encoding direction, foot-head; TR, 6.0 msec; TE, 3.9 msec; parallel imaging factor, 4; acquisition matrix, 89×128 (half Fourier); reconstruction matrix, 256×256; field of view, 28×28 cm2; slice thickness, 7 mm; velocity encoding (VENC), 10 cm/sec; data points, 256; temporal resolution, 217 ms (4.7 frame/sec).Real-time EPI-PC imaging using 1.5T MRI was performed for 1 healthy volunteer (1 male; 23 y-o). The imaging conditions of the EPI-PC were as following: flow encoding direction, foot-head; TR, 77.1 msec; TE, 31.2 msec; parallel imaging factor, 2.5; acquisition matrix, 126×128; reconstruction matrix, 256×256; field of view, 28×28 cm2; slice thickness, 5 mm; VENC, 5 cm/sec; data points, 2048; temporal resolution, 154 ms (6.5 frame/sec).
The formulation of ST6 is the following, noted the gaussian window length was adjusted for the frequency.
$$S_{v}(t, f)=\frac{|f|}{k\sqrt{2π}}\int_{-\infty}^{+\infty} v(\tau)e^{-\frac{(\tau-t)^2f^2}{2k^2}}e^{-2iπf\tau}d\tau \space, \space k>0$$
where Sv(t, f) is the spectrogram, v(t) is the velocity waveform obtained from PC images, f is the frequency, t, τ are the time, and k is a scale factor, basically 1 in this study, that controls the number of oscillation in the window.
Results and Discussion
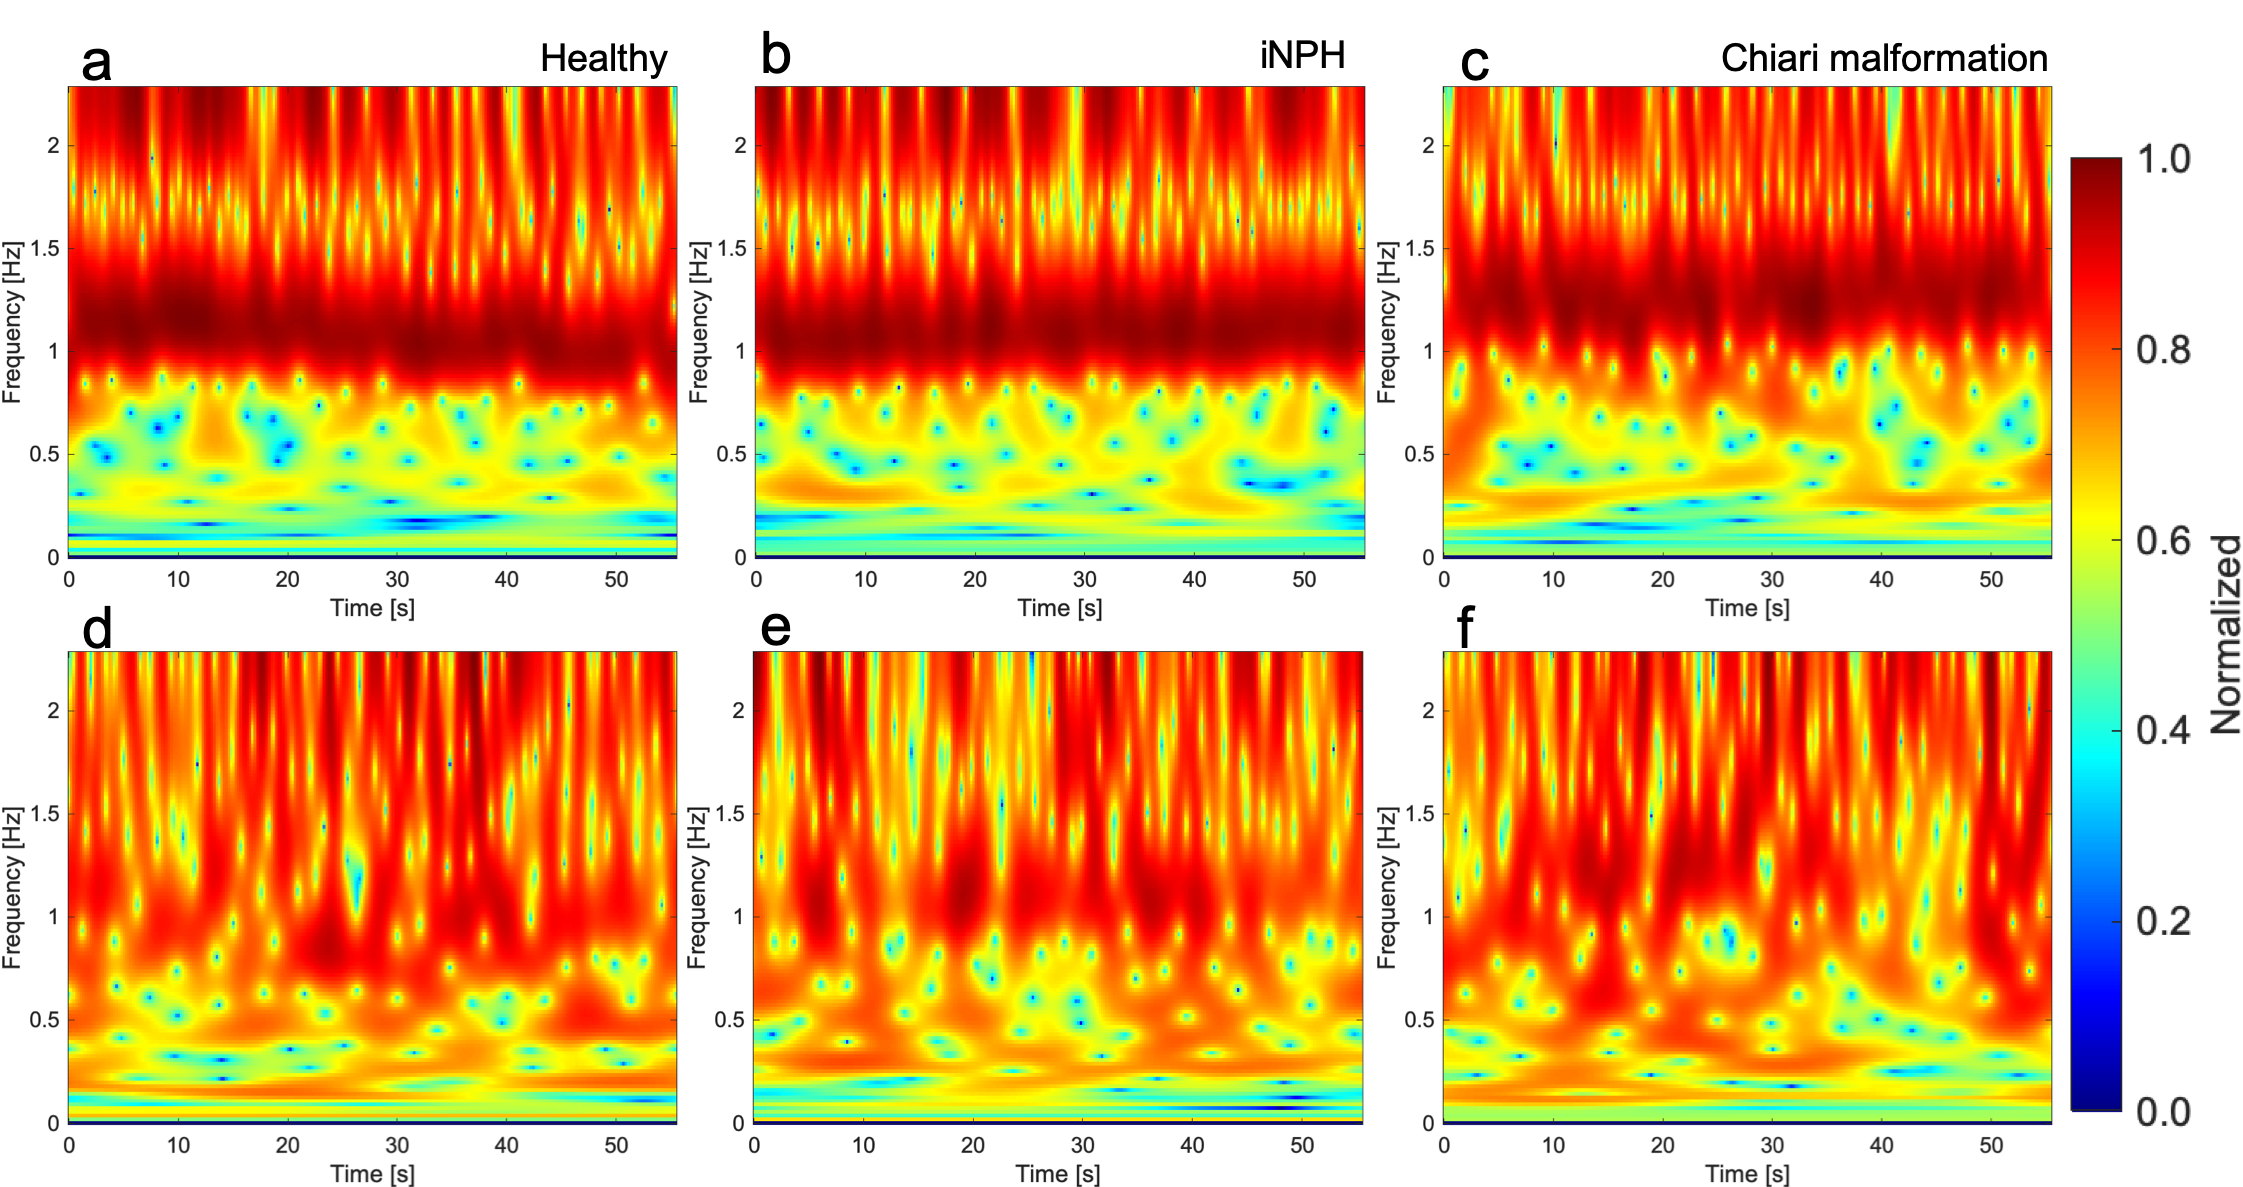
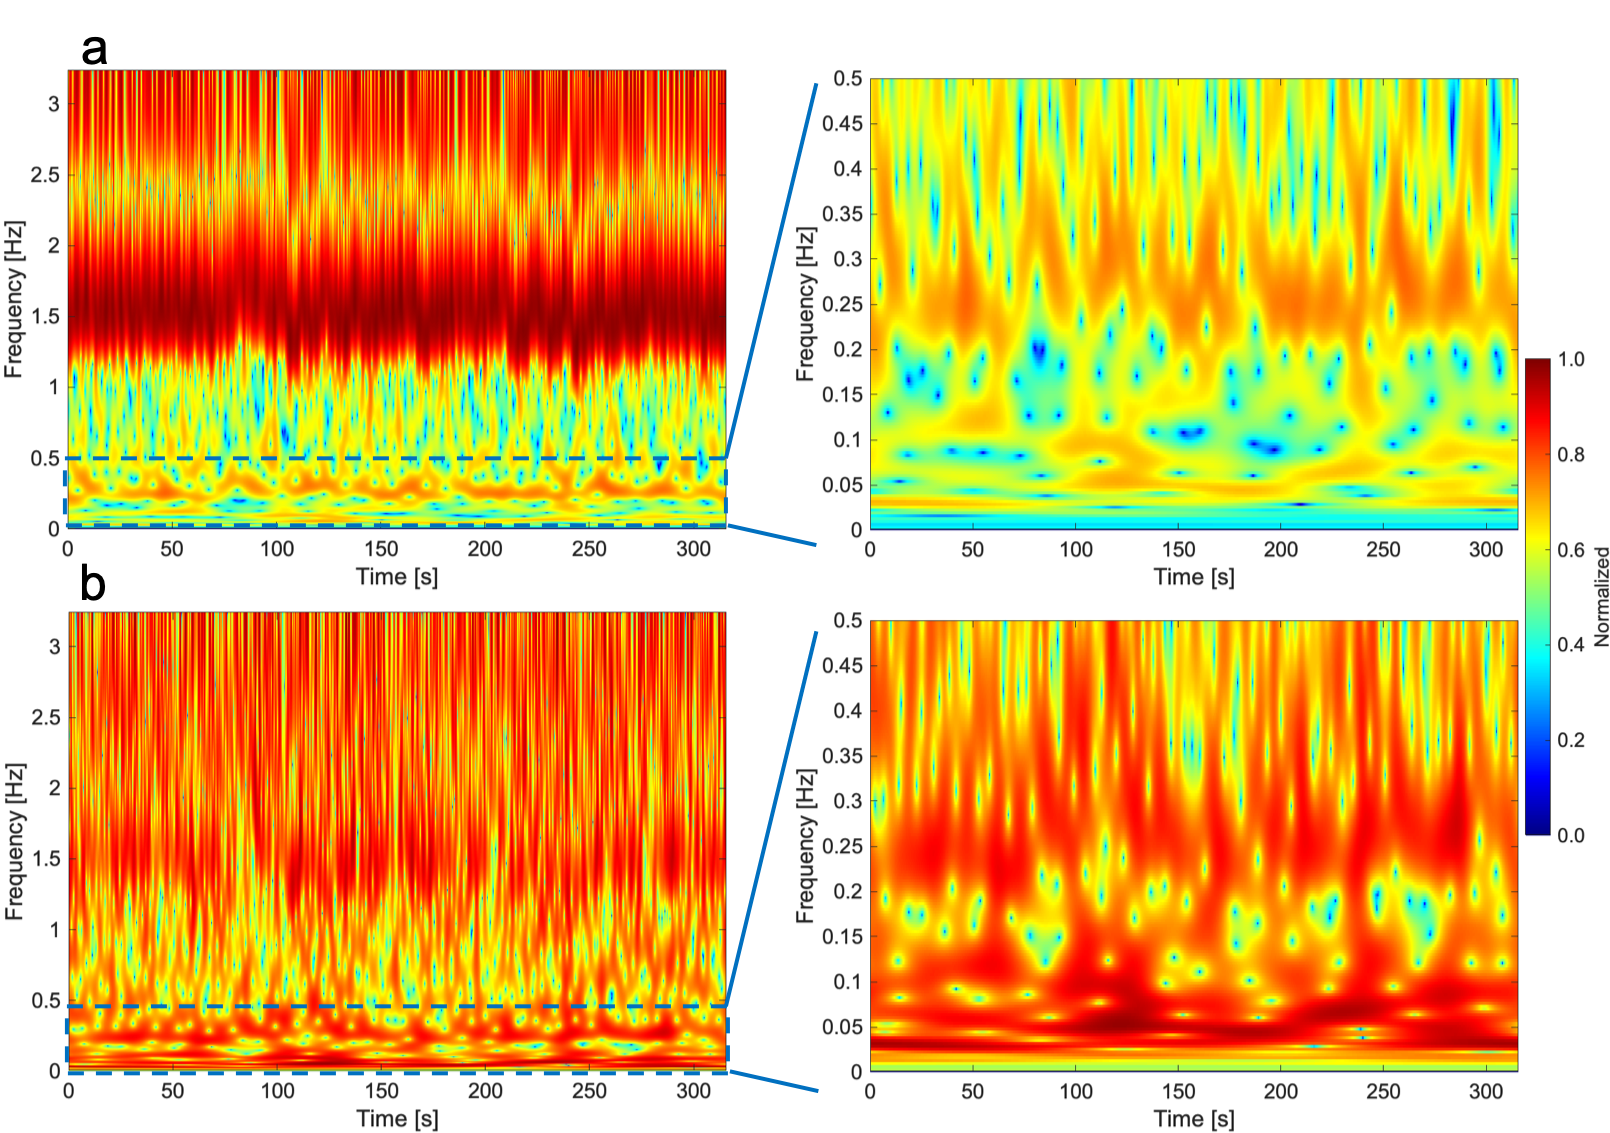
Spectrograms of CSF velocity of SSFP-PC images at the foramen magnum, ECG, and respiratory signals of the iNPH patient were shown in Fig. 1. Cardiac and respiratory frequency bands were clearly observed in the ECG and respiratory spectrograms. In the spectrogram of CSF velocity, both the cardiac and respirator components of CSF motions appeared in the same frequency bands, although the amplitude of the respiratory-driven component was relatively low. Since respiration affects the stroke volume of the cardiac pulsation,7 the respiratory component was exhibited in the ECG spectrogram. Figure 2 shows the spectrograms of the CSF velocity at the foramen magnum and fourth ventricle of a healthy volunteer (a, d), iNPH patient (b, e), and patient with Chiari malformation (c, f) acquired by SSFP-PC, respectively. Note that the color-coding of spectrograms was logarithmically converted to emphasize low amplitude component such as respiratory-driven that. The spectrograms at the foramen magnum of the subjects demonstrated that the cardiac-driven CSF motion was stronger than the respiratory that. In contrast, at the fourth ventricle, the amplitudes of the cardiac and respiratory components seemed to be simialr.On the other hand, the EPI-PC image, the CSF velocity at the aqueduct indicated by yellow rectangle on the EPI-PC image, and that spectrogram were shown in Fig. 3. The spectrogram of the CSF velocity also demonstrated that the cardiac-driven and respiratory-driven CSF motions were separated under the free breathing state, in particular that the cardiac-driven component was predominant in the same as the results of the SSFP-PC with ST. In addition, Fig. 4 exhibited the spectrograms of the CSF velocity in the foramen magnum (a) and the fourth ventricle (b). The respiratory-driven CSF motion component appeared in about 0.2-0.4 Hz of the spectrograms. In the result of the fourth ventricle, the cardiac-driven and respiratory-driven CSF motions had almost the same amplitudes. Moreover, the relative high amplitude in both the spectrograms was observed under 0.1 Hz. The interpretation of the result has not been completed yet; however, it is expected that the results contains meaningful information of the CSF motion.
In comparison between the EPI-PC and the SSFP-PC with ST, those techniques presented similar observation results with respect to the intracranial CSF motion under free breathing; however, the frame rate of the EPI-PC was relatively higher than that of the SSFP-PC. Meanwhile, the number of subjects that applied the EPI-PC was a few. Therefore, further research will be performed for more subjects to compare EPI-PC with SSFP-PC.
Conclusions
Real-time SSFP-PC and EPI-PC imaging was conducted for healthy volunteers, iNPH and Chiari malformation patients. The combination between ST and real-time PC techniques may provide the abundant information of CSF motion related with the CSF physiology and pathology.Acknowledgements
The authors thank Prof. Yutaka Imai for his assistance with MR imaging. Kagayaki Kuroda and Satoshi Yatsushiro thank Dr. Koichi Oshio at the Keio University School of Medicine for his valuable suggestions.References
1. Brinker T, Stopa E, Morrison J, Klinge P. A new look at cerebrospinal fluid circulation. Fluids and barriers of the CNS 2014;11:10.
2. Oreskovic D, Klarica M. A new look at cerebrospinal fluid movement. Fluids and barriers of the CNS 2014;11:16.
3. Yatsushiro S, Sunohara S, Matsumae M, Kuroda K. Propagation Patterns of Cardiac-driven and Respiratory-driven Cerebrospinal Fluid Velocity Waves Characterized by Correlation Mapping in Connunction with Asynchronous 2-Dimensional Phase Contrast Technique. In Proceedings of the 25th Annual Meeting of ISMRM, Honolulu, Hawaii, USA, 2017. p. 350.
4. Kuroda K, Tokushima T, Yatsushiro S, Kajiwara N, Horie T, Atsumi H, Matsumae M. Separation of Cardiac- and Respiratory-driven CSF Motions under Free Breathing based on Realtime Phase Contrast Imaging and S-Transform. In Proceedings of the 27th Annual Meeting of ISMRM, Montreal, QC, Canada, 2019. p. 238.
5. Stockwell RG, Mansinha L, Lowe RP. Localization of the complex spectrum: the S transform. IEEE Transactions on Signal Processing 1996;44(4):998-1001.
6. Schimmel M, Gallart J. The inverse S-transform in filters with time-frequency localization 2005. p. 4417-4422.
7. Korperich H, Barth P, Gieseke J, Muller K, Burchert W, Esdorn H, Kececioglu D, Beerbaum P, Laser KT. Impact of respiration on stroke volumes in paediatric controls and in patients after Fontan procedure assessed by MR real-time phase-velocity mapping. European heart journal cardiovascular Imaging 2015;16(2):198-209.
Figures