1776
Voxel-Based Quantitative Susceptibility Mapping of Brain Using Compressed SENSE Acceleration1Shandong Medical Imaging Research Institute,Shandong University, Jinan, China, 2Philips Healthcare, Shanghai, China
Synopsis
Quantitative susceptibility mapping (QSM) is an important technique for quantifying iron content in the brain. The conventional time of high spatial QSM data is too long. Compressed sensing acceleration (CS) technique can primarily reduce the acquisition time. We sought to evaluate the accuracy and stability of whole brain QSM on both the voxel-wise level and regional level by using several CS accelerations. We found significant differences in the magnetic susceptibility values on voxel-based QSM, but no statistically different in regions of interest. CS acceleration is feasible for QSM acquisition without influence the magnetic susceptibility values obviously.
Introduction
Quantitative susceptibility mapping (QSM) as a technique of MRI can quantitatively detect brain iron accumulation and blood-oxygen-level of the vein in vivo1 2, which is applied to many diseases, especially for neurodegenerative disease and cerebrovascular disease3. However, with the requirement of high spatial resolution QSM of whole-brain for research and clinic use, the scanning time of three-dimensional FFE sequence with multi TEs takes at least 16mins. Compressed sensing (CS) as an acceleration technique offers a possible way to shorten the scanning time. Few previous studies have evaluated the feasibility of using CS for QSM4, but most of them used in mouse5 and focused on the quality of images with lower reduction factors6. In our study, we aimed to evaluate the accuracy of using compressed sensing in voxel-wise QSM and find out a fast and stable acceleration factor for whole-brain QSM.Materials and Methods
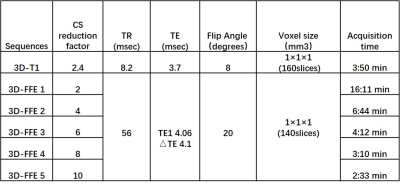
In this study, we recruited 8 healthy volunteers (mean age,24 years; age range 24-26 years; 6 women, 2 men). All participants were examined by three-dimensional T1-weighted sequence and three-dimensional FFE sequence with different CS reduction factors. Scans were performed on a 3.0T Ingenia CX MR imaging scanner (Philips Healthcare, the Netherlands). Figure 1 shows the detailed protocol parameters. QSM maps were reconstructed from magnitude and phase images by using STI Suite (http://people.duke.edu/~cl160/), using the iLSQR method to calculate QSM. The voxel-wise QSM analysis of the whole brain was processed on SPM12 (Wellcome Department of Imaging Neuroscience, University College, London, UK)7. First, the 3D-T1 image was co-registered to the magnitude image of the first echo of each subject. All the T1 images were then segmented to acquire normalizing parameters. QSM images were normalized to the MNI space using the deformation fields of previous steps. We used ANOVA-within-subjects with cluster-level FDR correction to compare the different voxel-wise magnetic susceptibility values among CS reduction factors. We also compared the mean magnetic susceptibility values of 4 regions of interests (ROIs) using ANOVA test, including both sides caudate nucleus, globus pallidus, putamen, and thalamus, which are susceptible regions in neurodegenerative disorders.Results
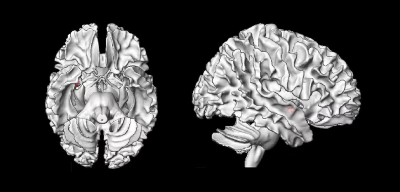
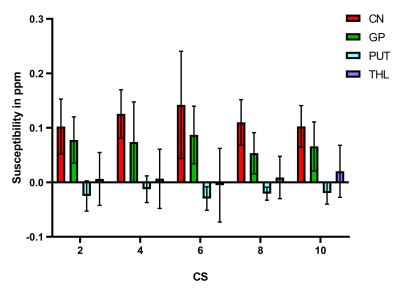
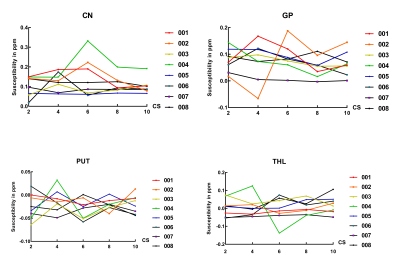
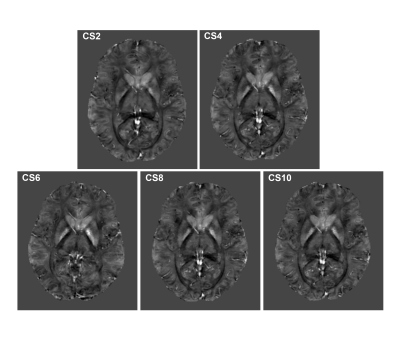
Voxel-based QSM analysis showed significantly different susceptibility values in right putamen (FDR<.05; at least 17 contiguous voxels). Figure 2 shows voxel-wise comparisons of the magnetic susceptibility values among different CS reduction factors. Regionally, there are no significant differences of magnetic susceptibility values (ppm=parts per million) in 4 ROIs, including caudate nucleus (p=0.672), globus pallidus (P=0.753), putamen (P=0.611), and thalamus (p=0.911). Figure 3 shows the mean magnetic susceptibility values of ROIs among different CS. Figure 4 shows the magnetic susceptibility values of each participant in 4 ROIs. For the image quality, with the increasing of CS reduction factors, the SNR decreased.Discussion
Long MR scanning time of high spatial resolution QSM image limits its use for clinic and research. We intended to find the fastest and stable CS reduction factors with no apparent changes in image quality and accuracy of magnetic susceptibility values. In this work, we used voxel-based QSM analysis to evaluate the differences inside the whole brain among different CS reduction factors. We found significant differences in the right putamen, and the number of voxels is only 35. For the ROIs analysis, all the magnetic susceptibility values are statistically equivalent. In a few individual participants, we found apparent fluctuations in CS reduction factor 4 and 6. CS reduction factor 8 and 10 for QSM data acquisition were more stable and accurate of magnetic susceptibility values. However, the noise increased with increasing reduction factors. Study Limitations: the sample size is small for voxel-based QSM analysis. Moreover, we didn’t involve clinical evaluation. In the future, we will expand the sample size and focus on different clinical conditions.Acknowledgements
No acknowledgement foundReferences
1. Schweser, F., Sommer, K., Deistung, A. & Reichenbach, J. R. Quantitative susceptibility mapping for investigating subtle susceptibility variations in the human brain. Neuroimage 62, 2083–2100 (2012).
2. Haacke, E. M., Tang, J., Neelavalli, J. & Cheng, Y. C. N. Susceptibility mapping as a means to visualize veins and quantify oxygen saturation. J Magn Reson Imaging 32, 663–676 (2010).
3. Wang, Y. & Liu, T. Quantitative susceptibility mapping (QSM): Decoding MRI data for a tissue magnetic biomarker. Magn Reson Med 73, 82–101 (2015).
4. Wu, B., Li, W., Guidon, A. & Liu, C. Whole Brain Susceptibility Mapping Using Compressed Sensing. Magn Reson Med 67, 137–147 (2012).
5. Wang, N. et al. Accelerating quantitative susceptibility imaging acquisition using compressed sensing. Phys Med Biol 63, 245002 (2018).
6. Wu, Y. et al. Accelerated MR diffusion tensor imaging using distributed compressed sensing. Magn Reson Med 71, 763–772 (2014).
7. Kim, H.-G. et al. Quantitative susceptibility mapping to evaluate the early stage of Alzheimer’s disease. NeuroImage: Clinical 16, 429–438 (2017).
Figures
