1774
Difference in Morphometry Measures of 1mm and 0.6mm MPRAGE data with Prospective Motion Correction at 3T1NMRF, National Institutes of Health, Bethesda, MD, United States, 2NIMH, National Institutes of Health, Bethesda, MD, United States, 3MR Development and Application Center, University Medical Center Freiburg, Freiburg, Germany
Synopsis
Higher resolution anatomical images can provide more accurate estimates of morphometric measures extracted from segmentation algorithms. Acquisition of submillimeter MPRAGE data at 3T requires long scan times making it prone to subject motion. Prospective motion correction (PMC) techniques can mitigate these effects by tracking brain motion and updating scan parameters accordingly. Here, we compare morphometric measures from 1.0mm and 0.6mm isotropic resolution MPRAGE data obtained at 3T while using PMC. Results show that good quality 0.6mm MPRAGE data can be acquired with PMC in approximately 30minutes. Increased cortical thickness in some brain regions is seen with higher resolution data.
Introduction
Morphometry measures are valuable markers in Neuroscience. It has been shown that higher resolution (0.75 mm) MPRAGE data at 7T provide more accurate estimates of morphometric measures than 1mm data1. Submillimeter MPRAGE data at 3T with sufficient contrast-to-noise ratio (CNR) requires significantly longer scan times than at 7T, making them prone to subject motion. Subject moton has deleterious effects on high-resolution structural MRI. The image artifacts from motion not only result in poor image quality, but also bias the anatomical morphormetric measures extracted from segmentation algorithms2. Prospective motion correction (PMC) techniques can mitigate these effects by tracking brain motion and updating the scan parameters accordingly3. It has been shown that the reproducibility and accuracy of cortical and subcortical measures (thickness and volumes) can be significantly improved when using PMC techniques in the presence of motion4-8. In this study, we compare morphometric measures from 1.0 mm and 0.6 mm isotropic resolution MPRAGE data obtained at 3.0 T while using PMC to mitigate effects due to subject motion.Methods
MPRAGE data were acquired on healthy adults (n=8) at 3T with a 32-channel head coil using PMC. The following scan parameters were used for 1mm data: TE/TR=2.2/2530ms, TI=1100ms, FA=7°, iPAT = 2, FAT saturation, 1x1x1mm, scan time = 6 min 2 s. The following scan parameters were used for 0.6mm data: TE/TR =2.5/5000ms, TI=1340ms, FA=6°, no iPAT, FAT saturation, 0.6x0.6x0.6, scan time = 33 min 20 s. PMC was accomplished using a Moire phase tracking marker and optical system (KinetiCor, HI, USA)9. The maker was affixed to a plastic rod (4 cm) glued to a sports mouth guard (ArmourShield, Under Armour, MD, USA) customized for each subject by molding to fit the upper teeth. Motion parameters generated by the camera were captured by the scanner and used to update the gradient and RF pulses to maintain the scan plane and FOV before acquisition of each k-space line. Data was also acquired at 0.6mm without PMC, using the same scan parameters for 4 subjects. The cortical morphometry measures were extracted using the developmental version of FreeSurfer (dated August 7th, 2018) with modification to process submillimeter data at native resolution10. The difference in morphometry measures between the 0.6mm and 1mm data were calculated and normalized to that of 1mm data. All measures were tested for significant differences using paired T-tests between 1mm and 0.6mm data. After Bonferroni correction for multiple comparisons, the level for significance was p<0.00074. To assist in comparision with existing literature, the SNR was calculated as average intensity of whitter matter voxels divided by the standard deviation, while CNR was the difference between the average white matter and gray mater voxel intensities divided by the standard deviation of white matter intensities1. White and gray matter voxels were defined by FreeSurfer in the aseg.mgz volume.Results
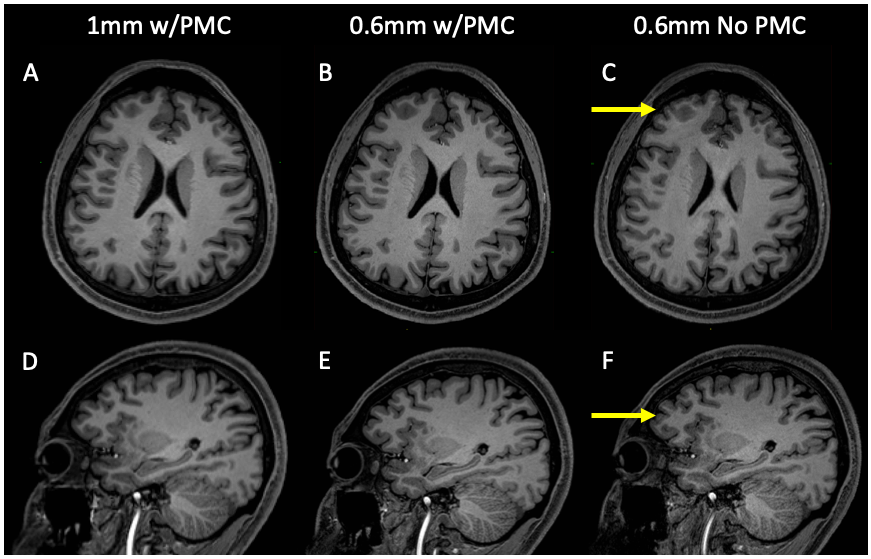
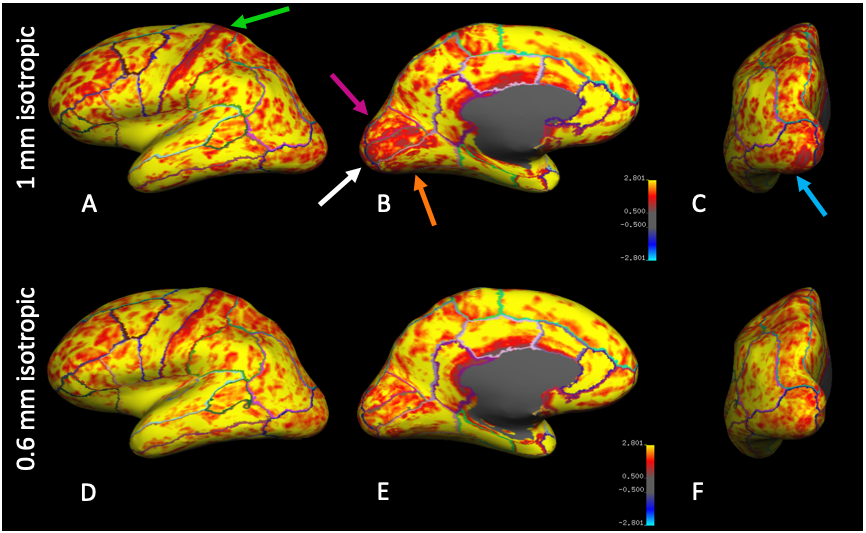
All subjects completed the scans without any discomfort due to the mouth guard and displayed minimal motion throughout the scans. The mean SNR was 9.2 and 9.7, CNR was 3.0 and 2.9 for the 1mm and 0.6mm data, respectively. Representative images of acquired at 1mm, 0.6mm, and 0.6mm without PMC are shown in Fig. 1. There is greater definition of the gray/white matter boundary and small structures in the 0.6mm data with PMC compared to other scans. Motion artifacts are present as ringing and blurring in the 0.6mm data without PMC, indicating the necessity of PMC for high resolution structural scans that require long scan times. Figure 2 shows magnified regions from the images shown in Fig. 1 to further illustrate the improved definition of small structures, like the gray matter of the striatum and white matter in the hippocampus for data acquired at 0.6mm using PMC. Figures 3 shows cortical thickness measures of the left hemisphere on an inflated surface, overlaid with boundaries of cortical parcellation. Five regions (cuneus, lateral-occipital, lingual, pericalcarine, and post-central) were found to show significantly different mean thickness between 0.6mm and 1mm data in both the left and right hemispheres. The cortical thickness measures for the left hemisphere of these 5 regions are shown in Fig. 4. The right hemisphere showed similar results. The cortex is thicker in 0.6mm than 1mm data in all significant regions. The The greatest mean difference is seen in the pericalcarine region with 24.4% and 26.3% for the left and right hemispheres, respectively.Discussion
This study shows the feasibility of acquiring high quality MPRAGE data at sub-millimeter resolution (0.6mm isotropic) at 3T. Because of the long scan times required, prospective motion correction is necessary to eliminate image blurring due to involuntary subject motion. Our results indicate that high resolution data at 0.6mm show significantly increased cortical thickness in regions that are typically among the thinnest11, similar to 7T results reported recently1. Increased cortical thickness is attributed to improved definition of gyral and sulcal surfaces exhibited in 0.6mm data. In this study, high resolution images did not reveal regions with reduced cortical thickness that reached the level of significance, although such areas have been identified at 7T1. This maybe due to reduced CNR in 3T high resolution images compared to 7T (2.9 vs 3.9) or differences in analysis methods.Acknowledgements
No acknowledgement found.References
1. Zaretskaya et. al., Advantages of cortical surface reconstruction using submillimeter 7T MEMPRAGE. NeuroImage 2018;165:11-26.
2. Reuter M, et. al., Head motion during MRI acquisition reduces gray matter volume and thickness estimates. NeuroImage 2015;107:107-115.
3. Maclaren J, et. al., Prospective motion correction in brain imaging: a review. Magn Reson Med 2013;69:621–636.
4. Brown TT, et al. Prospective motion correction of high-resolution magnetic resonance imaging data in children. Neuroimage. 2010;53:139-45.
5. Tisdall MD, et. al., Prospective motion correction with volumetric navigators (vNavs) reduces the bias and variance in brain morphometry induced by subject motion. Neuroimage. 2016;127:11-22.
6. Watanabe K, et. al,. Utility of real-time prospective motion correction (PROMO) on 3D T1-weighted imaging in automated brain structure measurements. Sci Rep. 2016;6:38366.
7. Sarlls JE, et. al., Effectiveness of navigator-based prospective motion correction in MPRAGE data acquired at 3T, PLoS One. 2018; 13(6):e0199372
8. Sarlls JE, et. al., Accuracy of morphometry measures from MPRAGE data with prospective motion correction based on an optical tracking system. Proc. Intl. Soc. Magn. Reson. Med. 2018; 3245
9. Maclaren et. al., (2012), Measurement and Correction of Microscopic Head Motion during Magnetic Resonace Imaging of the Brain, PLOS ONE Vol 7(11), e48088.
10. https://surfer.nmr.mgh.harvard.edu/fswiki/ SubmillimeterRecon
11. Fischl B and Dale A, Measuring the thickness of the human cerebral cortex from magnetic resounance images, PNAS. 2000;97(20:11050-11055.
Figures