1773
Imaging the Nigrosome 1 using Susceptibility Weighted Imaging and Quantitative Susceptibility Mapping: An Application to Parkinson’s Disease1Radiology, Ruijin Hospital, school of medicine, Shanghai Jiaotong University, Shanghai, China, 2neurology, Ruijin Hospital, school of medicine, Shanghai Jiaotong University, Shanghai, China, 3Magnetic Resonance Innovations, Inc, Bingham Farms, MI, United States, 4MR Medical Imaging Innovations India Pvt. Ltd, Telangana, India, 5Philips Healthcare, Shanghai, China, 6Radiology, Wayne State University, Detroit, MI, United States
Synopsis
Imaging the nigrosome 1 has been reported to be promising in the diagnosis of Parkinson’s disease (PD), however, there is no uniform imaging protocol. This study was designed to create a rapid imaging protocol with high image quality to consistently visualize and characterize the N1 and to evaluate the loss of N1 in the diagnosis of PD. We found that the N1 sign could be consistently visualized using true SWI (tSWI) with a resolution of at least 0.67 x 0.67 x 1.34 mm3 and could be seen in 95% of HCs, while only 21.1% in PD and atypical parkinsonian syndromes.
Introduction
Parkinson’s disease (PD) is a clinically heterogeneous chronic progressive neuro-degenerative disease with loss of dopaminergic neurons in the nigrosome 1 (N1) territory of the substantia nigra pars compacta (SNpc) (1-3). To date, there has been a major effort to identify changes in the N1 territory by monitoring increases of iron in the SNpc. However, there is no standard protocol being used to visualize or characterize the N1 territory. Therefore, the purpose of this study was to create a robust high quality, rapid imaging protocol, determine a slice by slice characterization of the appearance of N1 (the “N1 sign”) and evaluate the loss of the N1 sign in order to differentiate healthy controls (HCs) from patients with PD.Methods
Firstly, one group of 10 HCs were used to determine the choice of imaging parameters including the flip angle (FA, 6oand 9o) and the resolution (0.67 x 0.67 x 1.34mm3, 0.67 x 0.67 x 1mm3 and 0.67 x 0.67 x 0.67mm3) with two time echoes (11 ms and 20 ms). Secondly, another group of 80 HCs was used to characterize the appearance of the N1 sign and train the raters. In this step, the magnitude, susceptibility weighted images (SWI), quantitative susceptibility maps (QSM) and true SWI (tSWI) images were all reviewed using data from a 3D gradient recalled echo sequence. A resolution of 0.67 x 0.67 x 1.34 mm3 (Figure 1) was chosen based on the ability to cover all the basal ganglia, midbrain and dentate nucleus with good signal-to-noise with echo times of 11ms and 20ms. Thirdly, 80 Parkinsonism and related disorders patients [idiopathic Parkinson’s disease (IPD): 57; atypical parkinsonian syndromes (APs): 14; essential tremor (ET): 9] and one additional group of 80 age-matched HCs were blindly analyzed for the presence or absence of the N1 sign for a differential diagnosis.Results
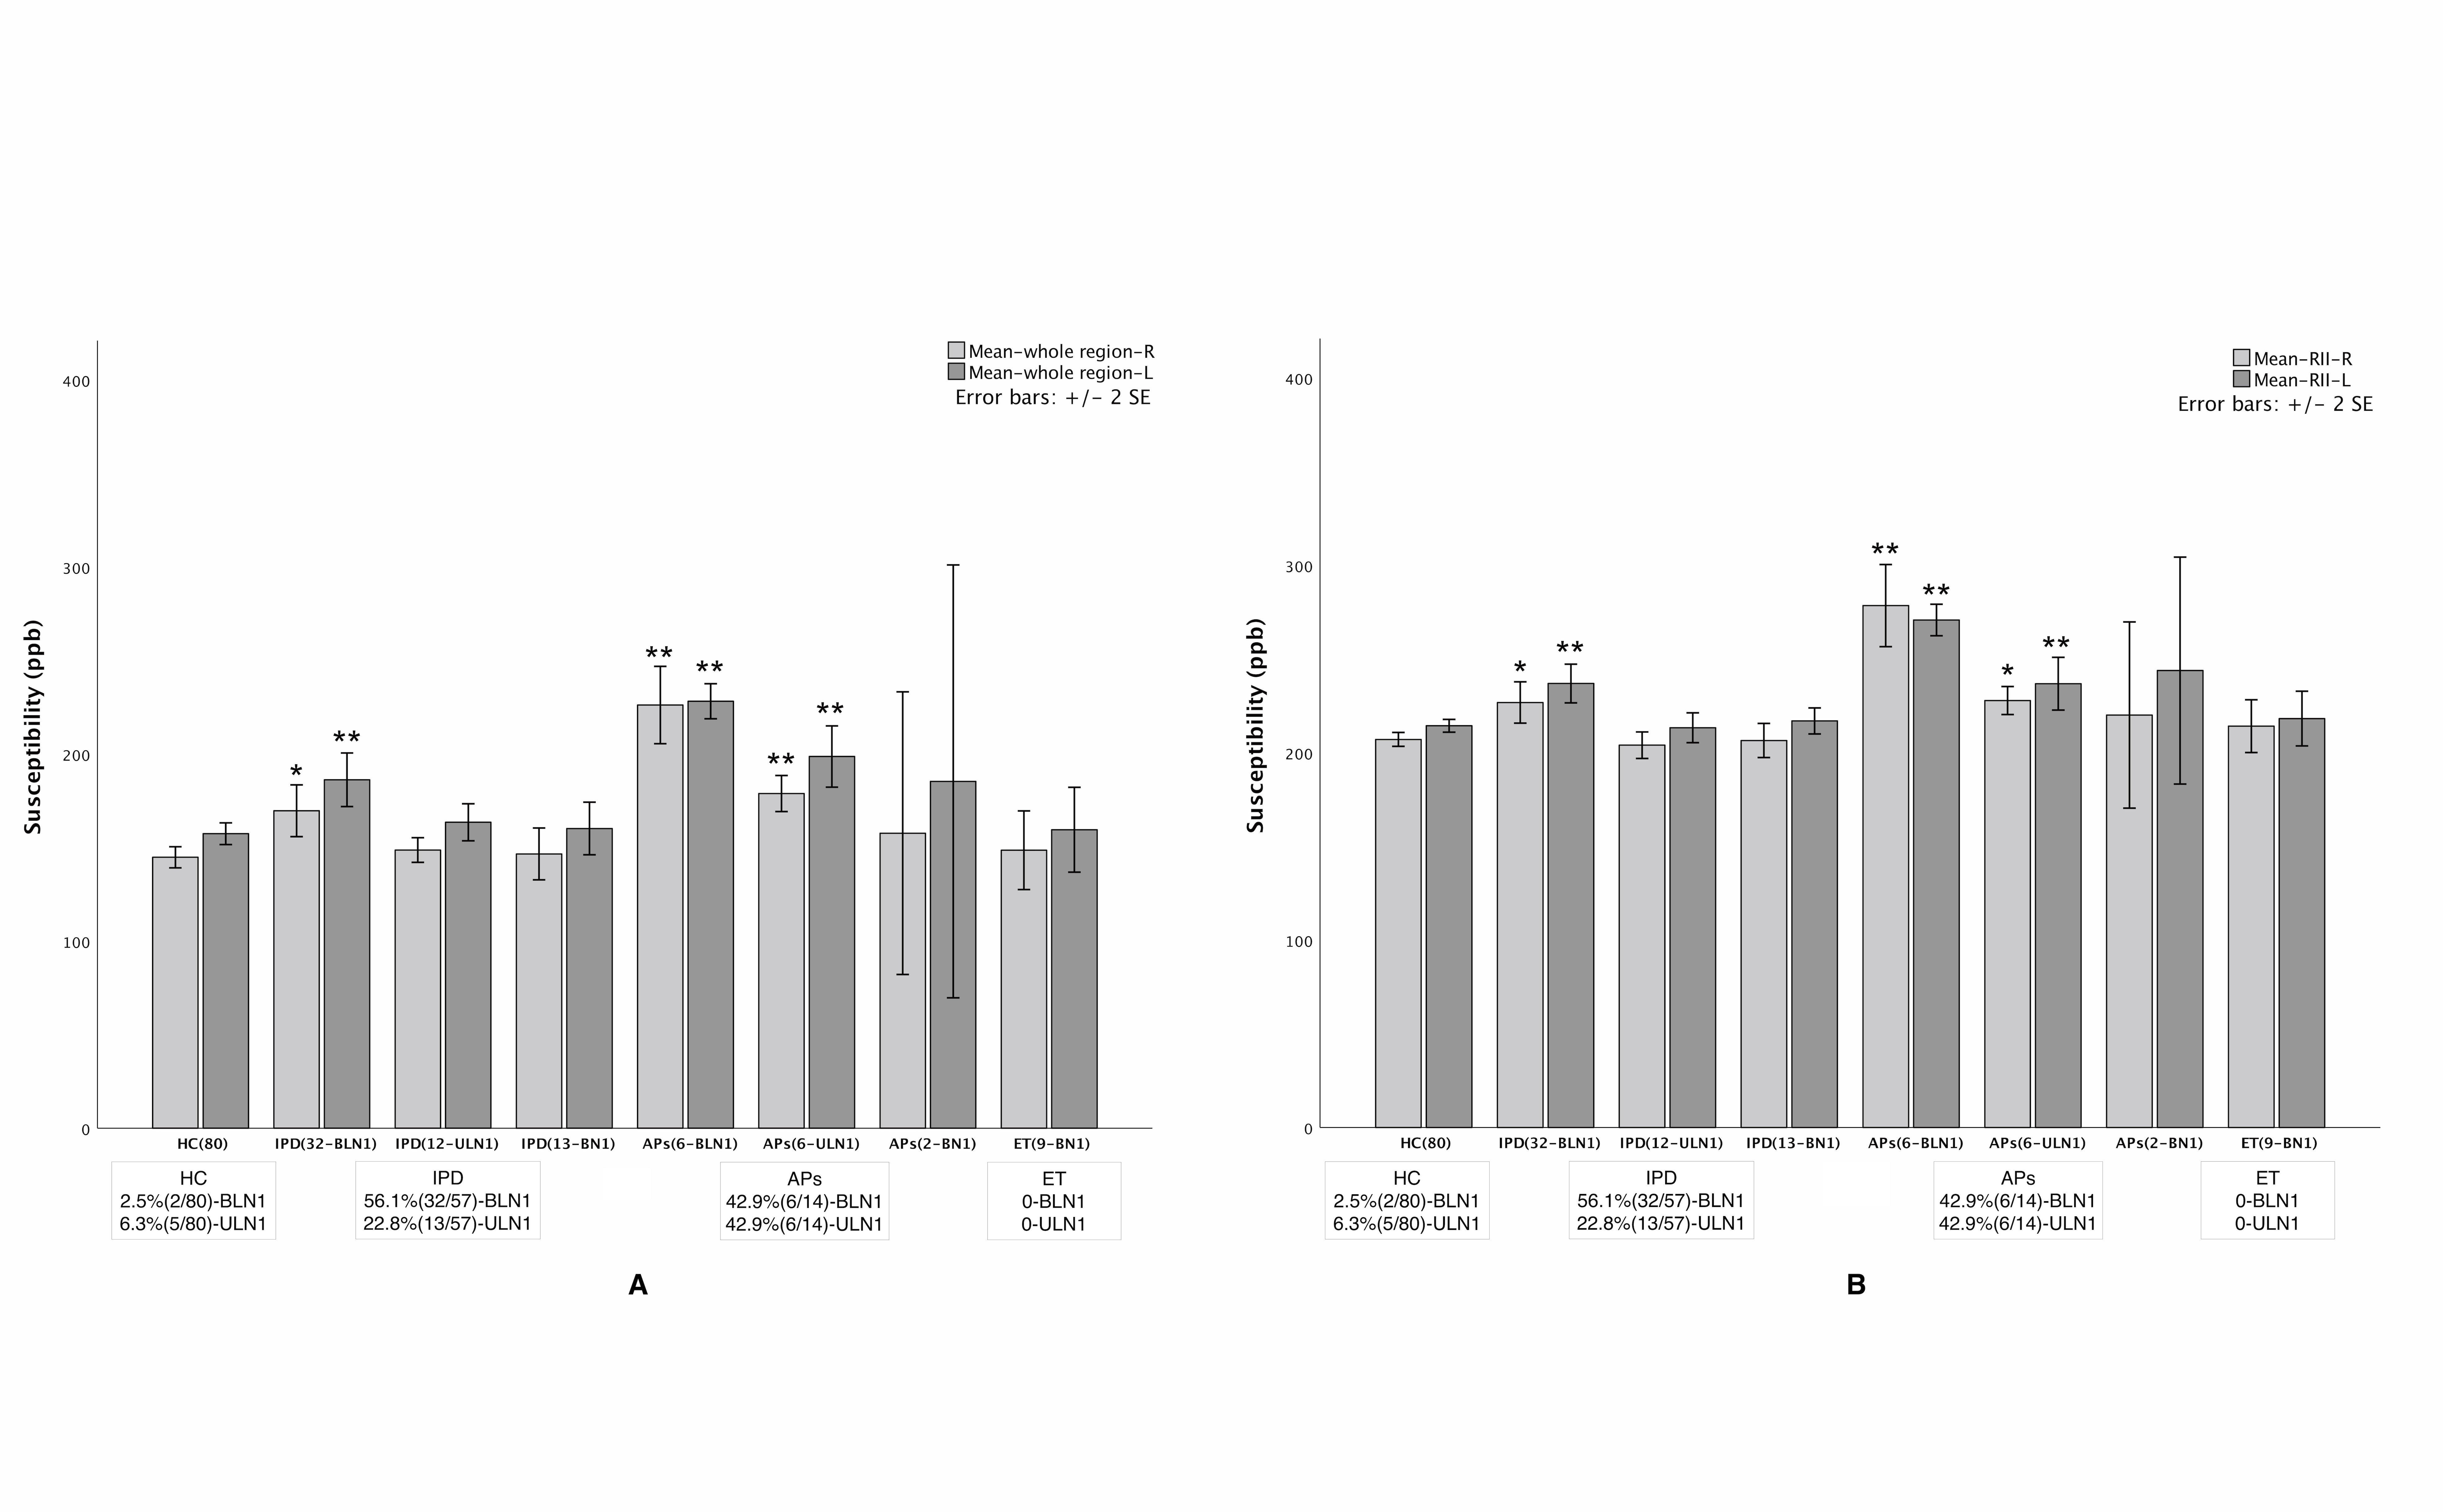
The measured signal to noise ratio (SNR, mean ± standard deviation) was 26.5:1 ± 6.5 for 6o and 48.0 ± 12.6 for 9o. The SNR for the slice thickness of 1.34mm, 1mm and 0.67mm was 46.5 ± 3.0:1, 29.7 ± 2.4:1 and 21.7 ± 3.4:1, respectively. The N1 sign had many variants (Figure 2) and all these were potentially representative of a normal N1 sign. From the first group of 80 HCs, all of the 76 (100%) cases (4 were excluded due to motion artifacts) showed the N1 sign. For the second group of 80 HCs, 78 (97.5%) showed the N1 sign in at least 2 slices. Of the 80 Parkinsonism and related disorders patients, 56.1% (32/57) IPD and 42.9% (6/14) APs showed a bilateral loss of the N1 sign, 21.1% (12/57) IPD and 42.9% , (6/14) APs showed the N1 sign unilaterally and 22.8% (13/57) IPD and 14.2%(2/14) APs showed the N1 sign bilaterally. Also, all 100% (9/9) ET patients showed the N1 sign bilaterally (Figure 2). The mean total structure and mean high susceptibility region for the SN for both IPD and APs patients with bilateral loss of N1 were higher than those of the HCs (p < 0.002) (Figure 3).Discussion and Conclusion
The key findings in this paper relate to creating a robust high quality, rapid imaging protocol for clinical use in detecting the loss of the N1 sign in PD patients, characterizing the shape of the N1 in the SN, and comparing iron content with the presence or absence of the N1 sign as a biomarker to distinguish PD from HC. Specifically, sufficient in-plane resolution, slice thickness and SNR are required to create an image of the SN with sufficient SNR and resolution. In this work, we found that a resolution of 0.67mm x 0.67mm x 1.34mm met these criteria. The choice of 9o for the flip angle kept the signal high and at the same time minimized ghosting artifacts from pulsatile flow from the arteries. The advantage of tSWI in assessing N1 is that it marries both the magnitude and QSM data so that even if the N1 sign is not visible in the magnitude image it will be visible in the tSWI data thanks to the contrast in the QSM data. Those IPD/APs patients with bilateral loss of the N1 sign showed the highest iron content in the SN relative to all other groups, which was significantly higher than that in HCs (4). In conclusion, the N1 sign can be consistently visualized using tSWI with a resolution of at least 0.67 x 0.67 x 1.34 mm3.Acknowledgements
We sincerely acknowledge Cheng Ren (M.A., Hangzhou Yasheng Brand Design Co., Ltd.) for her assistance in drawing the cartoon illustration of the nigrosome 1 variants. We also thank all the participants in this study.
References
1. Thenganatt MA, Jankovic J. Parkinson disease subtypes. JAMA Neurol. 2014;71(4):499-504.
2. Lehericy S, Bardinet E, Poupon C, Vidailhet M, Francois C. 7 Tesla magnetic resonance imaging: a closer look at substantia nigra anatomy in Parkinson's disease. Mov Disord. 2014;29(13):1574-81.
3.Schwarz ST, Mougin O, Xing Y, Blazejewska A, Bajaj N, Auer DP, et al. Parkinson's disease related signal change in the nigrosomes 1-5 and the substantia nigra using T2* weighted 7T MRI. Neuroimage Clin. 2018;19:683-9.
4. Kim EY, Sung YH, Shin HG, Noh Y, Nam Y, Lee J. Diagnosis of Early-Stage Idiopathic Parkinson's Disease Using High-Resolution Quantitative Susceptibility Mapping Combined with Histogram Analysis in the Substantia Nigra at 3 T. J Clin Neurol. 2018;14(1):90-7.
Figures