1770
Can 7T MPRAGE match MP2RAGE for gray-white matter contrast?1Spinoza Centre for Neuroimaging, Amsterdam, Netherlands, 2Experimental and Applied Psychology, VU University, Amsterdam, Netherlands, 3Experimental Psychology, Helmholtz Institute, Utrecht University, Utrecht, Netherlands
Synopsis
We compared MPRAGE and MP2RAGE at Ultra-High Field (UHF) in terms of signal separability in gray and white matter. Using a k-space shutter, kt-point universal pulses for signal excitation, and an efficient TR-FOCI for signal inversion, we obtained very good signal contrast throughout the brain, including the cerebellum, for the MPRAGE. Nevertheless, gray-white matter contrast was larger in the MP2RAGE data, leading to better segmentation results, especially in areas affected by low B1+. Hence, MP2RAGE appears more suitable for 7T T1-weighted anatomical data, despite the longer acquisition times.
Introduction
High quality anatomical T1-weighted images are important for several MRI applications, for example, volumetric studies, gray-matter segmentation, and anatomical reference in fMRI[1]. The MPRAGE family (MPRAGE and MP2RAGE) [2,3] are the most commonly used sequences at 7T. Both MPRAGE and MP2RAGE sequences rely on a uniform RF transmit field (B1+ ) during the magnetization preparation, and nearly always use an adiabatic inversion pulse. One of the ultra-high field (UHF) challenges is that the field uniformity is often compromised, to the extent that the inversion efficiency of an adiabatic pulse may also be affected, especially in the cerebellum and temporal lobes [4]. To achieve more homogeneous contrast, it is important to ensure an effective inversion independent of B1+ inhomogeneities. This can be achieved using either better adiabatic pulses like the TR-FOCI pulse [5] or special pulse design for both the inversion and excitation pulses on parallel transmission (Multix) systems. The required prescans can be avoided by using Universal Pulses (Ups) [6]. To acquire the best possible MPRAGE on our 7T, we acquired T1-weighted images with (1) a k-space shutter to reduce scantime, (2) Universal kt-point pulses to homogenize signal excitation and (3) a TR-FOCI to uniformly invert the signal. These data were compared to MP2RAGE data acquired with a standard HS8 inversion pulse or a TR-FOCI.Methods
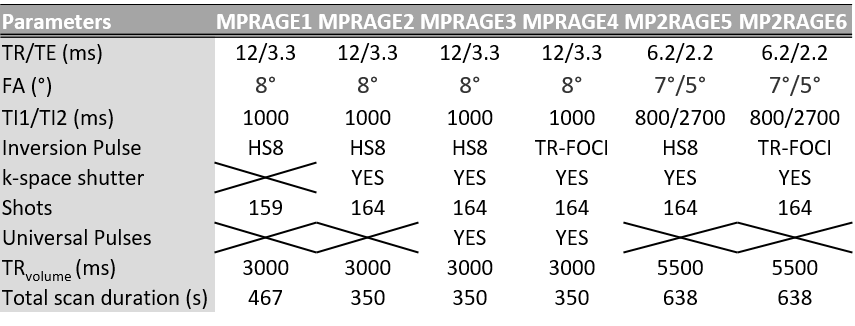
Three healthy volunteers (age 23-40 years, 2 females) participated in the study. Imaging was performed on a 7T scanner Philips System using a 32-channel head coil for reception (Nova Medical) and 8-channel for transmission (32Rx8Tx). MPRAGEs and MP2RAGEs were acquired in the same session. The common parameters for both techniques are; FOV = 230×230×186mm3, 0.8 mm isotropic voxels, 2D SENSE= 1.8×1.8, and slice oversampling of 20%. For MP2RAGE, Bloch simulations were used to optimize the inversion time, TRvolume and flip angles [3]. Specific parameters are given in Table 1. For MPRAGE1, was the ‘standard’ MPRAGE, with an HS8 inversion, normal excitation, and a fully sampled matrix. For MPRAGE2 we added a vendor-supplied k-space shutter, reducing scantime. A similar number of lines per GRE readout block was used (164) as for the MPRAGE (159), ensuring similar T1-relaxation during the readouts. For MPRAGE3, we additionally replaced the standard excitation pulses with UPs, and finally for MPRAGE4 we added the TR-FOCI pulse. For the MP2RAGEs we changed only the inversion pulse from HS8 to TR-FOCI. All data were segmented using SPM12.Results
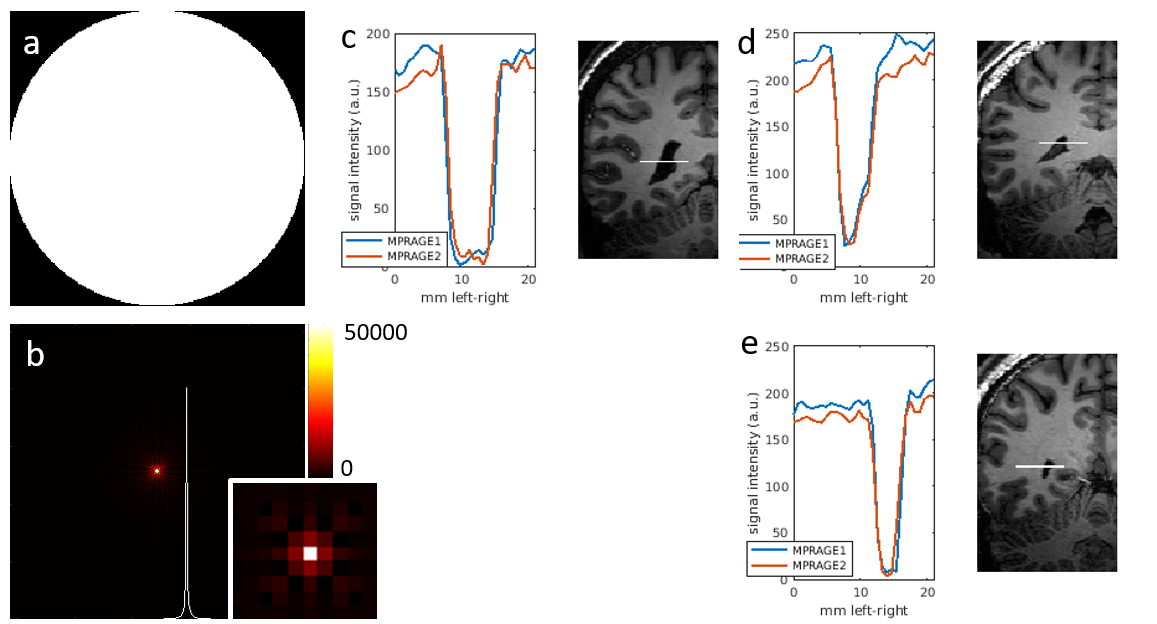
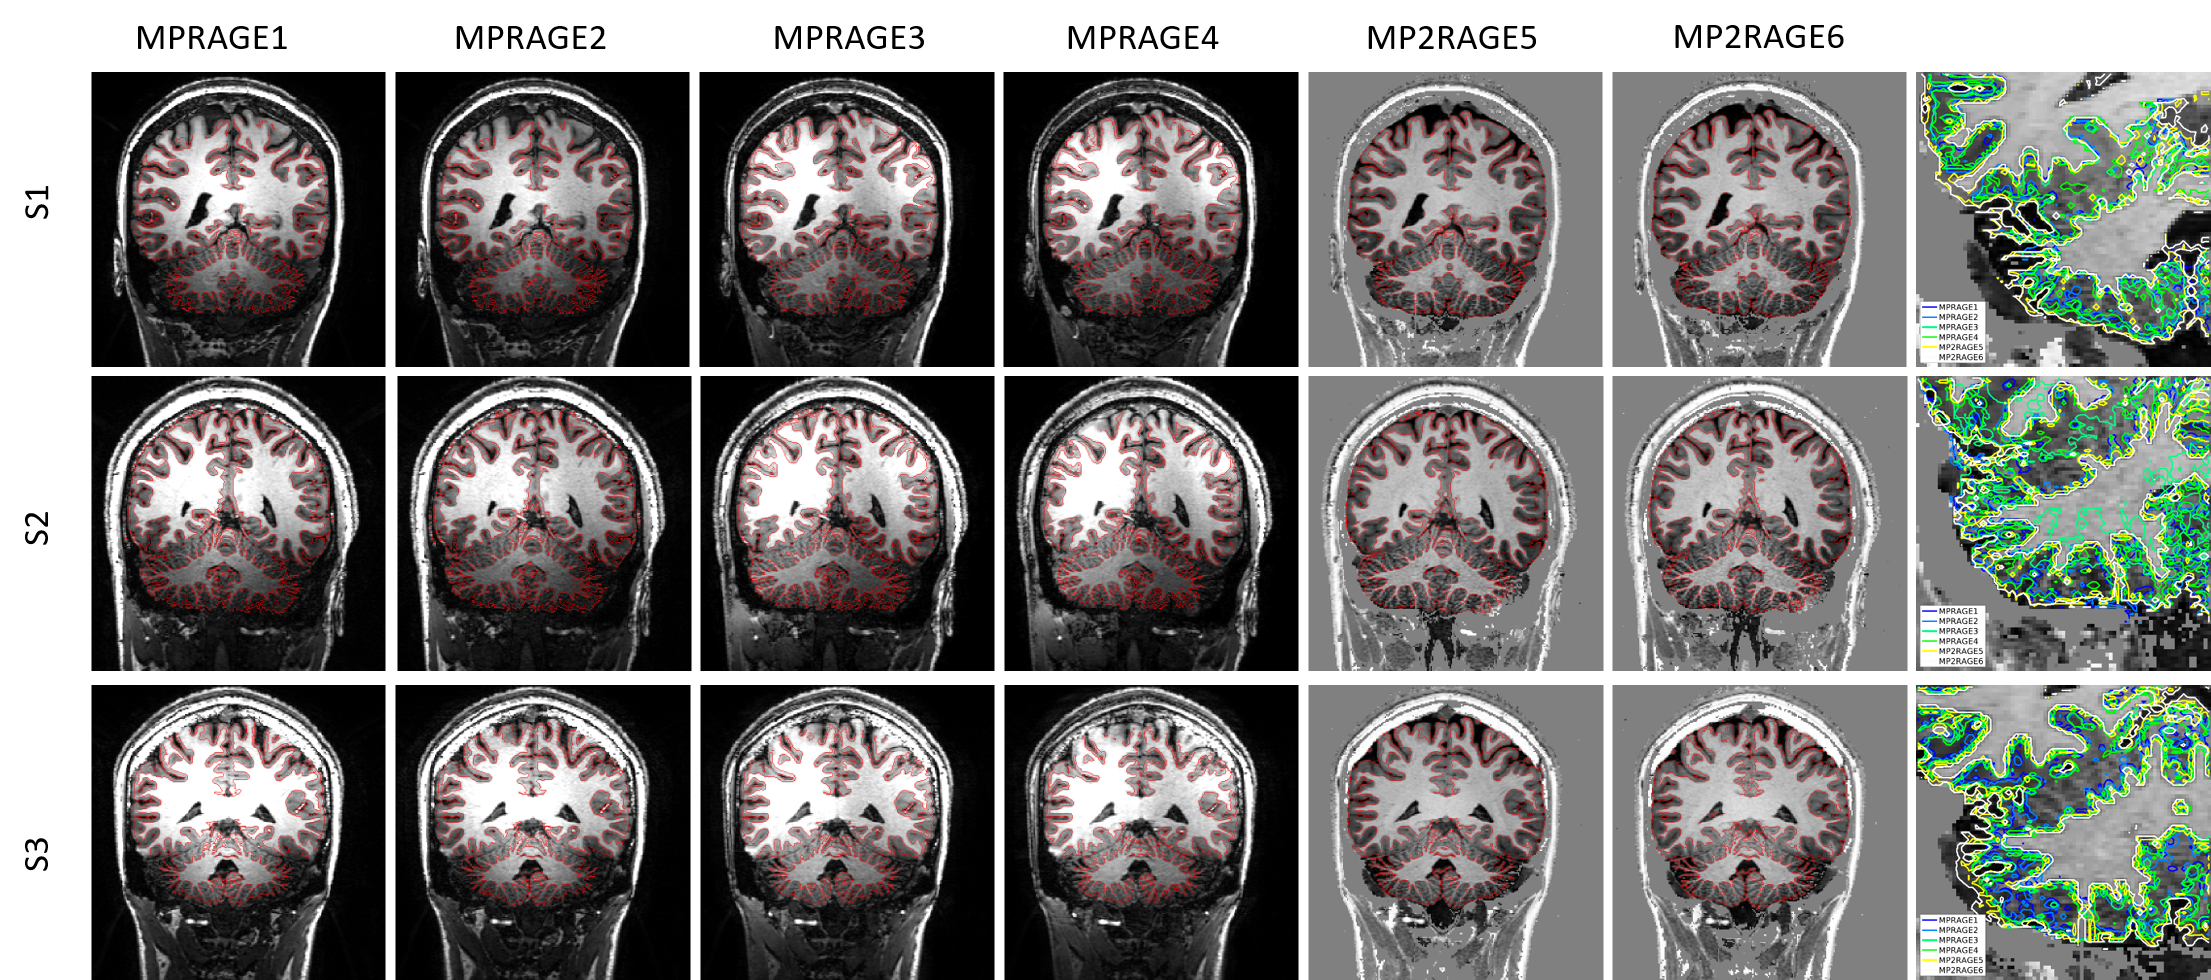
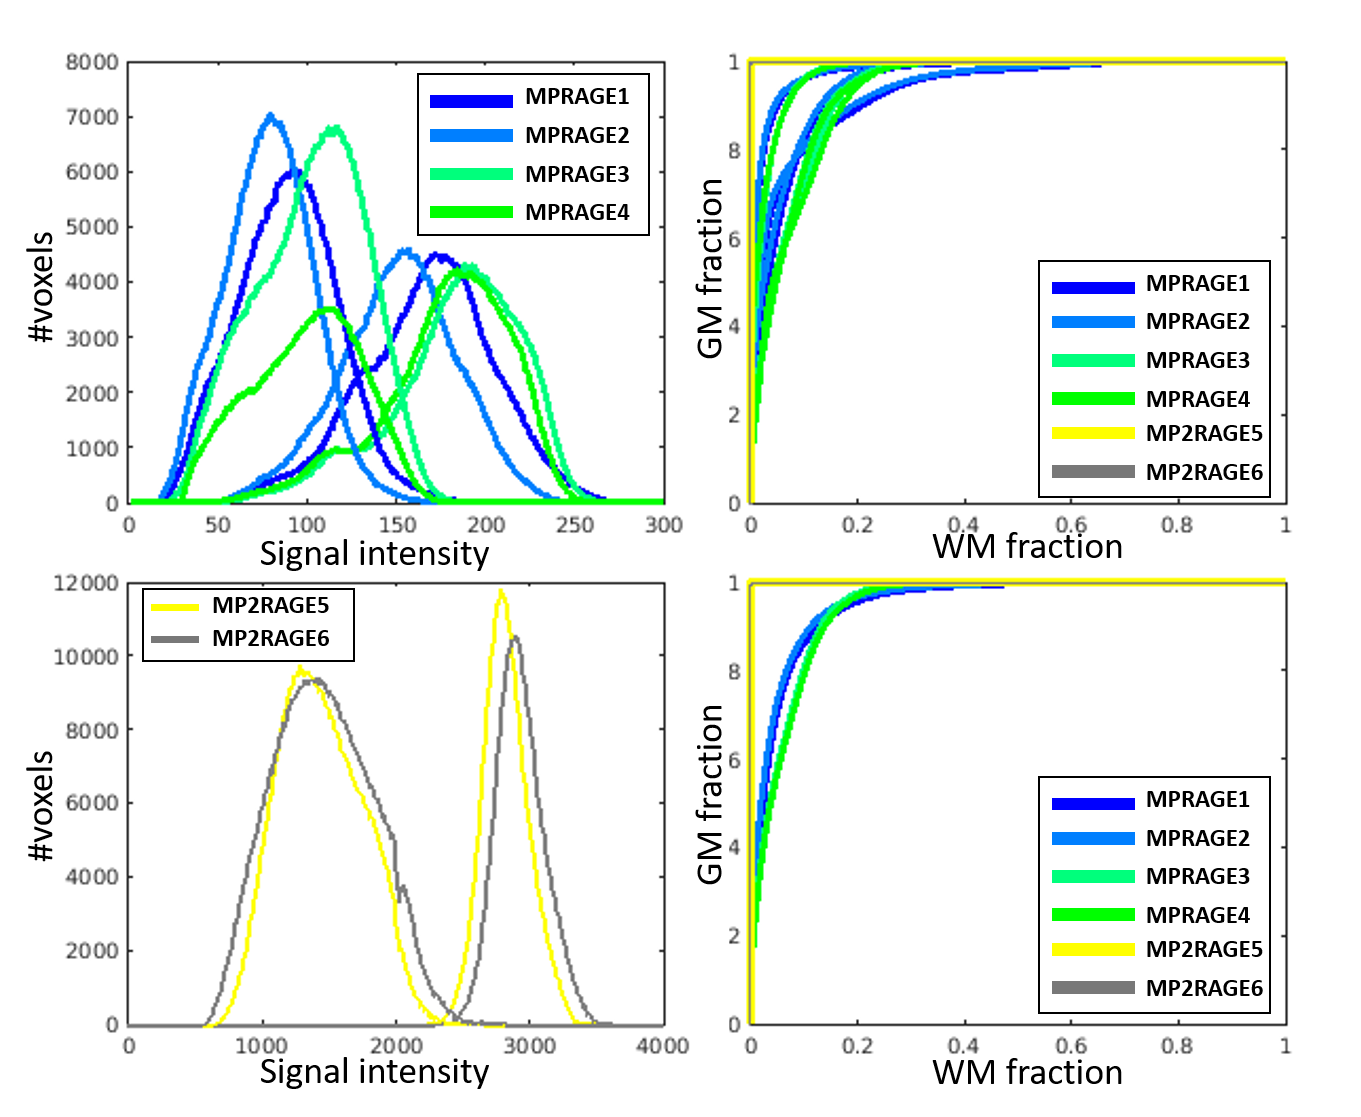
Figure 2a and b show the sampling pattern in k-space of the k-space shutter and the resulting point spread function (PSF). PSF changes are seen on the cardinal axes. To observe the effect in the images acquired with k-space shutter, a line on the LR axis through the ventricles was plotted for both MPRAGE1 and MPRAGE2. The observed profiles (Fig 2c-e) show minimal changes, the most noticeable is the signal intensity reduction related to the reduced scantime. Figure 3 shows an example slice from all sequences, for all subjects. The contrast in the MPRAGE3 and MPRAGE4 improved substantially in the low-B1 region in the cerebellum. The red contours in Figure 4 indicates the gray matter boundaries of the segmentation. For MPRAGE1 and MPRAGE2 the segmentation fails in some regions and is generally more correct for MP2RAGE than for MPRAGE data. The rightmost column shows a zoomed-in area in the cerebellum with all gray matter boundary segmentations overlaid.Figure 5 shows the signal distributions in MPRAGE and MP2RAGE acquisitions for both gray (~100 and ~1300) and white (~200 and ~3000) matter. Better separability of the gray matter and white matter is confirmed by an ROC curve analysis (panel c and d).
Discussion & Conclusion
In this comparison, the MP2RAGE acquisitions were matched to the MPRAGE in terms of resolution, FOV, and lines of k-space points per readout block and, hence, also for the number of readouts/inversion pulses. Consequently, the total acquisition time differed significantly as the MP2RAGE has to accommodate an extra readout within the TRMP(2)RAGE. The use of a k-space shutter to reduce scantime did not significantly affect the MPRAGE, no difference in blurring at the high contrast edge of the ventricles was found for MPRAGE1 and MPRAGE2. The addition of universal kt-points pulses and a TR-FOCI inversion increased SNR and contrast in the region of the cerebellum, particularly affected by low B1+. Nevertheless, the whole-brain signal intensity distributions of gray and white matter did not become better separable (Figure 5). Therefore, we conclude that, at 7T, the image quality of an MP2RAGE is higher than in a comparable MPRAGE, even if the latter has state-of-the-art excitation and inversion pulses to combat signal inhomogeneity. Use of the MP2RAGE merits the investment in additional scantime.Acknowledgements
No acknowledgement found.References
[1] Marques and D. G. Norris, How to choose the right MR sequence for your research question at 7 T and above? Neuroimage, 2018 vol. 168.
[2] Mugler and Brookeman, Three-dimensional magnetization-prepared rapid gradient-echo imaging (3D MP RAGE). Magn Reson Med. 1990 15(1):152-7.
[3] Marques et al., MP2RAGE, a self bias-field corrected sequence for improved segmentation and T1-mapping at high field. Neuroimage 2010 49(2):1271-81.
[4] O’Brien et al., Robust T1-weighted Structural Brain Imaging and Morphometry at 7T using MP2RAGE. Plos One 2014 9(6): e99676
[5] Hurley et al., Tailored RF pulse for magnetization inversion at ultrahigh field. Magn Reson Med. 2010 63(1):51-8.
[6] Gras et al., Universal pulses: A new concept for calibration-free parallel transmission. Magn Reson Med. 2017 77(2):635-643
Figures