1762
Vascular space occupancy asymmetric spin echo (VASO-ASE) for regional cerebral oxygen extraction fraction mapping1Department of Radiology, Vanderbilt University Medical Center, Nashville, TN, United States, 2Department of Neurology, Vanderbilt University Medical Center, Nashville, TN, United States, 3Department of Psychiatry, Vanderbilt University Medical Center, Nashville, TN, United States
Synopsis
The asymmetric spin echo technique (ASE) can be used to collect maps of R2’ and calculate cerebral oxygen extraction fraction (OEF). However, these models require extravascular signal only, which is often not fully achieved in standard ASE approaches. Here, a vascular-space-occupancy (VASO) prepulse is used to null intravascular signal in a novel VASO-ASE method, and repeatability measurements of parenchymal versus extravascular R2’ are presented. VASO-ASE was found to provide physiological OEF (34.1±5.3%) and higher reproducibility in controls compared to standard ASE.
Introduction
Cerebral oxygen extraction fraction (OEF) describes the ratio of oxygen consumed to oxygen delivered, and is a biomarker of cerebral metabolic dysfunction related to infarct risk in patients with multiple cerebrovascular diseases(1-3). OEF has historically been measured with 15-O PET, however this method is not available outside of specialized facilities.Quantitative R2' maps obtained from asymmetric spin echo (ASE) sequences(4-6) can also be converted to OEF and venous cerebral blood volume (vCBV) using a model of extravascular static signal dephasing from magnetically inhomogeneous tissues(7). Importantly, this approach assumes that diffusion from large vessels is negligible on the order of typical echo times (TE) of 20-80 ms, and also that intravascular signal has been sufficiently suppressed. When these criteria are not met however, vCBV can be overestimated and OEF underestimated. Inaccuracy varies with voxel composition, which has limited ASE generalizability.
At 3T and intermediate TE, it is well-known that signal is only approximately 70% extravascular(8, 9). A common approach to suppress intravascular signal is to apply bipolar gradients to dephase flowing blood-water(10). However this method increases TE, is incompletely effective depending on b-value choice, and also can be dependent on vessel orientation and gradient scheme.
A logical improvement is to exploit differences between 3T T1 of blood (~1.65s) and tissue (~0.8-1.2s) water in an inversion recovery sequence to null the longitudinal component of blood magnetization using a vascular-space-occupancy (VASO) pre-pulse(11). Additionally, since the VASO pre-pulse is played before excitation, this allows for shorter TE in this so-called VASO-ASE acquisition compared to the gradient suppressed method. However, it remains unclear whether signal-to-noise ratio (SNR) reduction in such a sequence may confound the ability to obtain reproducible and physiological measures, and also how intravascular vs. extravascular diffusion effects at short and long echo shifting times influence quantitative accuracy. Here, we evaluate a novel VASO-ASE protocol for regional OEF and vCBV determination, and quantify R2’ separately in brain parenchyma and extravascular tissue for different echo shifting protocols.
Methods
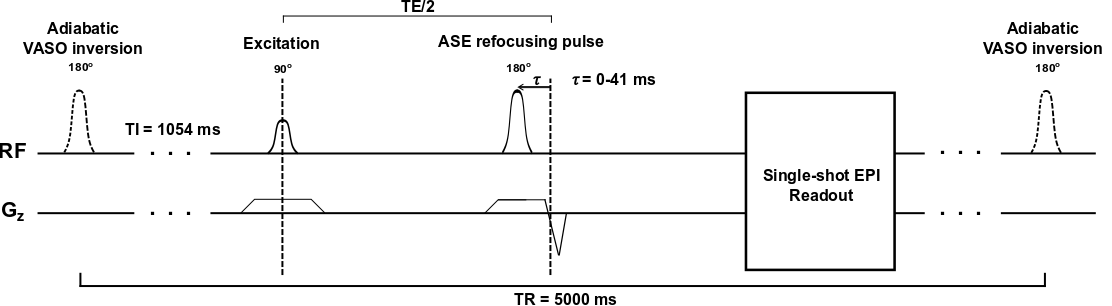
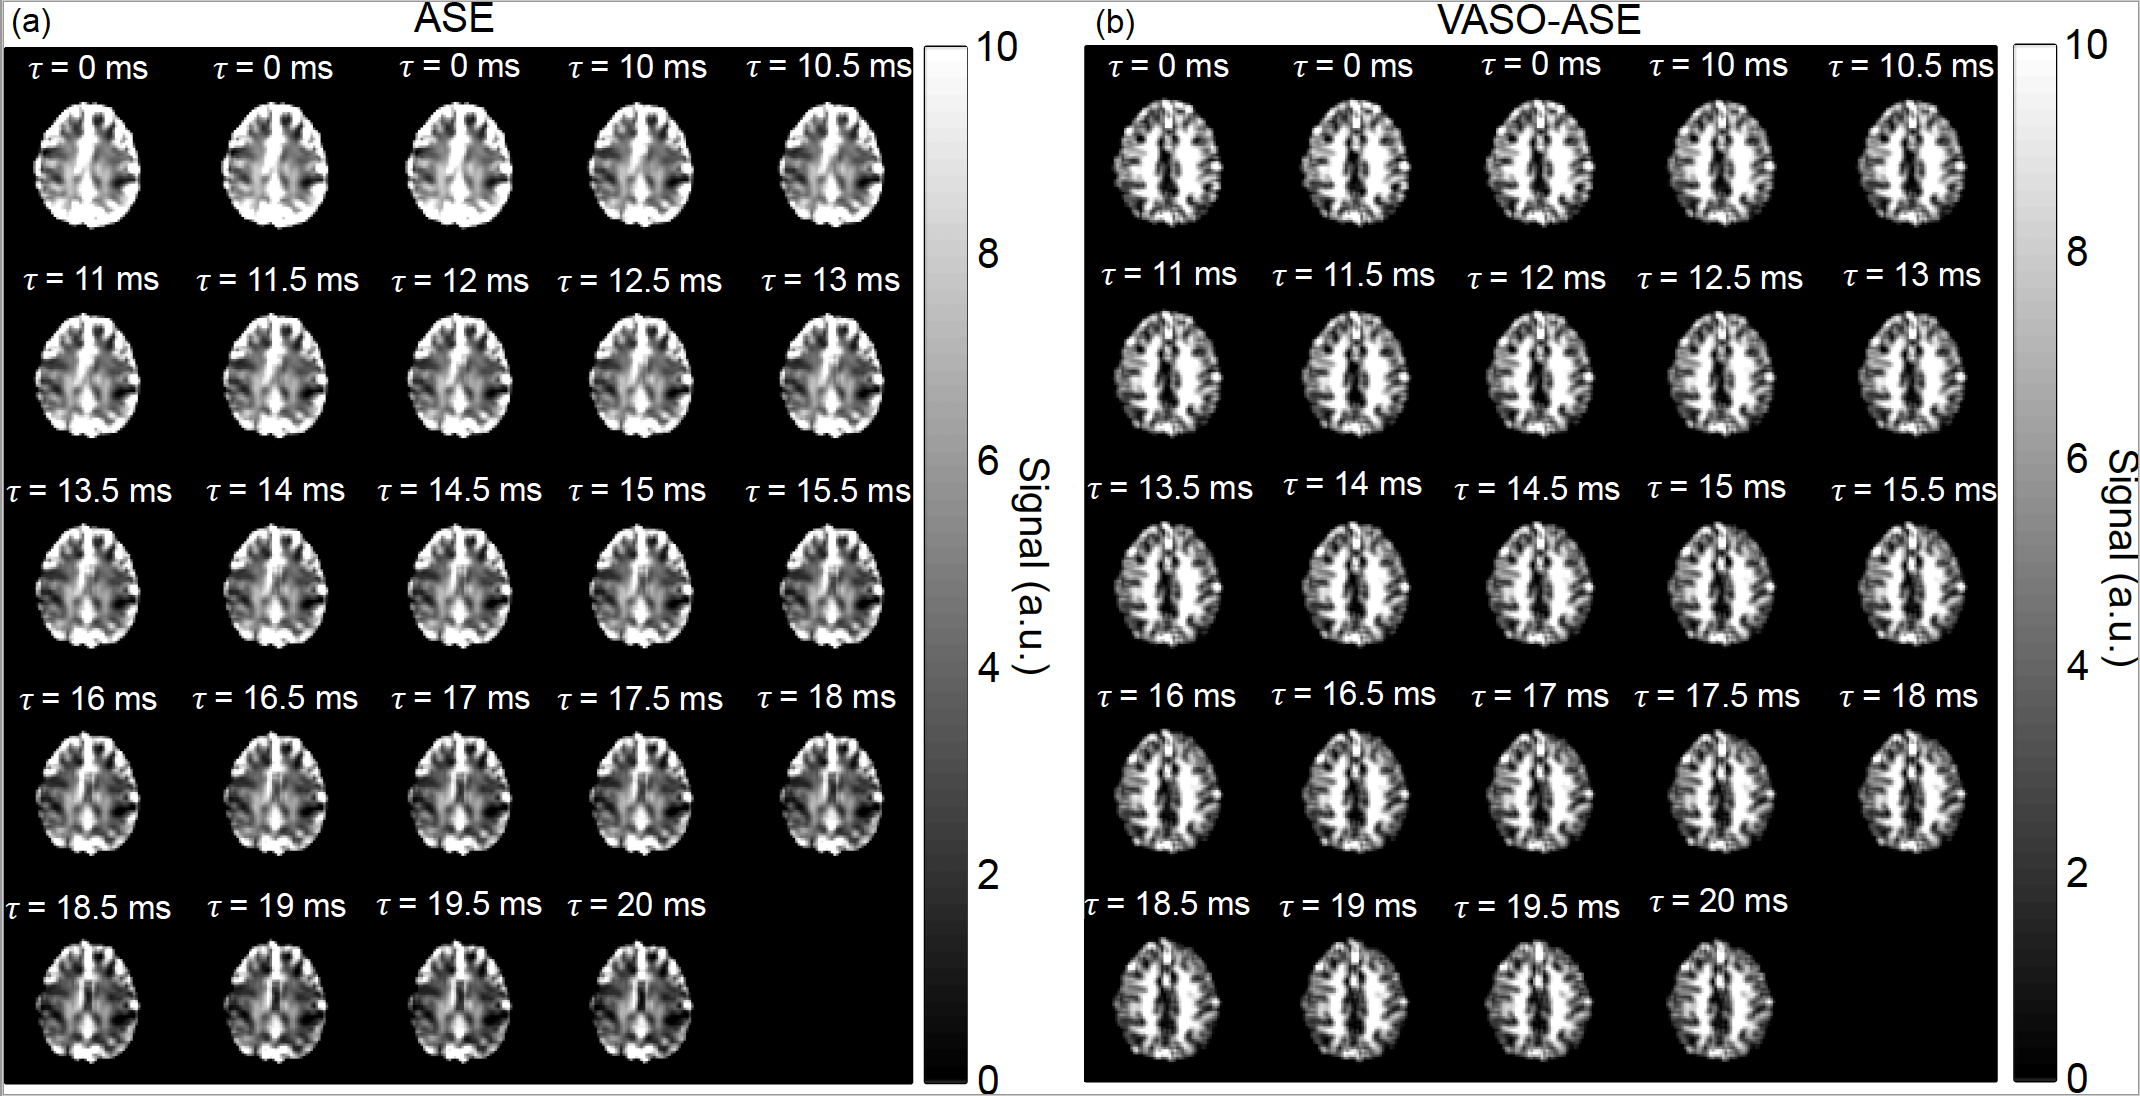
Participants. All participants provided informed, written consent, and were scanned at 3.0T (Philips Healthcare, Best, The Netherlands).Sequence. A single-shot echo planar imaging (EPI) spin echo sequence was modified for (i) an adiabatic pre-pulse to be applied and (ii) the spin echo to increment for ASE contrast. To reduce inflow effects, a long TR=5000 ms and blood water nulling time of 1.054s was used, corresponding to a blood water T1 of 1.65s. This allows approximately 20-30% of equilibrium longitudinal tissue magnetization to remain at the blood water nulling time. Data were collected with (VASO-ASE) and without (ASE) the intravascular suppression pre-pulse at spatial resolution=3x3x3mm and TE=100ms; each scan was repeated once for reproducibility. The readouts investigated included three τ=0 ms images, and 21 images sampled for τ=10-20 ms with a 0.5ms step. In some cases, ASE was also sampled from τ=10-41 ms in 1 ms increments (Figure 1).
Analysis. OEF was calculated using a fitting procedure outlined in An, Lin 2003(10). Large vessel hematocrit (Hct) was assumed to be 42%, and small vessel hematocrit incorporated here was 0.85·Hct=0.357. The susceptibility difference between fully oxygenated and fully deoxygenated blood was 0.18 ppm per unit hematocrit(12). OEF and vCBV were calculated in bi-frontal and bi-parietal regions. Signal-to-noise ratio (SNR), intraclass correlation coefficient (ICC), and OEF and vCBV values (mean±standard deviation) were recorded.
Results
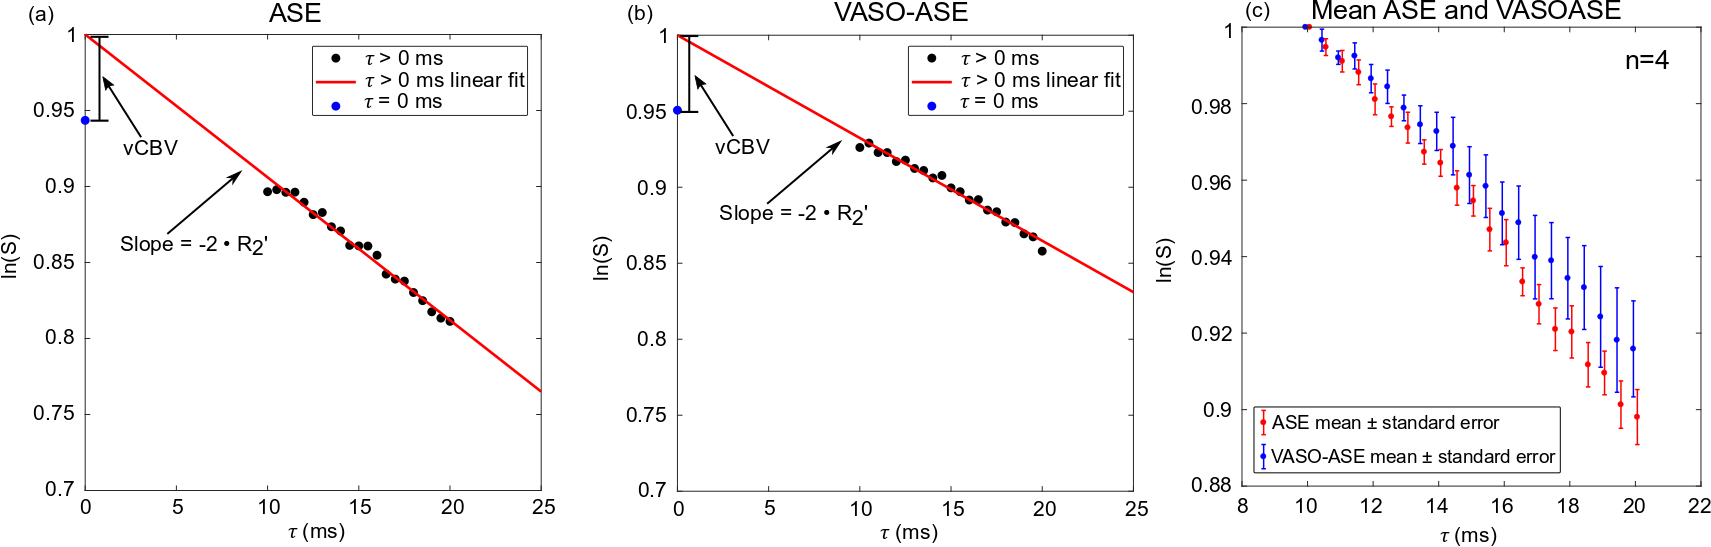
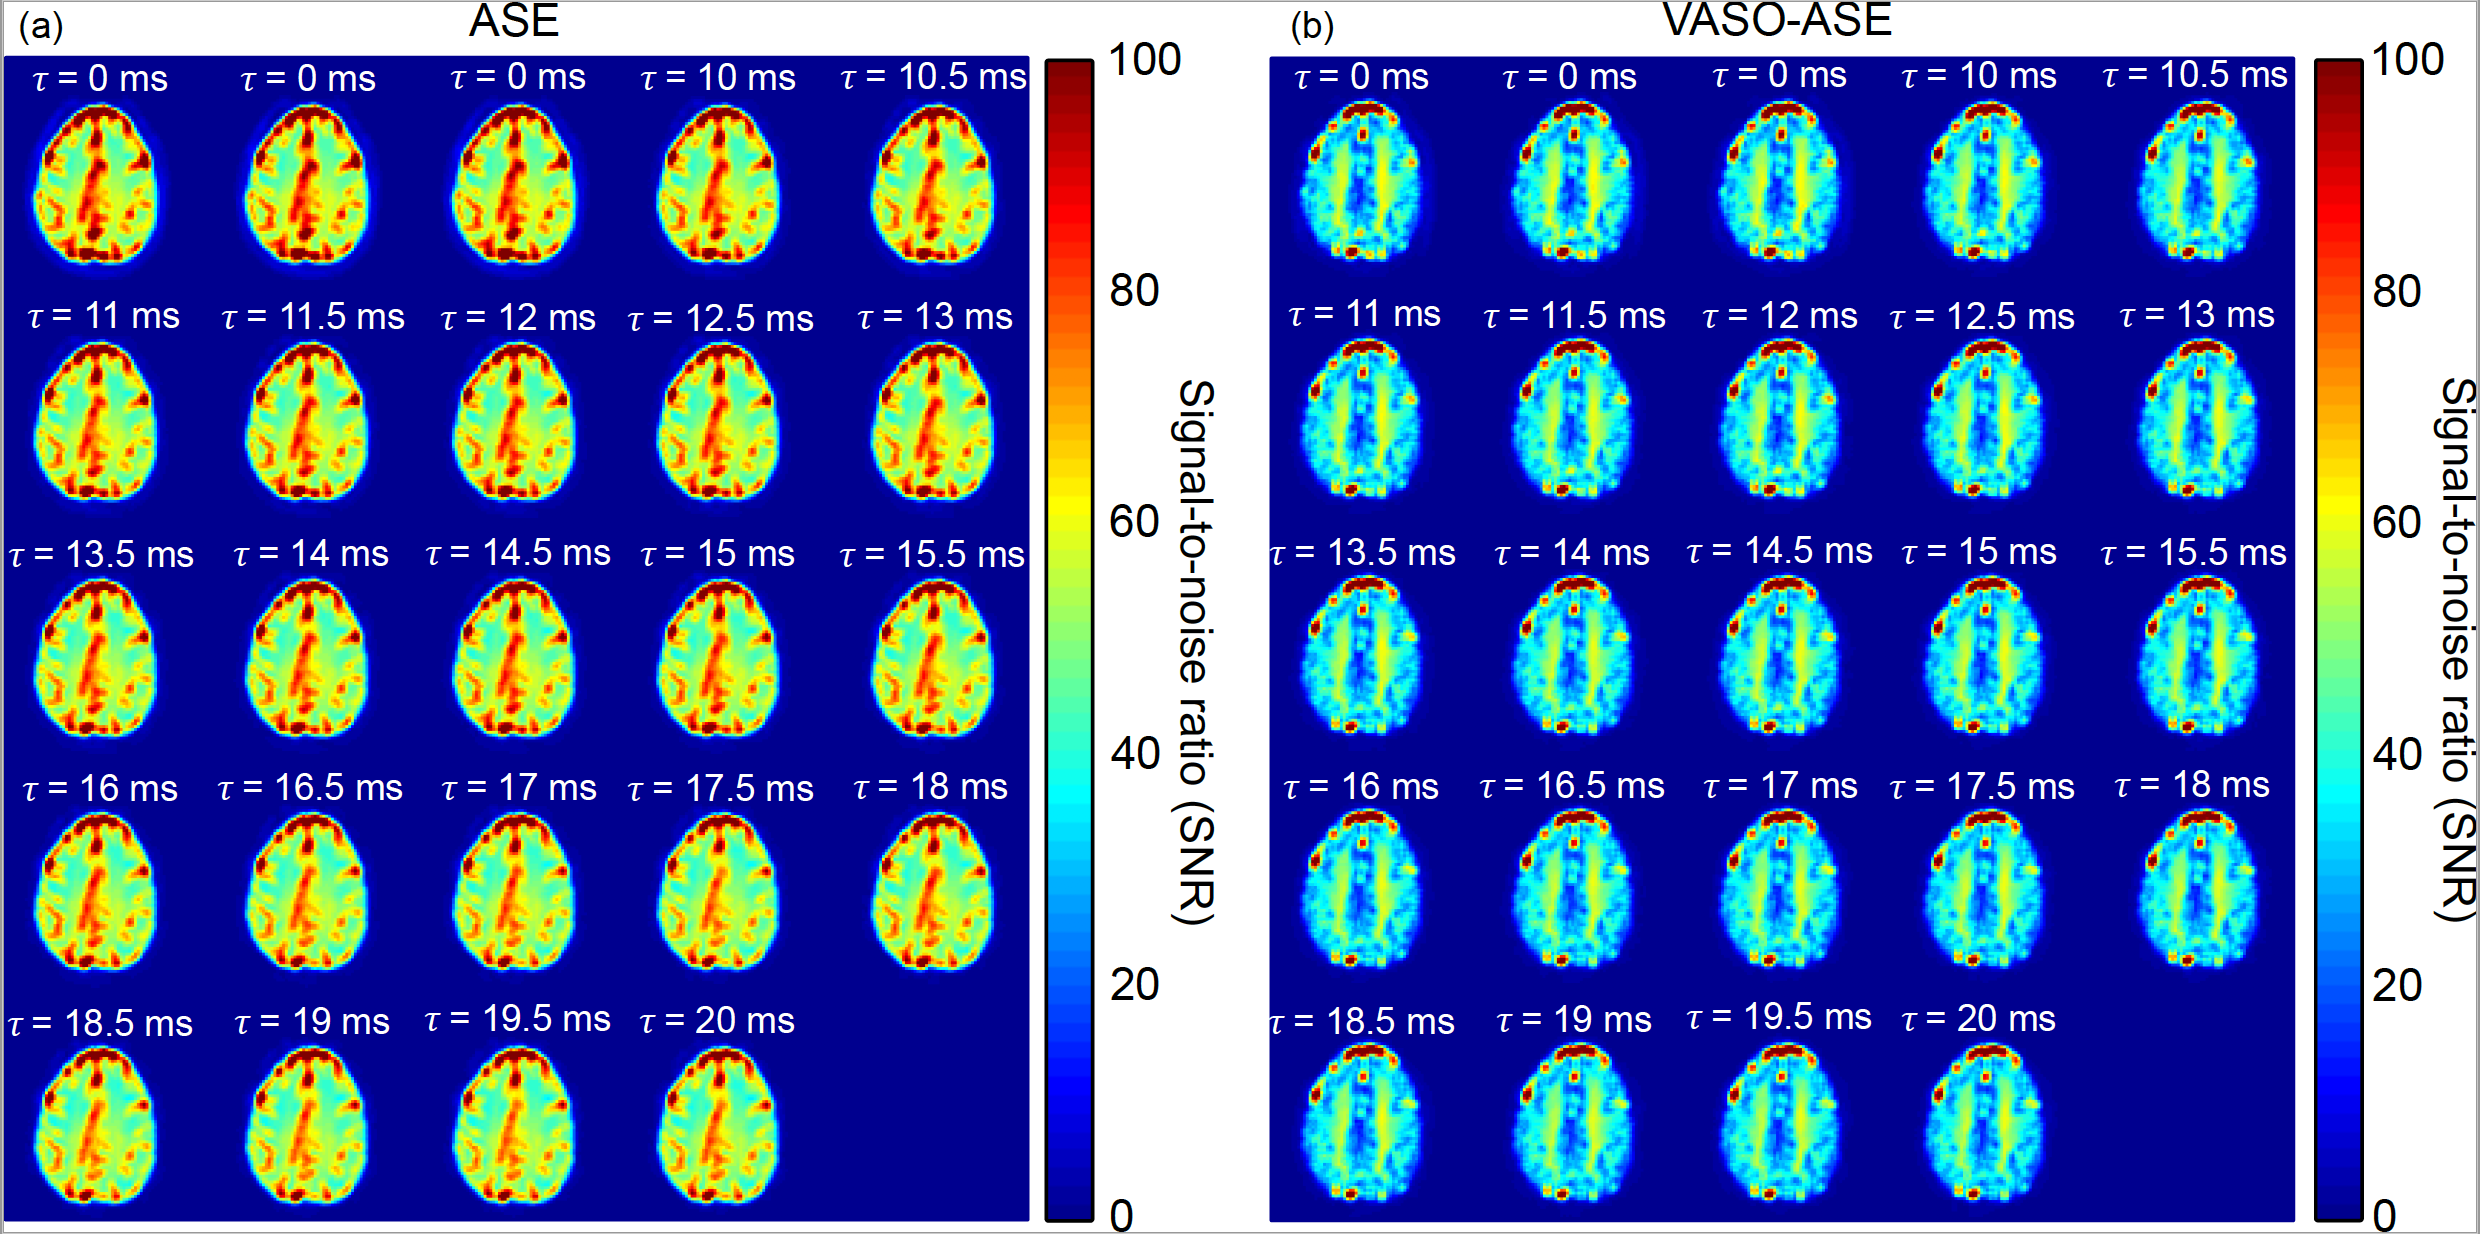
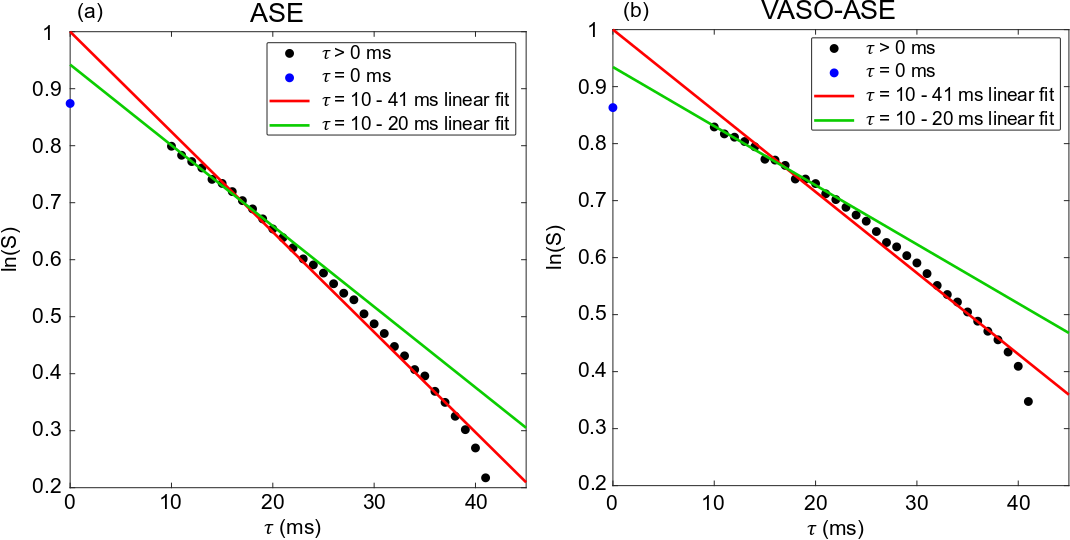
Representative images and decay curves for both sequences are shown in Figures 2 and 3, respectively. Across multiple healthy subjects, ASE provided OEF=38.7±5.6% and vCBV=4.1±0.9 ml blood/ml brain (n=6), and VASO-ASE yielded OEF=34.1±5.3 and vCBV=5.5±2.1 ml blood/ml brain (n=5). In reproducibility considerations, the (ICC) was fair at 0.46 for ASE but moderate-to-good at 0.80 for VASO-ASE. SNR maps in Figure 4 show whole-brain SNR as 62.5±21.4 in ASE, and 39.8±20.3 in VASO-ASE, consistent with reduced longitudinal tissue magnetization in VASO-ASE. At long τ values (τ>20ms) non-linear signal decay was present in both sequences (Figure 5).Discussion
We investigated a novel contrast mechanism to isolate extravascular R2’, which in principle enables more appropriate application of extravascular static dephasing models for OEF and vCBV determination. In VASO-ASE (extravascular R2’), mean OEF decreased and vCBV increased compared to ASE (total parenchyma R2’). As seen in Figure 3, ASE also presents faster decay (greater R2’) compared to VASO-ASE, especially for long echo shifting times (Figure 5). Reduced R2’ is consistent with VASO-ASE measuring extravascular water only, as intravascular venous signal will decay more rapidly for this TE and field strength given longer tissue T2 relative to venous blood T2. There was only mild variation in SNR across the range investigated (Figure 4) and ICC values indicate higher reproducibility in VASO-ASE relative to ASE acquisitions. Comparison of the green line (linear fit τ=10-20ms) to the red line (linear fit τ=10-41ms) in Figure 5 (a) and (b) illustrates how non-linearity at long τ values results in over-estimated R2’ and vCBV values. Non-linearity is not consistent with the static-dephasing model assumptions, and may indicate that the contribution of total versus extravascular water diffusion differs with asymmetric shifting time, a novel finding which could improve OEF quantitation or perhaps serve as a foundation to interrogate extravascular diffusion with higher SNR compared to standard diffusion-weighted-imaging approaches.Acknowledgements
No acknowledgement found.References
1. Powers WJ, Clarke WR, Grubb RL, Jr., Videen TO, Adams HP, Jr., Derdeyn CP, Investigators C. Extracranial-intracranial bypass surgery for stroke prevention in hemodynamic cerebral ischemia: the Carotid Occlusion Surgery Study randomized trial. JAMA. 2011;306(18):1983-92. Epub 2011/11/10. doi: 10.1001/jama.2011.1610. PubMed PMID: 22068990; PMCID: PMC3601825.
2. Guilliams KP, Fields ME, Ragan DK, Eldeniz C, Binkley MM, Chen Y, Comiskey LS, Doctor A, Hulbert ML, Shimony JS, Vo KD, McKinstry RC, An H, Lee JM, Ford AL. Red cell exchange transfusions lower cerebral blood flow and oxygen extraction fraction in pediatric sickle cell anemia. Blood. 2018;131(9):1012-21. Epub 2017/12/20. doi: 10.1182/blood-2017-06-789842. PubMed PMID: 29255068; PMCID: PMC5833262.
3. Stone AJ, Harston GWJ, Carone D, Okell TW, Kennedy J, Blockley NP. Prospects for investigating brain oxygenation in acute stroke: Experience with a non-contrast quantitative BOLD based approach. Hum Brain Mapp. 2019;40(10):2853-66. Epub 2019/03/13. doi: 10.1002/hbm.24564. PubMed PMID: 30860660; PMCID: PMC6563088.
4. Gauthier CJ, Hoge RD. Magnetic resonance imaging of resting OEF and CMRO(2) using a generalized calibration model for hypercapnia and hyperoxia. Neuroimage. 2012;60(2):1212-25. Epub 2012/01/10. doi: 10.1016/j.neuroimage.2011.12.056. PubMed PMID: 22227047.
5. Bulte DP, Kelly M, Germuska M, Xie J, Chappell MA, Okell TW, Bright MG, Jezzard P. Quantitative measurement of cerebral physiology using respiratory-calibrated MRI. Neuroimage. 2012;60(1):582-91. Epub 2012/01/03. doi: 10.1016/j.neuroimage.2011.12.017. PubMed PMID: 22209811.
6. An H, Lin W. Quantitative measurements of cerebral blood oxygen saturation using magnetic resonance imaging. J Cereb Blood Flow Metab. 2000;20(8):1225-36. Epub 2000/08/19. doi: 10.1097/00004647-200008000-00008. PubMed PMID: 10950383; PMCID: PMC4096835.
7. Yablonskiy DA, Haacke EM. Theory of NMR signal behavior in magnetically inhomogeneous tissues: the static dephasing regime. Magn Reson Med. 1994;32(6):749-63. Epub 1994/12/01. doi: 10.1002/mrm.1910320610. PubMed PMID: 7869897.
8. Donahue MJ, Hoogduin H, van Zijl PC, Jezzard P, Luijten PR, Hendrikse J. Blood oxygenation level-dependent (BOLD) total and extravascular signal changes and DeltaR2* in human visual cortex at 1.5, 3.0 and 7.0 T. NMR Biomed. 2011;24(1):25-34. Epub 2011/01/25. doi: 10.1002/nbm.1552. PubMed PMID: 21259367.
9. Duong TQ, Yacoub E, Adriany G, Hu X, Ugurbil K, Kim SG. Microvascular BOLD contribution at 4 and 7 T in the human brain: gradient-echo and spin-echo fMRI with suppression of blood effects. Magn Reson Med. 2003;49(6):1019-27. Epub 2003/05/28. doi: 10.1002/mrm.10472. PubMed PMID: 12768579.
10. An H, Lin W. Impact of intravascular signal on quantitative measures of cerebral oxygen extraction and blood volume under normo- and hypercapnic conditions using an asymmetric spin echo approach. Magn Reson Med. 2003;50(4):708-16. Epub 2003/10/03. doi: 10.1002/mrm.10576. PubMed PMID: 14523956.
11. Lu H, Golay X, Pekar JJ, Van Zijl PC. Functional magnetic resonance imaging based on changes in vascular space occupancy. Magn Reson Med. 2003;50(2):263-74. Epub 2003/07/24. doi: 10.1002/mrm.10519. PubMed PMID: 12876702.
12. Weisskoff RM, Kiihne S. MRI susceptometry: image-based measurement of absolute susceptibility of MR contrast agents and human blood. Magn Reson Med. 1992;24(2):375-83. Epub 1992/04/01. doi: 10.1002/mrm.1910240219. PubMed PMID: 1569876.
Figures