1760
Quantifying Cerebral Microbleeds using MPRAGE-based Quantitative Susceptibility Mapping1Department of Biomedical Engineering, University of Alberta, Edmonton, AB, Canada, 2Division of Neurology, University of Alberta, Edmonton, AB, Canada
Synopsis
The MPRAGE sequence is commonly included in brain studies for structural imaging using magnitude images; however, its phase images can provide an opportunity to assess microbleed burden using Quantitative Susceptibility Mapping (QSM). In this study, the mean susceptibility and the cross-sectional area of cerebral microbleeds were assessed using a susceptibility map derived from the phase of the MPRAGE sequence, with comparison to QSM measurements based on standard multi-echo gradient-echo. Microbleeds were well visualized on MPRAGE-QSM with susceptibility generally higher on MPRAGE-QSM, mostly due to mismatch in spatial resolution and SNR.
Introduction
Cerebral microbleeds (CMBs) are chronic, tiny blood leakages associated with several neurological diseases including Alzheimer’s disease, cerebral amyloid angiopathy and vascular dementia.1-3 Localizing CMBs and quantifying their size and iron content can help in assessing the severity and monitoring the progression of the underlying illness. Quantitative Susceptibility Mapping (QSM) has been employed for assessing the burden of CMBs,4,5 but its standard multi-echo gradient-echo (MEGE) sequence is not commonly included in brain studies. 3D Magnetization-prepared rapid gradient-echo (MPRAGE) is a typical sequence in brain studies and its phase can be converted into a susceptibility map. A recent study showed that MPRAGE-QSM can provide sufficient contrast for regions of extreme iron concentration.6 In this study, we evaluate the potential of MPRAGE-QSM for assessing the burden of CMBs. CMB area and susceptibility are quantified using MPRAGE-QSM and compared to standard MEGE-QSM.Methods
Subjects and Imaging: Seven subjects (age 60-89 years, mean ± SD 73 ± 11, 2 females) were studied retrospectively based on the inclusion criteria of having CMBs and the availability of both MEGE and MPRAGE sequences with saved raw phase images. Brain imaging was done at 3T. Axial MEGE images were acquired with: subcallosal line alignment, 0.94x0.94x2.00 mm3 resolution, FOV 218x240x160 mm3, flip-angle 17°, TR 45 ms, TE1/ ∆TE/ TE7 3.8 ms/ 5.5 ms/ 36.8 ms, GRAPPA factor 2, acquired in 5.65 minutes. Sagittal MPRAGE images used 0.87x0.87x0.85 mm3 resolution, FOV 250x250x174 mm3, flip-angle 8°, TR 1800 ms, TI 900 ms, TE 2.37 ms, GRAPPA factor 3, acquired in 3.65 minutes. The two sequences were not always acquired on the same day. The longest interval between the two scans was three weeks.Data Processing and Analysis: PRELUDE was used to resolve aliasing in phase images of both sequences.7 Phase contributions from background field were removed using RESHARP,8 and susceptibility maps were produced using Total Variation dipole inversion. 2D ROIs were manually drawn to measure the area and the mean susceptibility of each CMB. A CMB ROI was formed by all connected voxels whose susceptibility is larger than 0.09 ppm. Statistical differences were evaluated using a paired t-test with α =0.05.
Results and Discussion
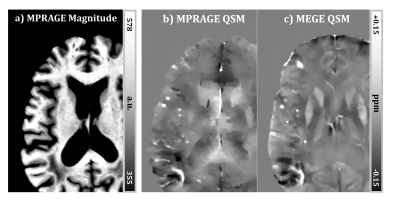
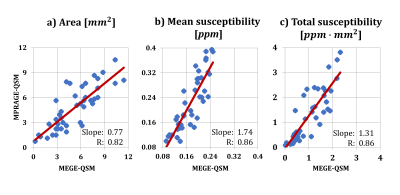
Strong susceptibility sources such as CMBs introduce sufficient phase shift to be depicted clearly on MPRAGE-QSM, as shown in Figure 1. Detecting CMBs and quantifying their size is easier on the MPRAGE-QSM than the T1-weighted MPRAGE magnitude, and thus MPRAGE-QSM provides additional valuable information beyond MPRAGE magnitude. However, MPRAGE data has lower SNR than standard MEGE used for QSM due to the higher resolution (smaller voxels), higher acceleration factor, lower flip-angle, single-echo measurement, and T1 recovery during acquisition readouts. Altogether with the short TE (2.37 ms), QSM produced from MPRAGE phase had limited quality for most structures, other than strong sources like CMBs or highly iron rich regions.Forty three CMBs were identified on MEGE-QSM across all subjects, and all were found on MPRAGE-QSM. When compared to standard QSM, area measurements of CMBs are smaller on MPRAGE-QSM (0.77 slope, p <0.05). In contrast, CMB mean susceptibility is generally higher on MPRAGE-QSM (1.74 slope, p < 6x10⁻⁷), as illustrated in Figure 2. A possible major reason for the deviation of the slopes from 1.0 is the difference in spatial resolution. As resolution increases, both partial volume effect and digitization error get reduced. Previous studies have reported susceptibility underestimation as voxel size increases.9,10 Further, CMB volume on QSM has been reported to increase with TE,4 and here MEGE sequence used longer TEs than MPRAGE. Liu et al. suggested quantifying CMBs using total susceptibility instead of the mean value, and demonstrated reduced variation with TE.4 When total susceptibility (i.e., mean susceptibility x area) is reported instead, the slope reduces to 1.31 (p < 2x10⁻³) and gets closer to 1.0 (Figure 2c). Part of the measurement variation along the fitting line can be attributed to the differences in spatial resolution and slice orientation, as the measurements are not done on identical CMB cross-sections. Further, phase processing methods/parameters have significant influence on the final susceptibility map and could be contributing to the observed variation. Optimal processing for MPRAGE-QSM is under further investigation.
Conclusion
The MPRAGE sequence is commonly included in brain studies, and its phase can provide opportunity to assess microbleed burden. The quality of MPRAGE-QSM is limited by the short TE and the low SNR, but can still be useful for quantifying strong susceptibility sources when an additional MEGE sequence is not available. Results showed that CMBs are well visualized and susceptibility can be quantified using MPRAGE-QSM, however reliability and optimal processing are still ongoing research.Acknowledgements
Funding from Canadian Institutes of Health Research is acknowledgedReferences
1. Cordonnier C, Salman RA-S, Wardlaw J. Spontaneous brain microbleeds: systematic review, subgroup analyses and standards for study design and reporting. Brain 2007;130(8):1988–2003.
2. Greenberg SM, Vernooij MW, Cordonnier C, et al. Cerebral microbleeds: a guide to detection and interpretation. Lancet Neurol 2009;8:165–174.
3. McAuley G, Schrag M, Barnes S, et al. Iron quantification of microbleeds in postmortem brain. Magnetic resonance in medicine. 2011;65(6):1592-601.
4. Liu T, Surapaneni K, Lou M, Cheng L, Spincemaille P, Wang Y. Cerebral microbleeds: burden assessment by using quantitative susceptibility mapping. Radiology. 2012;262(1):269-78.
5. Klohs J, Deistung A, Schweser F, et al. Detection of cerebral microbleeds with quantitative susceptibility mapping in the ArcAbeta mouse model of cerebral amyloidosis. J Cereb Blood Flow Metab. 2011;31(12):2282–2292.
6. Naji N, Wilman A. Exploiting MPRAGE phase to improve Globus Pallidus segmentation. In Proceedings of the 27th Annual Meeting of ISMRM, Montreal, Canada. 2019; p. 2717.
7. Jenkinson M. Fast, automated,N-dimensional phase-unwrapping algorithm. Magn Reson Med. 2003;49(1):193-197.
8. Sun H, Wilman AH. Background field removal using spherical mean value filtering and Tikhonov regularization. Magn Reson Med. 2014;71(3):1151-1157.
9. Zhou, D, Cho, J, Zhang, J, Spincemaille, P, Wang, Y. Susceptibility underestimation in a high‐susceptibility phantom: dependence on imaging resolution, magnitude contrast, and other parameters. Magnetic resonance in medicine. 2017;78(3): 1080-1086.
10. Karsa, A, Punwani, S, Shmueli, K. The effect of low resolution and coverage on the accuracy of susceptibility mapping. Magnetic resonance in medicine. 2019; 81(3):1833-1848.
Figures

