1756
The effect of distinct spatial resolution on quantitative maps using synthetic MRI1Department of Radiology, Sun Yat-Sen University Cancer Center, Guangzhou, China, 2MR Research, GE Healthcare, Beijing, China
Synopsis
In the field of neuroscience, an emerging technology named relaxation quantitative MRI (RQ-MRI) have demonstrated its great potential in both clinic and research. Among those RQ-MRI related technologies, the synthetic MRI has moved rapidly towards clinical application due to its acceptable acquisition time. However, how the spatial resolution of synthetic MRI impacts the quantitative maps is still largely unclear. To address this question, in current study, a total of 13 normal subjects with four distinct spatial resolutions were applied. Our results demonstrated that both the in-plane resolution and slice thickness have significantly influence on the measured quantitative values.
Introduction
In the field of cognitive neuroscience, an emerging technology named relaxation quantitative MRI (RQ-MRI) have demonstrated its great potential in both clinic and research. Among those RQ-MRI related technologies, the synthetic MRI has moved rapidly towards clinical application due to its acceptable acquisition time and available three quantitative metrics.1,2 However, previous studies are focused on relatively large inter-slice spacing (>= 4 mm), which results in a short time approximately equal to 5 minutes.3 In cognitive neuroscience, high spatial resolution is essential to our research, and some similar RQ-MRI technologies have provided spatial resolution nearly equal to 1 mm isotropic.4 Hence, to investigate how those distinct relatively high spatial resolutions of synthetic MRI impact the ultimate quantitative maps. A total of 13 healthy subjects with four distinct spatial resolutions were applied in current study.Methods
For each subject, MR scans were performed on a 3.0 T whole body scanner (Signa Pioneer, GE, WI) with a 32-channel head coil. Axial images were acquired using 3D BRAVO sequence and synthetic MRI (magnetic resonance image compilation, MAGiC). All subjects were scanned using synthetic MRI with four distinct spatial resolutions, including 2*2*2 (Group 1), 1*1*2 (Group 2), 1*1*3 (Group 3), 1*1*4 (Group 4). The other parameters were: TR = 10000 ms, TE = 21& 95 ms, interval = 0 mm, FOV = 25.6 cm, receiver bandwidth 35.71 kHz. The parameters of 3D BRAVO were: TR = 7.3 ms, TE = min full, slice thickness = 1 mm, FOV = 25.6 cm, image matrix = 256*256. The total scan time was 44 minutes and 16 seconds. The quantitative maps were obtained using SyMRI software. To extract the atlas based quantitative values, T1 anatomical images of each subjects were first co-registered to T1 map. Then, the co-registered T1 images were normalized to MNI space using SPM12. Thereafter, all the quantitative images could be transformed to MNI space. Last, the AAL atlas were applied to all the normalized quantitative maps to extract the values of the former 90 regions. Then, the results were analyzed by paired t-test. A value of P < 0.05 were considered statistically significant.Results and discussion
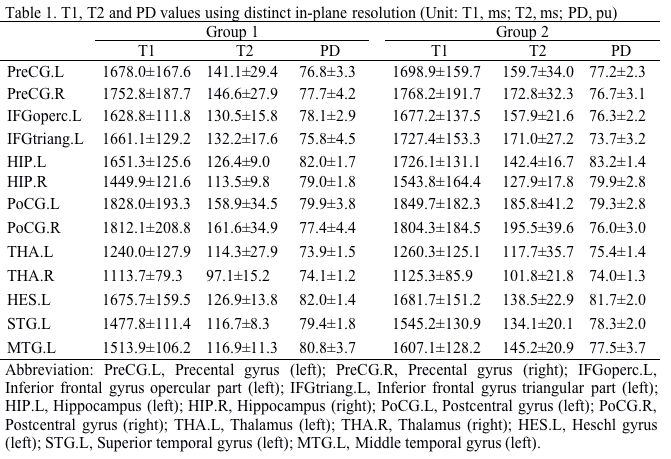
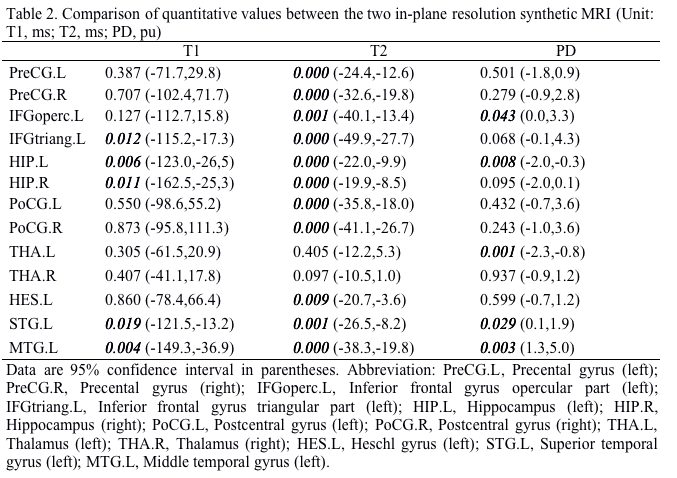
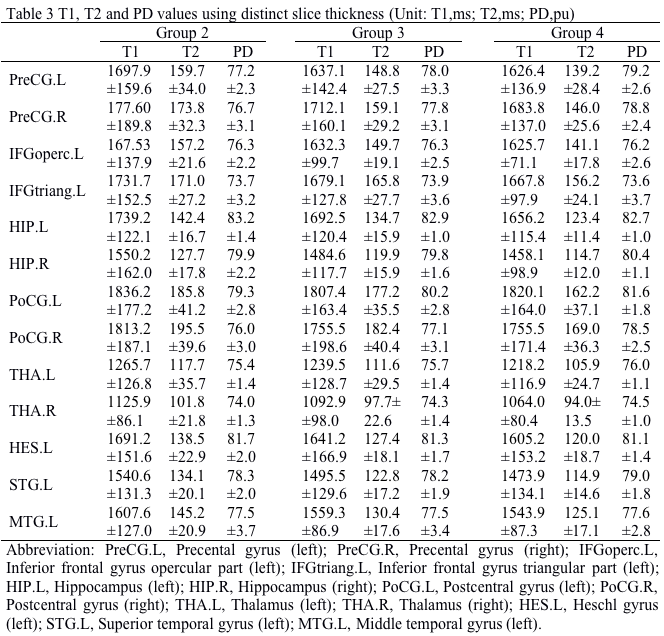
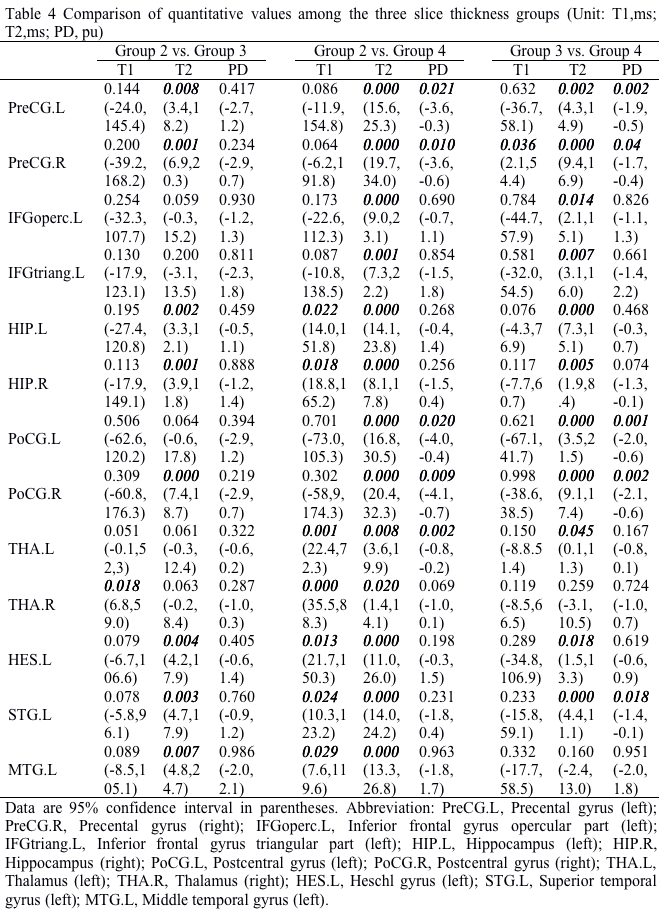
Among those 90 regions, a total of 13 language related brain regions were analyzed in current study, including bilateral Precental gyrus (PreCG), Hippocampus (HIP), Thalamus (THA), Postcentral gyrus (PoCG), left Inferior frontal gyrus opercular part (IFGoperc), Inferior frontal gyrus triangular part (IFGtriang), Heschl gyrus (HES), Superior temporal gyrus (STG), Middle temporal gyrus (MTG). The T1, T2 and PD values of those 13 brain regions derived from synthetic MRI with two distinct in-plane resolutions were summarized in Table 1, and the corresponding P-values and 95% confidence intervals between the Group 1 and 2 were demonstrated in Table 2. The brain regions with significant different T1 values between the two in-plane resolution data included IFGtriang.L, HIP.L, HIP.R, STG.L and MTG.L. With regard to T2 maps, all the brain regions except for THA.L and THA.R showed significant difference. Additionally, brain regions in IFGoperc.L, HIP.L, THA.L, STG.L and MTG.L showed statistically significant different PD values (Table 2). The T1, T2 and PD values of those 13 brain regions for the three distinct slice thickness groups were summarized in Table 3, and the P-values and 95% confidence intervals among the three groups were demonstrated in Table 4. The brain regions with significant different T1 values included THA.R between Group 2 and Group 3, and HIP.L, HIP.R, THA.L, THA.R, HES.L, STG.L and MTG.L between the Group 2 and Group 4. With regard to T2 maps, the significant brain regions included all the brain regions between the Group 2 and Group 4, all brain regions except THA.R and MTG.L between Group 3 and Group 4, and PreCG.L, PreCG.R, HIP.L, HIP.R, PoCG.R, HES.L, STG.L, MTG.L between Group 2 and Group 3. In addition, the regions with significant PD values included PreCG.L, PreCG.R, PoCG.L, PoCG.R, THA.L between Group 2 and Group 4, PreCG.L, PreCG.R, PoCG.L and PoCG.R, STG.L between Group 3 and Group 4 (Table 4). Variations in in-plane and through-plane resolutions had a substantially effect on quantitative T2 value. The differences in discovered brain regions may associate with the variations in the partial volume. Further, the different SNRs of the distinct images might account for the different relaxation parameter values.5Conclusion
Our results showed that the quantitative T1 and PD values of the selected brain regions were relatively stable in some brain regions, while the quantitative T2 values were greatly changed with distinct spatial resolution.Acknowledgements
No acknowledgement found.References
1. Warntjes JB, Dahlqvist O, Lundberg P.Novel method for rapid, simultaneous T1, T2*, and proton density quantification[J].Magn Reson Med. 2007;57(3):528-37.
2. Warntjes JB, Leinhard OD, West J, et al.Rapid magnetic resonance quantification on the brain: Optimization for clinical usage[J]. Magn Reson Med. 2008;60(2):320-9.
3. Tanenbaum LN, Tsiouris AJ, Johnson AN, et al: Synthetic MRI for Clinical Neuroimaging: Results of the Magnetic Resonance Image Compilation (MAGiC) Prospective, Multicenter, Multireader Trial[J]. AJNR Am J Neuroradiol.2017;38(6):1103-1110.
4. Gomez J , Barnett M A , Natu V , et al. Microstructural proliferation in human cortex is coupled with the development of face processing[J]. Science, 2017, 355(6320):68-71.
5. Greil G , Geva T , Maier S E , et al. Effect of acquisition parameters on the accuracy of velocity encoded cine magnetic resonance imaging blood flow measurements[J]. Journal of magnetic resonance imaging : JMRI, 2002, 15(1):47-54.
Figures