1753
Assessing and comparing the suitability of 3D Gradient Echo and VIBE for quantifying subtle blood-brain barrier leakage1CISC, Brighton and Sussex Medical School, Brighton, United Kingdom, 2School of Psychology, University of Sussex, Brighton, United Kingdom
Synopsis
There is increasing interest in measuring leakage across the blood-brain barrier (BBB) to assess its response to pathology, inflammation or ageing. Quantifying permeability of the BBB is typically performed using dynamic contrast enhanced (DCE) MRI which involves repeated T1-weighted imaging following administration of a Gd contrast agent. In this work, we assess the suitability of two popular DCE acquisition approaches to BBB permeability: (1) a slow gradient echo approach and (2) fast T1-weighted imaging using the VIBE technique . We discuss the advantages and disadvantages of both techniques and recommend the optimum technique for quantification of subtle BBB permeability.
Purpose
To compare the fast 3D VIBE with the slower 3D gradient echo to assess which approach is best suited to quantifying subtle blood-brain barrier leakage with dynamic contrast enhanced MRI.Introduction
The permeability of the blood-brain barrier (BBB) is a highly sensitive marker for subtle white matter (WM) damage in a number of neurological diseases and group differences have already been reported for dementia, mild cognitive impairment, multiple sclerosis, HIV, tumour and stroke [1-4].Dynamic Contrast Enhanced MRI (DCE-MRI) is used to quantify BBB permeability with the parameter Ktrans [5]. Signal enhancement in healthy WM is very low (~1%) corresponding to Ktrans=0.1-0.6x10⁻³min-1 [1]. Consequently, it is a challenge to quantify subtle BBB leakage as great demands are placed on data acquisition and analysis. Scanner drift, image artefact and subject motion are common problems with DCE-MRI that disrupt quantification. Two acquisition approaches are commonly used with DCE-MRI in the BBB: T1w gradient echo (GRE) [6] and the T1w VIBE [3,4]. In this work we will compare and discuss the suitability of the GRE and T1w VIBE protocols, and study these techniques for quantifying BBB leakage by assessing to short-term machine instability and drift following the repeat scanning of healthy volunteers without the administration of Gd contrast agent.
Methods
All imaging was performed on a Siemens Prisma 3.0T MR scanner. Two whole-brain DCE-MRI protocols were established:The 3D gradient echo (GRE) imaging protocol involves repeated acquisition of GRE volumes with TR=30ms, voxel size=1.2 x 1.2 x 3 mm, matrix size=217 x 240 x 168, FA=5, 15°, 25° repeated cyclically for successive volume acquisitions [7]. Total acquisition time was 40 minutes, (acquisition time per volume ~90s).
The 3D T1w VIBE imaging protocol was TR=2.56ms, TE=0.86ms, slices=36, voxel size=2.5 x 2.5 x 5mm, matrix size=96x72x28, FA=15°, 432 repeated volumes. Total acquisition time was ~17.5mins (acquisition time per volume ~2.5s). Sagittal slice orientation was used for both methods to avoid wrap-around artefact from the neck and shoulders.
Subjects. Healthy volunteers were scanned with the GRE (N=4) and the VIBE (N=5) protocols.
Data analysis: The data were co-registered with SPM12 to a high-resolution MP-RAGE image from the same imaging session. Regions-of-interest (ROIs) were selected in the WM for comparison between the two acquisition methods. Signal variation is expressed as a percentage difference from the mean signal value across the entire acquisition. Standard deviation (SD) and the standard deviation of the mean (SDOM = SD/√N) was calculated to quantify variability. Machine drift was calculated from the total range in signal deviation from the mean. To fairly compare the drift between the GRE approach and VIBE, signal was averaged across the same time interval and since each GRE volume took ~90s to acquire, we averaged data from 37 volumes of the VIBE data set in a moving window across the entire acquisition. Subject motion was quantified using MCFLIRT from FSL.
Results
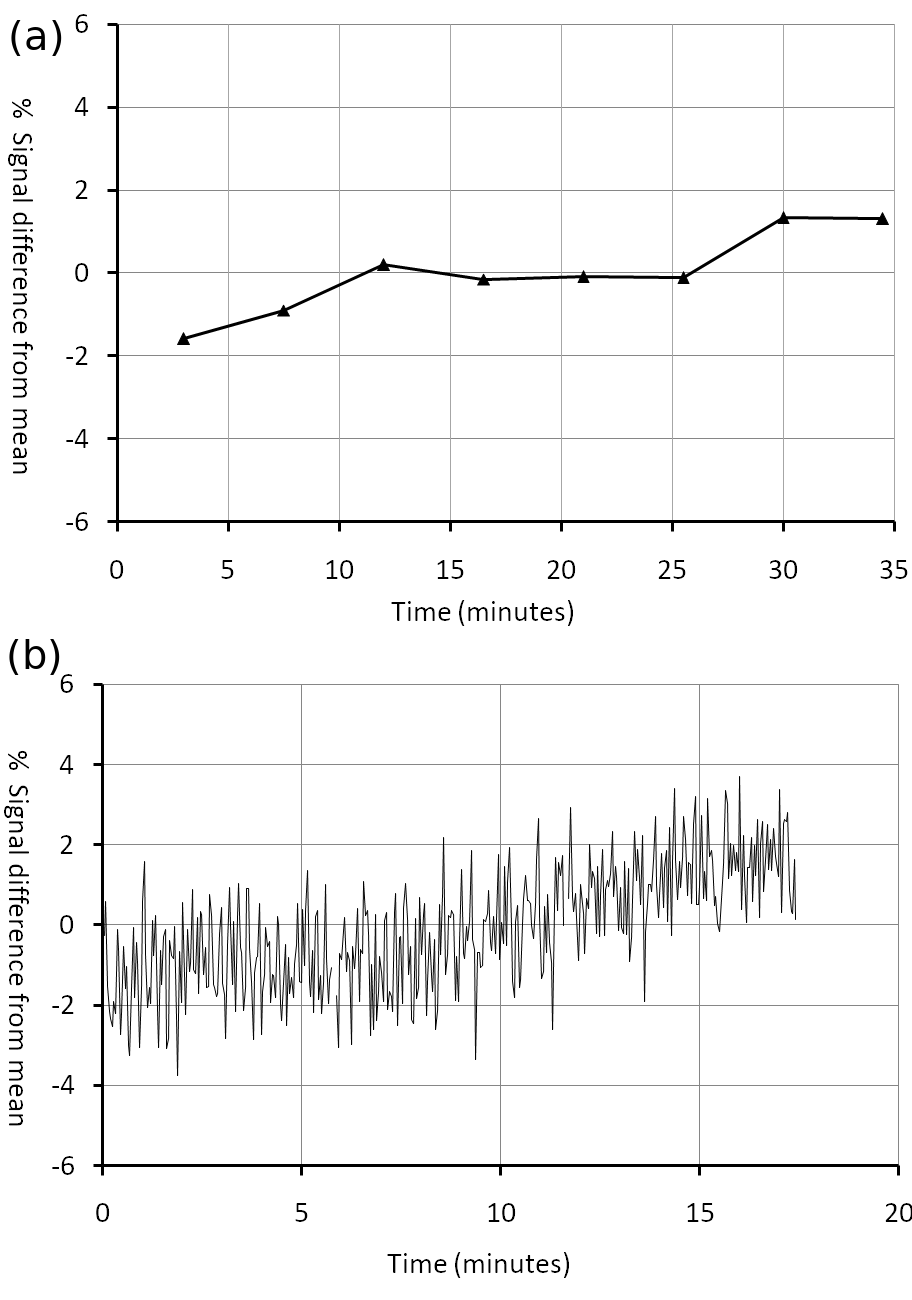
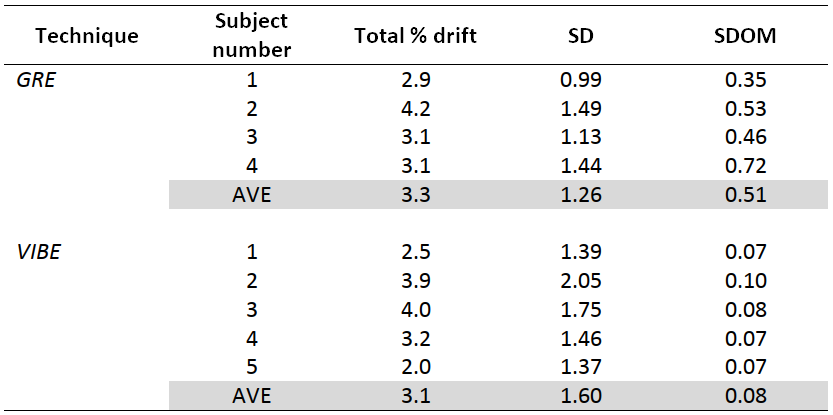
Both imaging approaches exhibited machine drift during scanning for participants of between ~3-4% (Table 1). Representative data from a subject are shown in Figure 1. Both techniques typically show a complex non-linear drift pattern over the duration of the scan, although the drift occurs more rapidly with the VIBE technique.There is significantly greater point-to-point variability in the VIBE data (Figure 1b), probably due to the lower SNR as a result of the large T1 weighting introduced by the very short TR. This is reflected in the larger standard deviation SD in percentage signal change (Table 1). However, owing to the much higher temporal resolution of the VIBE approach the standard deviation of the mean SDOM is much smaller than in GRE (Table 1). Subject movement was greater in GRE likely because of the much longer acquisition time.
Discussion and Conclusion
This study revealed that SD is lower in GRE but, crucially, the SDOM is much lower for VIBE. In DCE-MRI analyses models are fitted to the entire data set and so the SDOM is the important metric for determining reliability. In this case, the VIBE technique outperforms GRE by an order of magnitude.Signal drift is comparable in both techniques. The rapid drift observed with VIBE was probably due to the increased demands of the scanner hardware brought by the short TR. MR gradients and the RF chain are known to be sensitive to the temperature fluctuations and are a possible source of the observed drift [8]. However, this relationship is very complex because it is impossible to characterize the initial thermal state of the machine and since MR scanners have multiple sources of thermal heating and cooling. Consequently, modelling or predicting signal drift is highly problematic.
Signal drift of the size observed here can be catastrophic to subtle BBB leakage measures because the expected signal changes for a healthy BBB are approximately 1%. However, it may be possible to correct for signal drift if a phantom is scanned during the DCE-MRI protocol, assuming that the temperature of the phantom is fixed and the B1+ and B1- changes uniformly across the entire image.
In conclusion, the T1w VIBE acquisition scheme represents the best opportunity to measure subtle BBB permeability, although steps need to be taken to measure and account for machine drift.
Acknowledgements
This work was generously funded through a PhD scholarship to author NA from the Saudi Arabian Government Scholarship, Saudi Cultural Bureau.References
1. Iannotti F et al, JCAT 1987;11:390
2. Taheri S et al, MS and Related Disorders 2013; 2:124
3. Cramer SP and Larsson HBW, JCBFM 2014; 34:1655
4. Montagne A et al, Neuron 2015; 85:296
5. Tofts PS, Brix G et al Magn Reson Imag 1996; 14:373
6. Heye AK et al, Neuroimage 2016; 125:446
7. Dowell NG et al Proc. ISMRM Paris 2018:2769
8. Ebel A et al Magn Reson Med. 2005 Feb; 53:465
Figures