1752
Comparison of advanced quantitative diffusion MRI parameter in a multi-site MR study using the traveling volunteer approach
Daniel Güllmar1, Renat Sibgatulin1, Stefan Ropele2, and Jürgen R Reichenbach1,3
1Medical Physics Group / IDIR, Jena University Hospital, Jena, Germany, 2Department of Neurology, Medical University of Graz, Graz, Austria, 3Michael-Stifel-Center for Data driven sciences, Friedrich-Schiller-University Jena, Jena, Germany
1Medical Physics Group / IDIR, Jena University Hospital, Jena, Germany, 2Department of Neurology, Medical University of Graz, Graz, Austria, 3Michael-Stifel-Center for Data driven sciences, Friedrich-Schiller-University Jena, Jena, Germany
Synopsis
If quantitative diffusion measures are acquired at different sites but identical hardware and protocol settings, it remains unclear if a site bias would require a data homogenization in order to pool the data for analysis. A traveling volunteer (including four subjects) approach was applied and different complex diffusion measure as well as diffusion tensor metrics were computed based on the measurements at two different sites. Our results suggest that the inter-site differences are much smaller than the inter-subject differences in the ROI based analysis. The voxel-wise analysis was found to be more susceptible to incomplete artifact compensation and registration errors.
Introduction
Multi-site studies are often an indispensable approach to conducting more extensive studies with the available measurement time. To perform quantitative analysis with pooled data from such a multi-site study, one has to make sure that the used protocols and hardware preconditions are as similar (if not identical) as possible. Especially in quantitative MRI (e.g., diffusion measurements), it is required to assess the repeatability by measuring the same object at all sites using the same equipment and methods. But also the means for evaluating the correspondence of the measured parameters need to be as robust as possible. Thus, the aim of the study was to assess the correspondence of advanced and sophisticated diffusion measures acquired at different time points and sites on the same subjects.Material and Methods
As part of an ongoing multi-site multiple-sclerosis study between the Jena University Hospital, Germany, and the University Hospital in Graz, Austria, four healthy volunteers were scanned once at both sites, respectively. At both sites, 3T MRI (Siemens Prisma, 20 channel head coil (16 active channels)) with slightly different software versions (VE11B vs. VE11C) but identical MR imaging protocols and hardware settings were utilized. The predefined MR study protocol included an advanced diffusion MR acquisition consisting of 101 volumes, three shells, 8x b@5s/mm2, 16x b@850s/mm2, 32x b@1680s/mm2, 48x b@2500s/mm2, 1.5 mm isotropic resolution. All volumes were measured twice with reversed phase encoding polarity to facilitate susceptibility artifact compensation. The preprocessing included denoising [4], topup [5], and eddy current correction [6]. The ROI for white matter was defined by combining the white matter segmentations of FSL-fast [7] and Freesurfer [8], followed by a 2D binary closing and 3D erosion operation. Diffusion tensor metrics (FA, RD, MD) were computed using the DTIFIT routine from FSL using weighted least squares. The spherical mean technique (SMT, [1]) was used to map microscopic diffusion anisotropy parameters. Neurite orientation dispersion and density imaging (NODDI, [2]) was computed using the AMICO implementation [3]. All evaluated diffusion metrics are listed in Table 1. The selected ROI as well as the maps of the different quantitative diffusion measures are shown for one of the measurements for a selected axial slice position in Figure 1. The ROIs were generated only once for the data acquired at one site and then transferred and applied at the second site by using linear transformation and nearest-neighbor interpolation. ROI values were evaluated by comparing mean and median values, and by comparing empirical cumulative distribution functions (eCDF). The time interval between the scans at the two sites was between 2 and 4 months for each volunteer.Results
For most of the compared diffusion measures, the inter-site differences were found to be smaller than the inter-subject differences. This is reflected by coincident eCDF curves (see Fig. 2., dtifit_FA selected as an example) for the measurements conducted at the two sites compared to the curves corresponding to measurements between volunteers. Median as well as mean values for the white matter ROIs also show smaller differences between the sites than between subjects. In the second analysis step, which involved linear transformation and tri-linear data interpolation from siteB to siteA, difference maps (siteA–siteB) for the different diffusion metrics were voxel-wise calculated for each volunteer (see Fig. 3 for an example of the diffusion metrics FA and ICVF(NODDI) for one volunteer). As seen, there exist spatial inhomogeneous distributed variations, which may be due to suboptimal registration of the data sets or discrepancies in the artifact compensation due to slightly different head positioning and orientations. The difference maps were subsequently analyzed by using eCDF plots of the predefined white matter ROI (see Fig. 4). Ideally, these eCDF of the pairwise differences should cross the point with coordinates (0, 0.5), indicating a non-biased difference. As seen from Fig. 4, the results for MD, ICVF(NODDI), intra-neurite-volume-fraction(SMT) are closely distributed around this specific point, whereas the eCDFs of the FA differences are right-shifted, indicating a general positive bias of dtifit_FA @ siteA.Discussion
Our results suggest that multi-site MR studies investigating quantitative diffusion measures can be performed without any further data homogenization, if identical hard- and software settings are selected. The most serious difficulty arises most likely from an inconsistent patient positioning in the scanner at both sites. This issue will be investigated in future steps. One further possibility relates to physiological changes occurring in the volunteers between the two measurements as they were performed with a time interval of up to 4 monthsAcknowledgements
This study was financially supported by the German research foundation (RE-1123/21-1) and the Austrian Science Foundation (FWF I3001-B27).References
- E. Kaden, F. Kruggel, DC Alexander, Quantitative mapping of the per-axon diffusion coefficients in brain white matter, MRM, 75 (4), 2016
- Zhang H1, Schneider T, Wheeler-Kingshott CA, Alexander DC., NODDI: practical in vivo neurite orientation dispersion and density imaging of the human brain. Neuroimage. 2012 Jul 16;61(4):1000-1
- Alessandro Daducci, Erick Canales-Rodriguez, Hui Zhang, Tim Dyrby, Daniel Alexander, Jean-Philippe Thiran, Accelerated Microstructure Imaging via Convex Optimization (AMICO) from diffusion MRI data. NeuroImage 105, pp. 32-44 (2015)
- Veraart, J.; Novikov, D.S.; Christiaens, D.; Ades-aron, B.; Sijbers, J. & Fieremans, E. Denoising of diffusion MRI using random matrix theory.NeuroImage, 2016, 142, 394-406
- J.L.R. Andersson, S. Skare, J. Ashburner. How to correct susceptibility distortions in spin-echo echo-planar images: application to diffusion tensor imaging. NeuroImage, 20(2):870-888, 2003.
- Jesper L. R. Andersson and Stamatios N. Sotiropoulos. An integrated approach to correction for off-resonance effects and subject movement in diffusion MR imaging. NeuroImage, 125:1063-1078, 2016.
- Zhang, Y. and Brady, M. and Smith, S. Segmentation of brain MR images through a hidden Markov random field model and the expectation-maximization algorithm. IEEE Trans Med Imag, 20(1):45-57, 2001.
- Desikan, R.S., Segonne, F., Fischl, B., Quinn, B.T., Dickerson, B.C., Blacker, D., Buckner, R.L., Dale, A.M., Maguire, R.P., Hyman, B.T., Albert, M.S., Killiany, R.J., 2006. An automated labeling system for subdividing the human cerebral cortex on MRI scans into gyral based regions of interest. Neuroimage 31, 968-980.
Figures
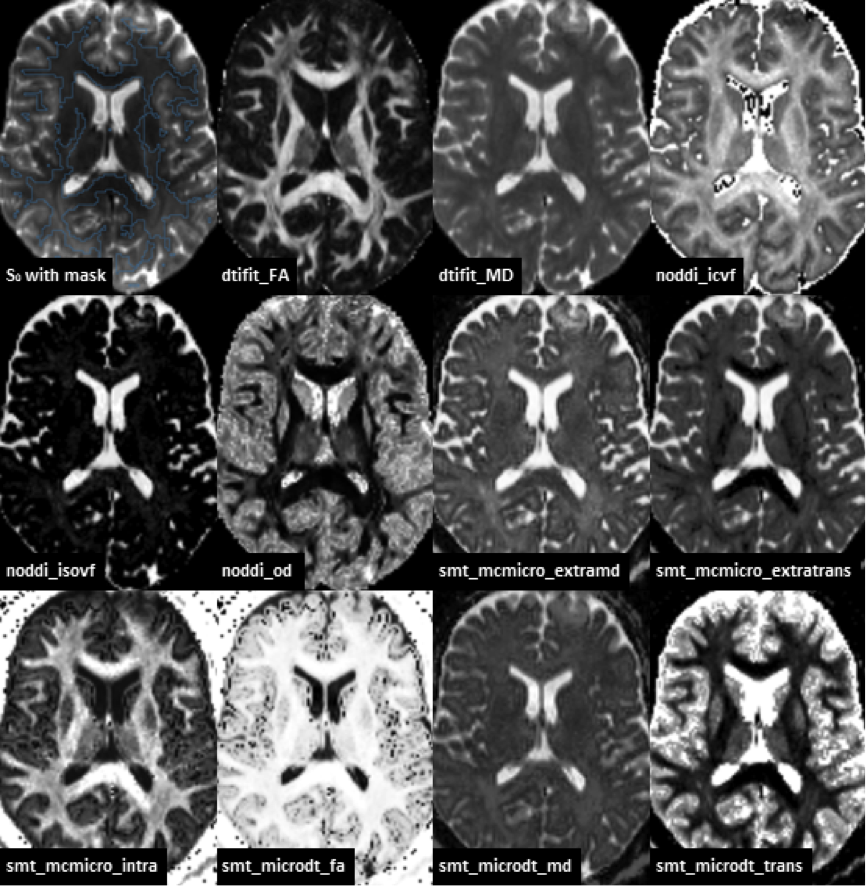
Figure 1.
Axial slices for one single measurement of the different quantitative diffusion
quantities. The top left image shows the white matter mask overlaid on the S0
image.
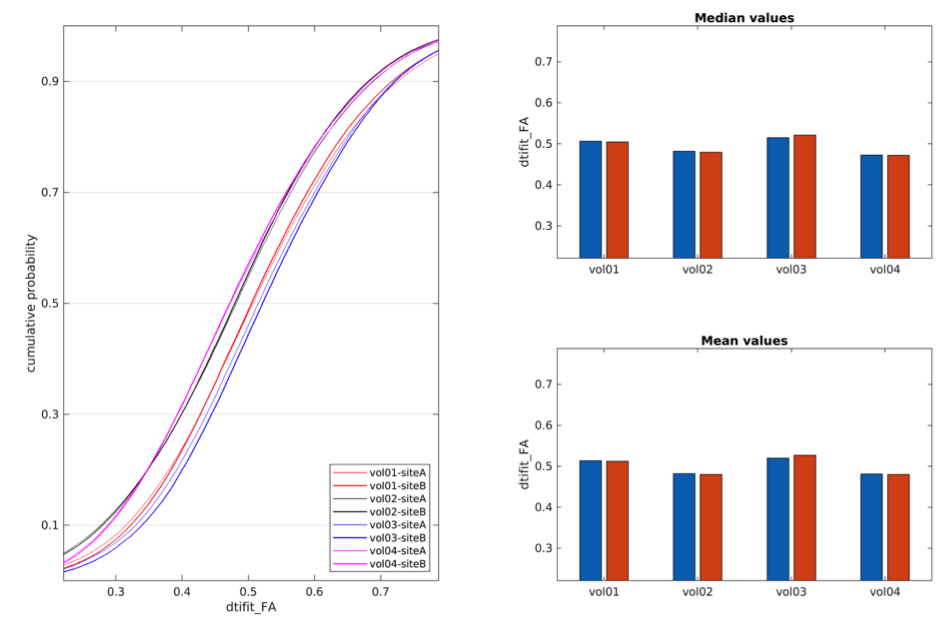
Figure
2. Left eCDF plots of FA ROI data for the four
traveling volunteers for each site. The median and mean values of the corresponding
ROIs are displayed top and bottom right, respectively. Blue bars indicate
individual values at siteA, red bars for siteB.
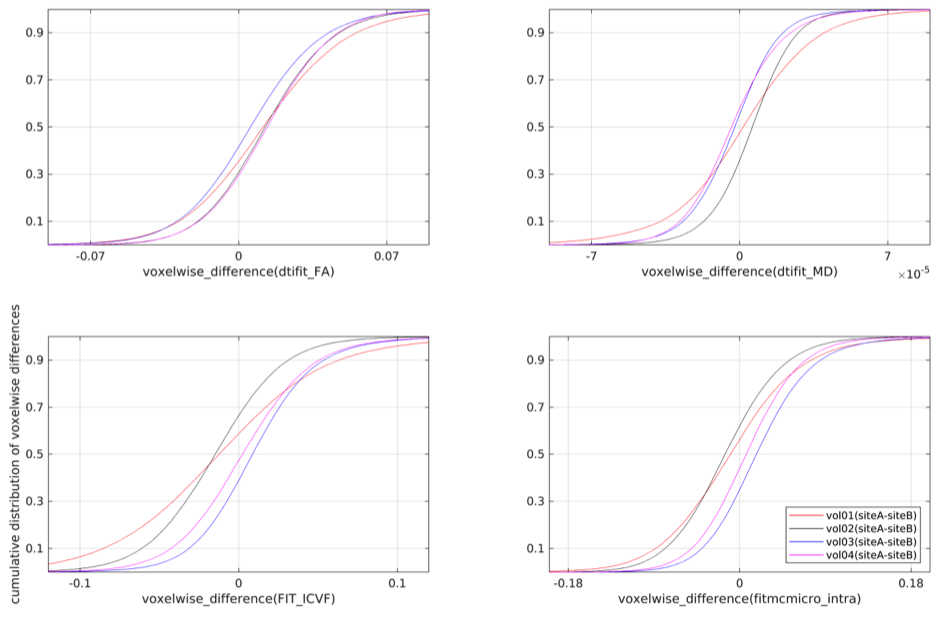
Figure 4. Each
subfigure shows the eCDF of the voxel-wise difference for four different
investigated measures (FA, MD, ICVF(NODDI), intra-neurite-volume-fraction(SMT))
within the predefined white matter ROI.
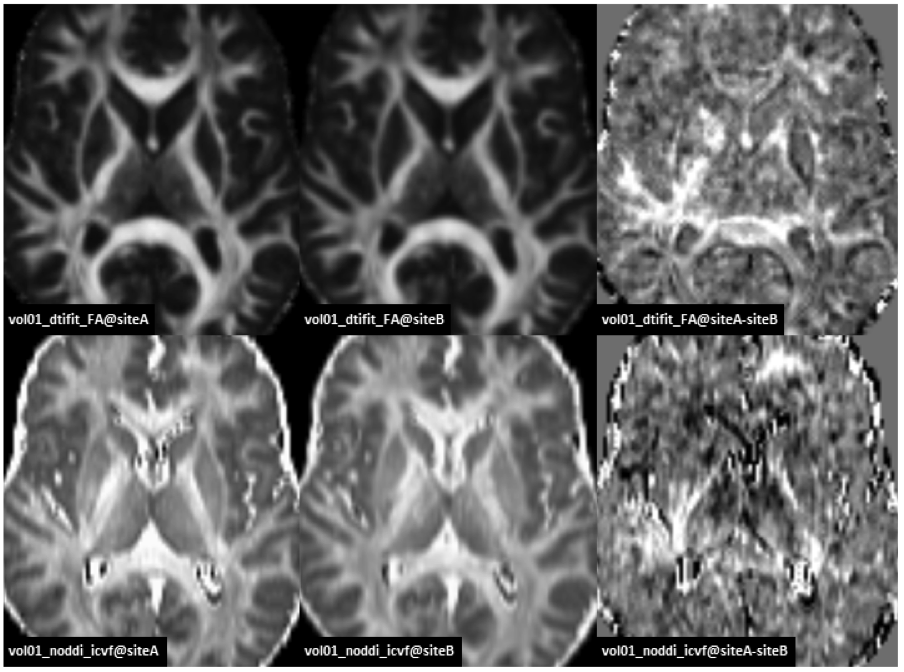
Figure 3. Axial
slices of demonstrating the voxel-wise differences for dtifit_FA (upper row) as
well as noddi_icvf (lower row) for volunteer01.
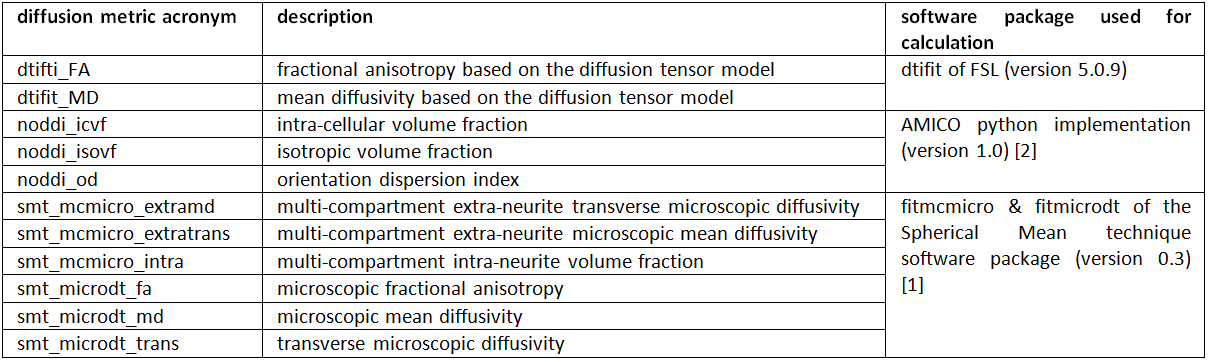
Table 1. List of diffusion metric acronyms (column 1),
their corresponding description (column 2) as well as information about the
used commands and software packages (column 3)