1751
Quantitative susceptibility mapping: comparison of reproducibility between 3T and 7T1Weill Cornell Medicine, New York, NY, United States, 2General Electrical Healthcare, Waukesha, WI, United States
Synopsis
In this work, we compare the performance of QSM at 7T versus 3T in an intra-scanner test-retest experiment with varying echo numbers and in an image quality analysis. QSM was reproducible within fixed field strength when the same number of echoes were used. Across field strengths and with different numbers of echoes, QSM was reproducible between the 3T acquisition with 10 echoes and the 7T acquisition with 5 echoes. The preliminary data suggest that 7T can be used to shorten QSM acquisition time or enable higher resolution QSM in clinically acceptable scan times.
Introduction
Ultra-high-field 7T promises more than doubling the signal-to-noise ratio (SNR) of 3T for MRI1,2, particularly for MRI of magnetic susceptibility effects induced by B0 . Quantitative susceptibility mapping (QSM) is based on deconvolving the induced phase (or field) and would therefore benefit substantially from 7T. The purpose of this work was to compare QSM performance at 7T versus 3T in an intra-scanner test-retest experiment with varying echo numbers and in an image quality analysis.Methods
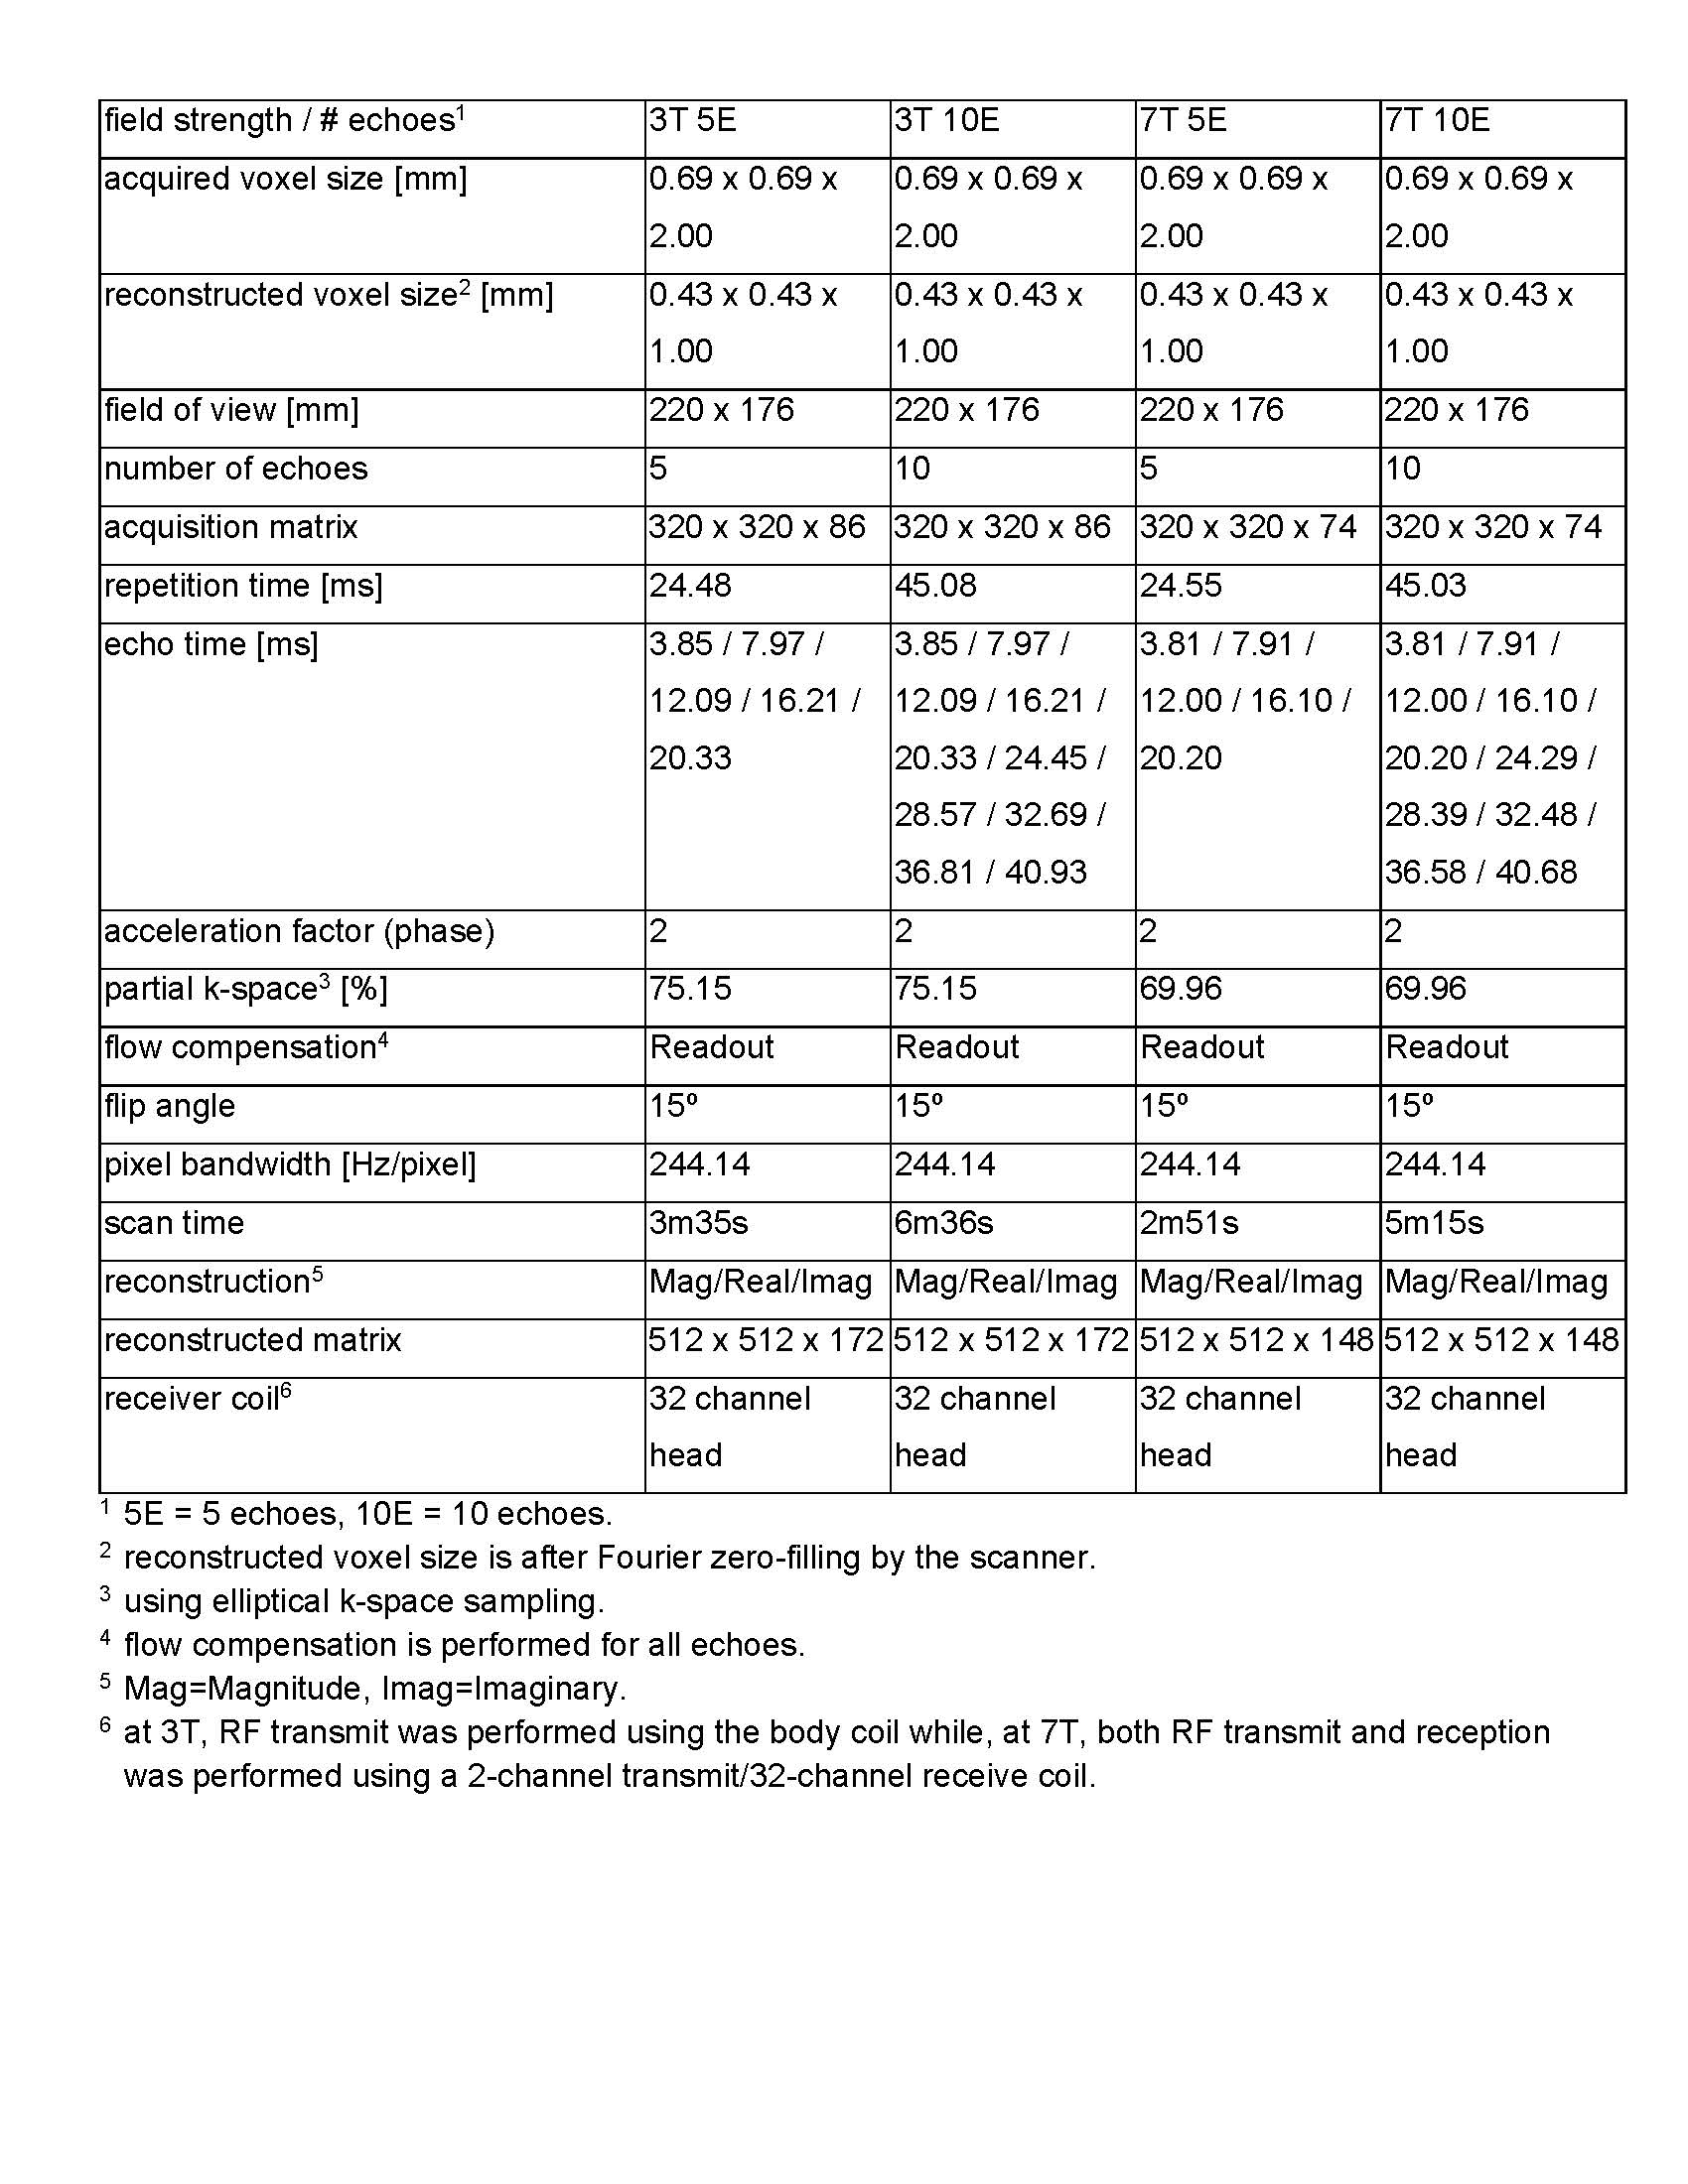
Data acquisitionMRI was performed in N=10 healthy subjects (2 female) with ages ranging between 19-68 years (average 52 years) under an IRB approved protocol. Informed consent was obtained from each subject. 3D multiple echo gradient echo (mGRE) data were acquired on a prototype 7T MR scanner (MR950, Signa 7.0T, General Electric Healthcare, Waukesha, WI, USA) and on a 3T MR scanner (Discovery MR750, General Electric Healthcare, Waukesha, WI, USA) using a 2-channel transmit/ 32‑channel receive head coil at 7T and the body transmit coil and a 32 channel receive head coil at 3T. For each subject and each field strength two mGRE acquisitions were performed with identical parameters, except for the number of echoes, which was 5 and 10, respectively. Each protocol was repeated after the subject was asked to step off and then step back on the scanner table. Imaging parameters are shown in Table 1.
Susceptibility map was computed using MEDI3:
$$\chi^*(\mathbb{r}) = argmin_{\chi(r)}=\|W(e^{-i d*\chi}-e^{-i \delta_b})\|_2^2 + \lambda_1\|M_G\nabla\chi\|_1+\lambda_2\|M_{CSF}(\chi-\overline{\chi_{CSF}})\|^2_2,$$
where $$$\delta_b=b_L/B_0$$$ is the relative difference field, $$$b_L$$$ the local field, $$$B_0$$$ the main magnetic field, $$$W$$$ reflecting the data reliability, $$$d$$$ the dipole kernel, $$$\nabla$$$ the gradient , $$$W_G$$$ an edge mask, and $$$\chi_{CSF}$$$ the average of over the ventricular cerebral spinal fluid (CSF) mask $$$M_{CSF}$$$ for automatic zero referencing. The regularization parameters were $$$\lambda=10^{-3}$$$ and $$$\lambda_2=10^{-1}$$$. A Matlab implementation of the QSM reconstruction code can be freely downloaded at https://med.cornell.edu/mri.
Data analysis
For each subject, the first 10 echo acquisition at 3T was set as the reference for image registration and magnitude images were registered using the FSL-FLIRT4. An experienced neuroradiologist segmented the regions of interest (ROI): Caudate Nucleus (CN), Putamen (PU), Globus Pallidus (GP), Substantia Nigra (SN), Red Nucleus (RN), Splenium of Corpus Callosum (SCC) and Dentate Nucleus (DN). The mean over each ROI and their average and standard deviation across scans were recorded to assess the reproducibility of the susceptibility mapping method.
Magnitude and phase signal to noise ratio (SNR) was measured in each subject by drawing two a signal ROI in the posterior horn of the right lateral ventricle, and a noise ROI was drawn within the air posterior to the head on the most inferior slice of the imaging volume.
QSM image quality was assessed by an experienced neuroradiologist blinded from imaging parameters using a three 3 point scale: 1=excellent contrast, with deep gray matter nuclei and white-gray matter contrast well visualized), 2=diagnostic (moderate white-gray matter contrast), 3=undiagnostic.
Reproducibility of QSM and image quality was assessed using correlation/Bland-Altman analysis and Wilcoxon rank sum test, respectively.
Results
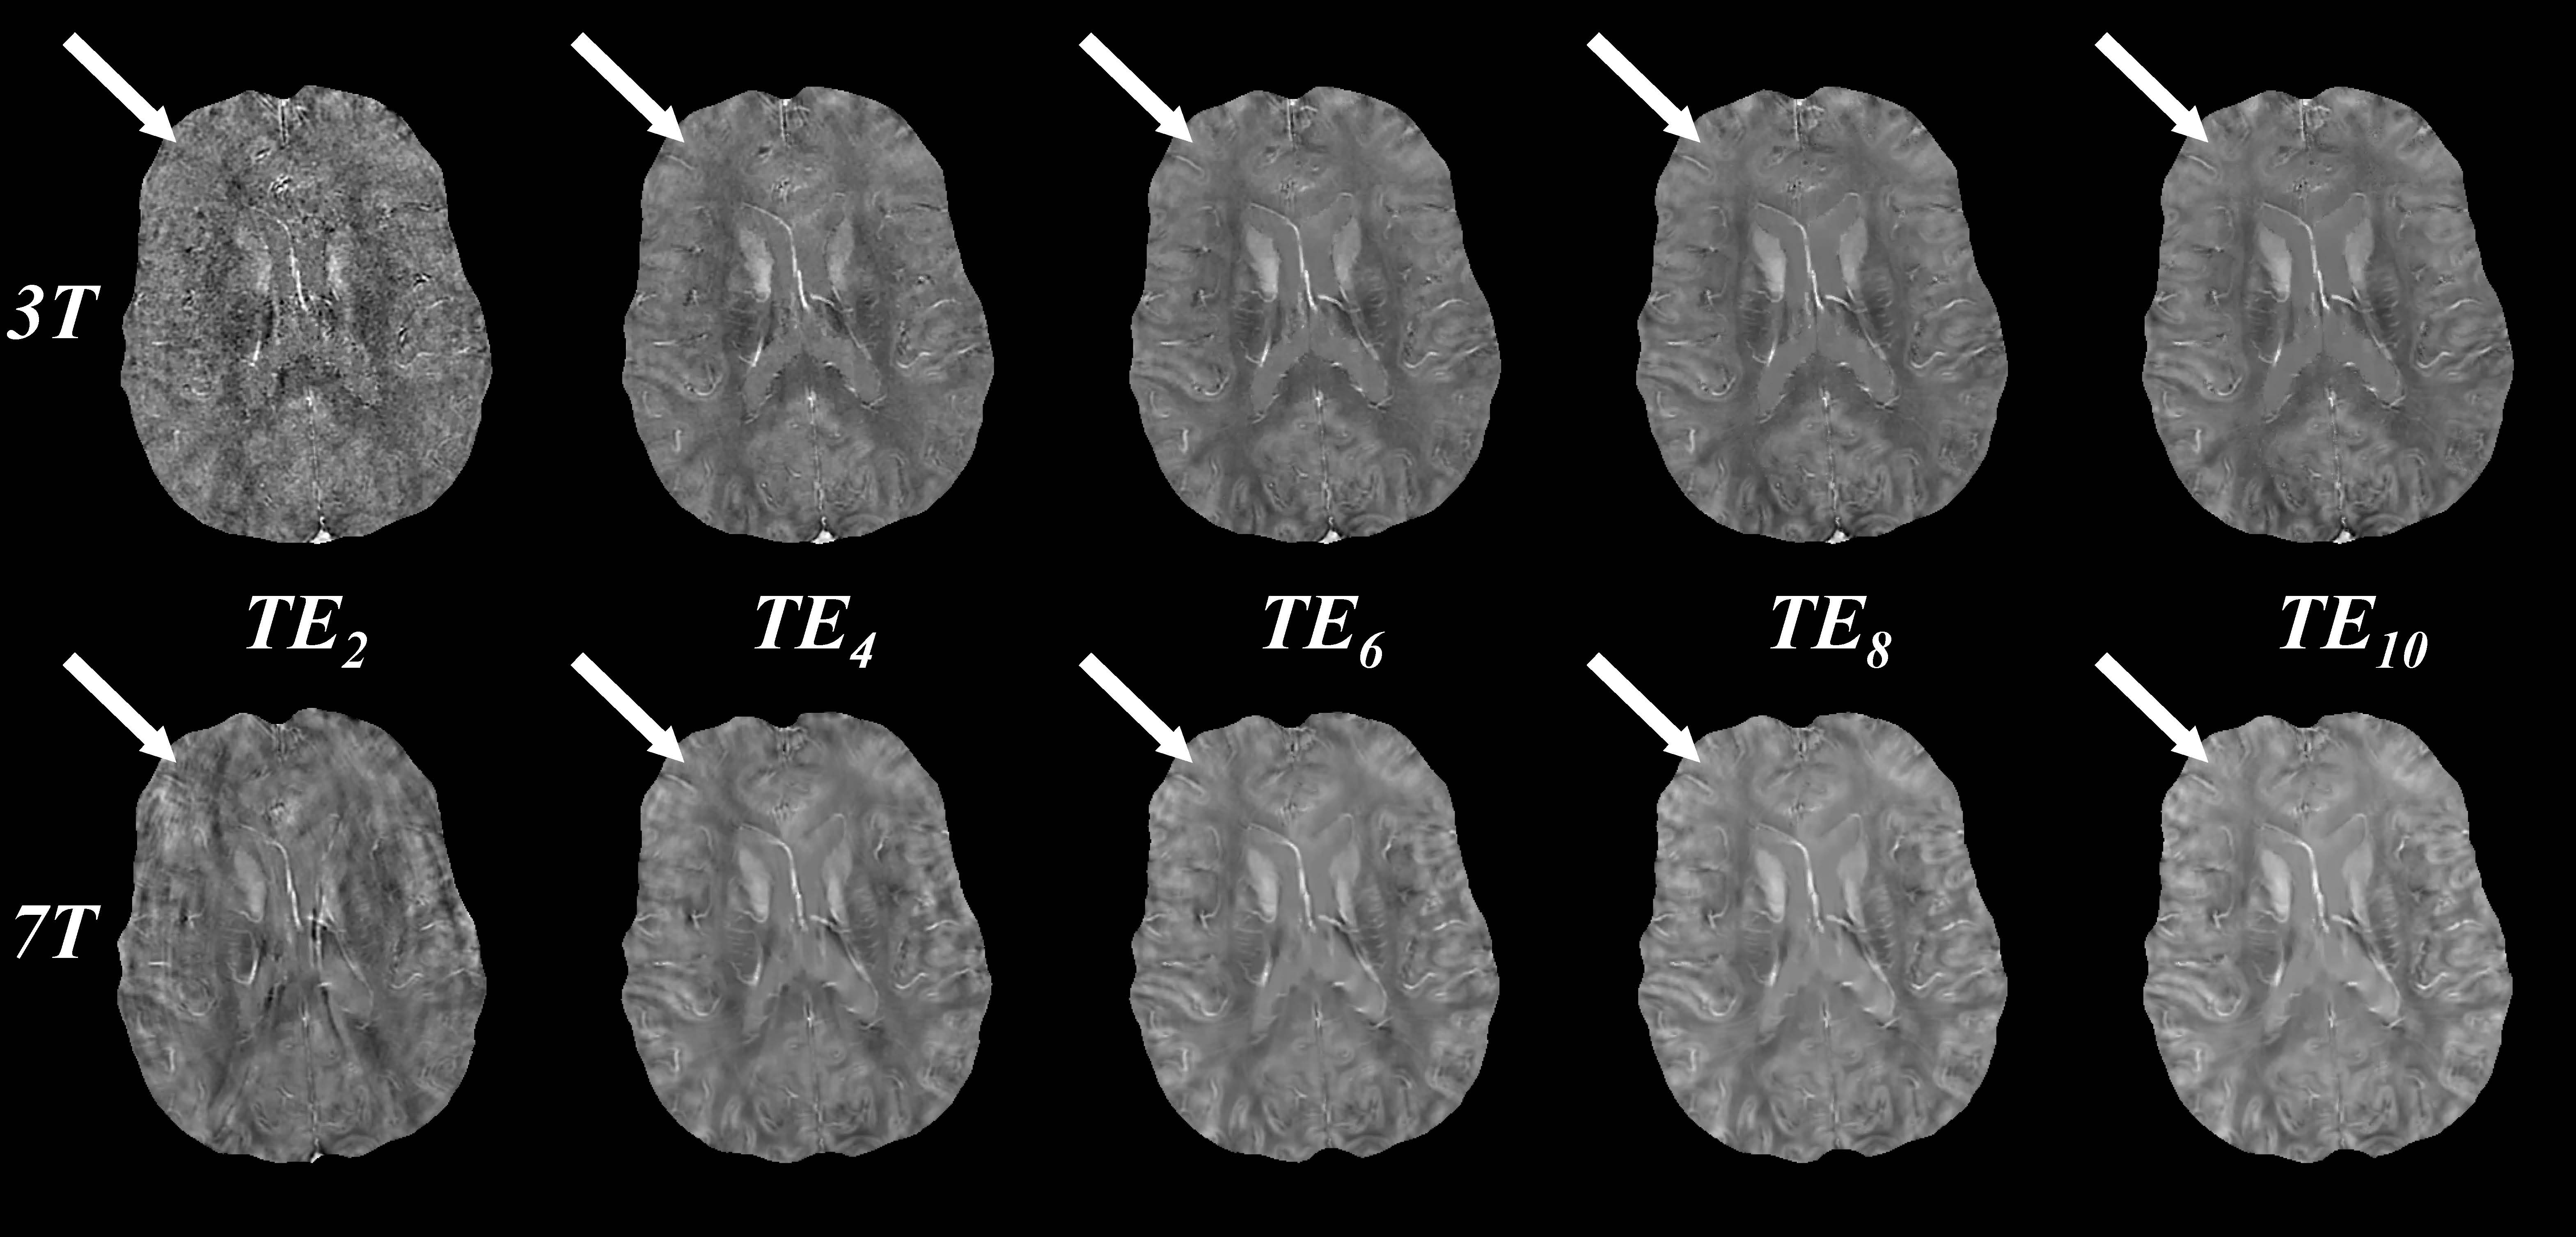
Figure 1 shows QSM at both 3T and 7T using the first 2, 4, 6, 8, and 10 echoes. Using the first two echoes, QSM quality at 3T is visually worse than at 7T, with the latter having lower apparent noise. QSM quality is increased by including more echoes. At 3T, subtle improvement in the contrast between gray and white matter susceptibility is observed up to 10 echoes (top, arrows). At 7T, QSM quality, including gray and white matter contrast, is largely similar between 6 and 10 echoes (bottom, arrows).Average magnitude SNR was 73.2 for 3T compared to 162.4 for 7T (ratio 2.2) Average phase SNR was 6.1 and 19.3 (ratio 3.2).
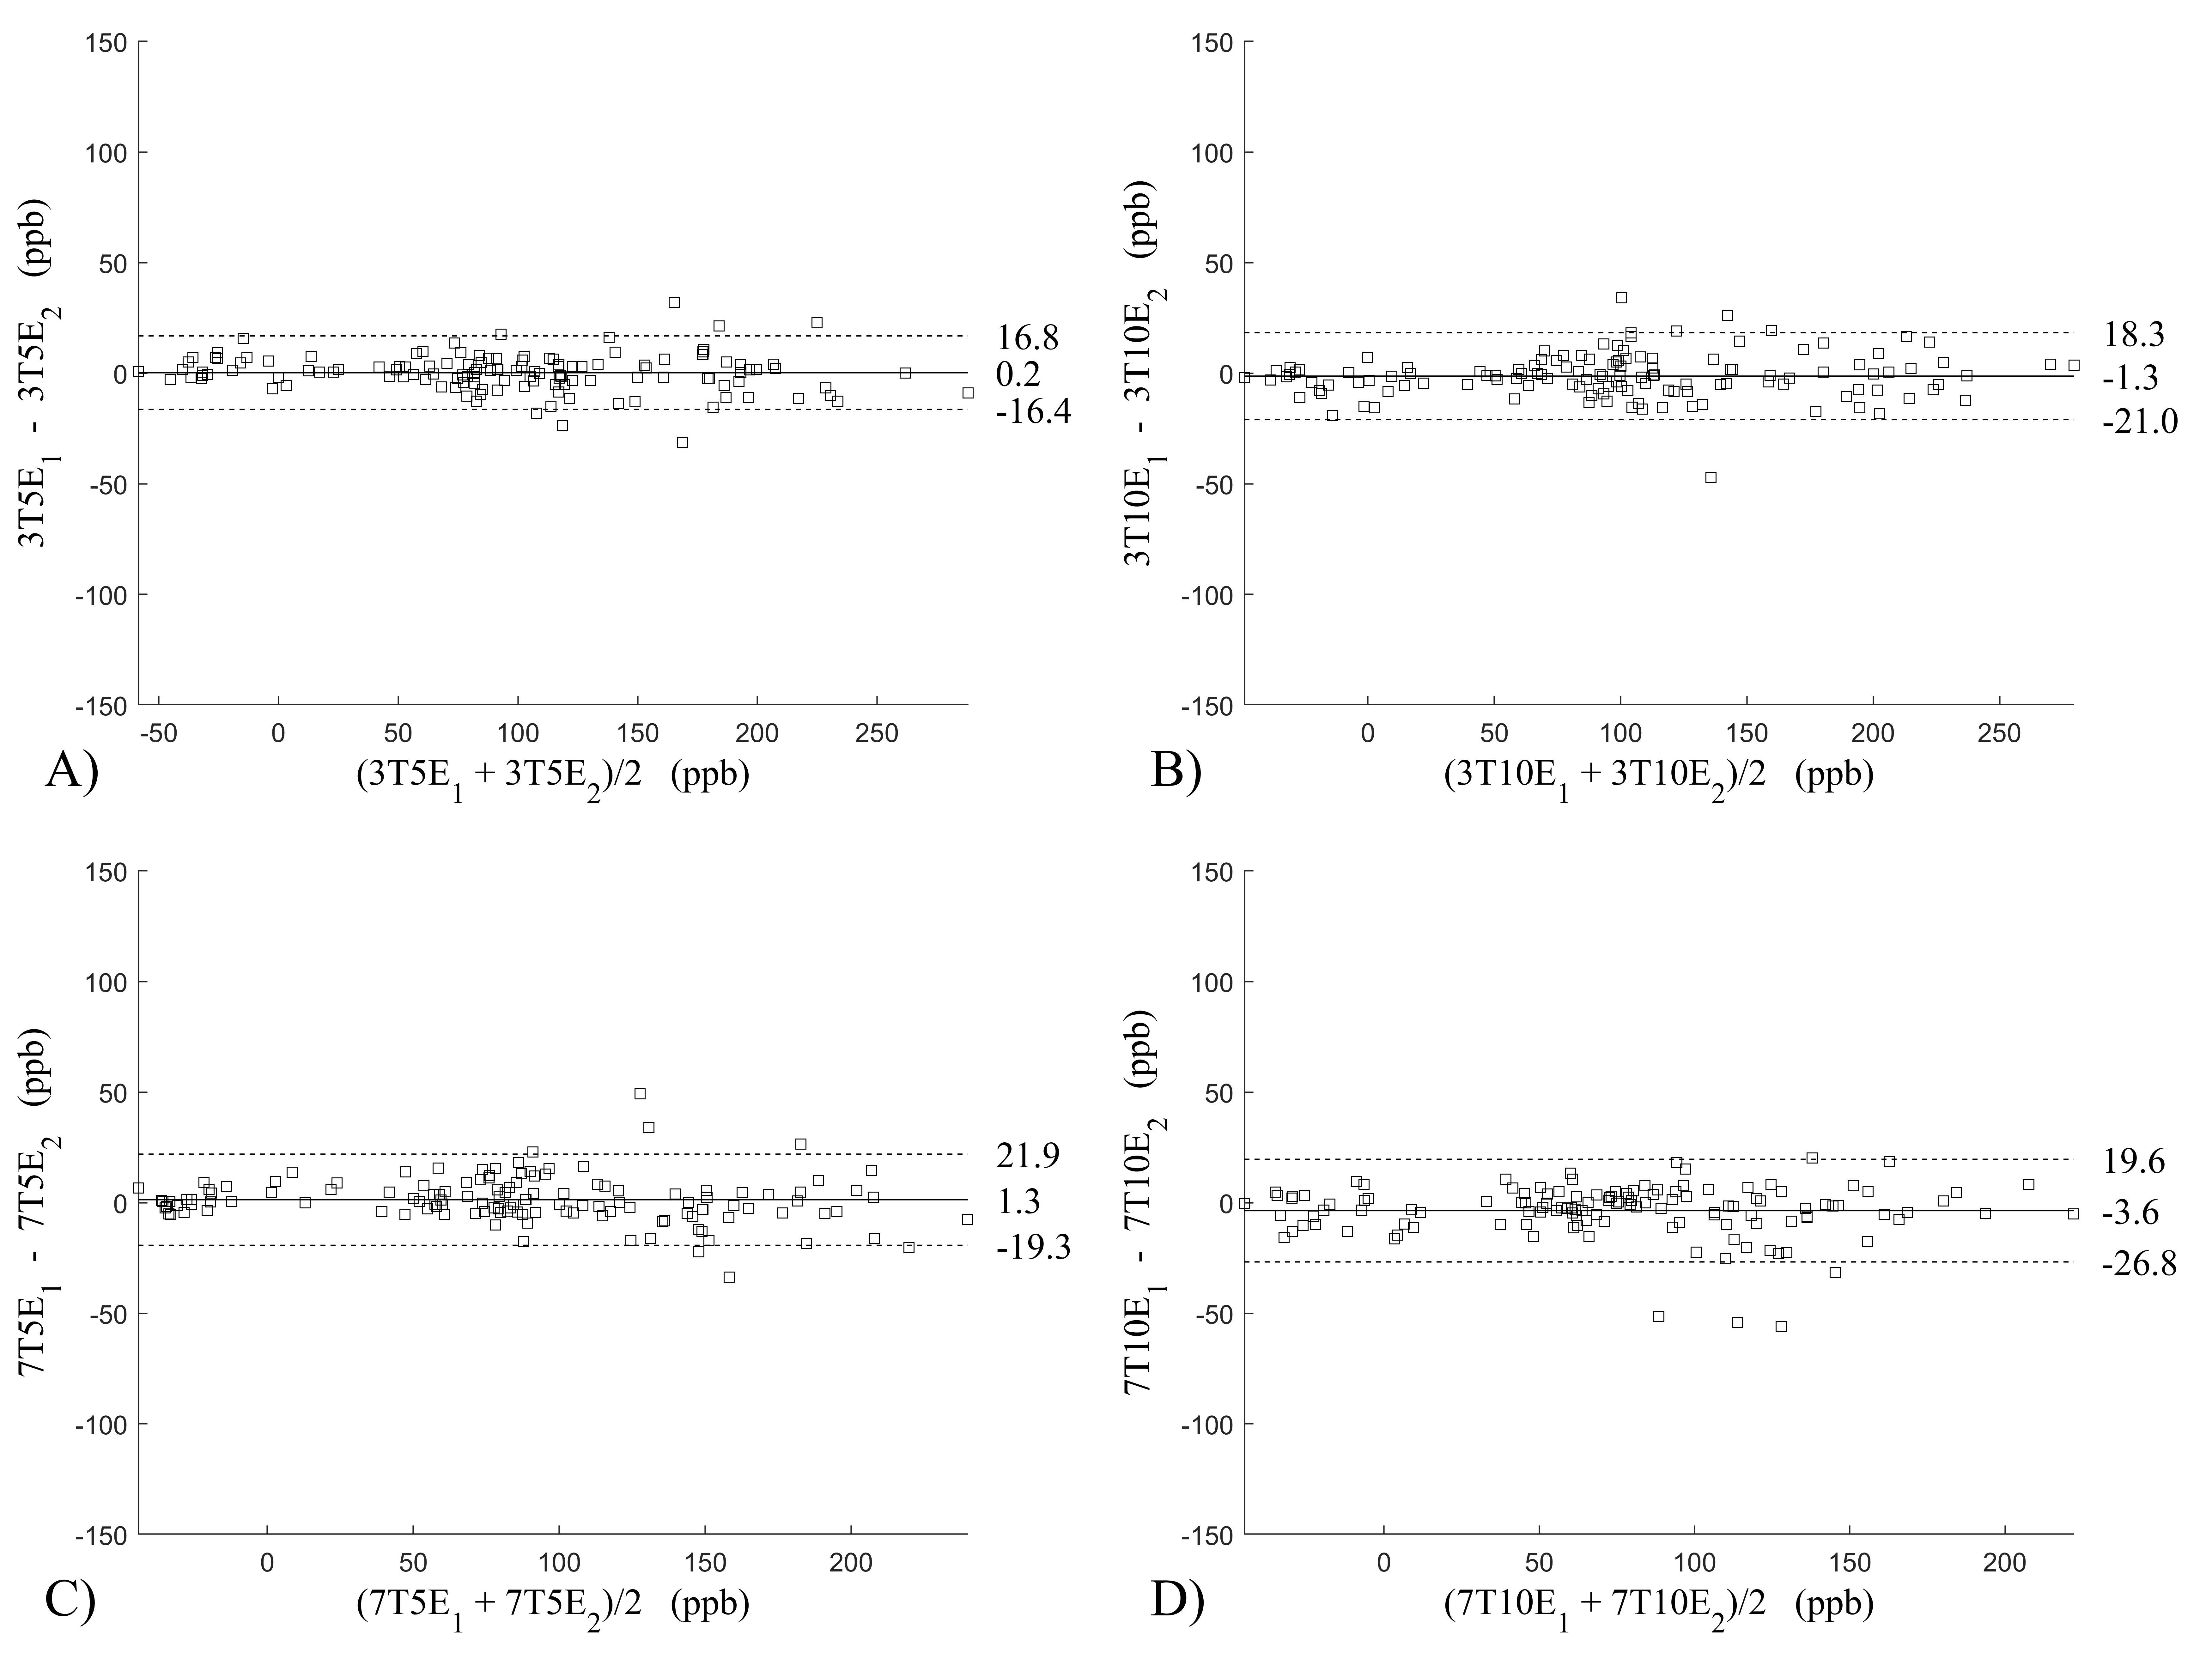
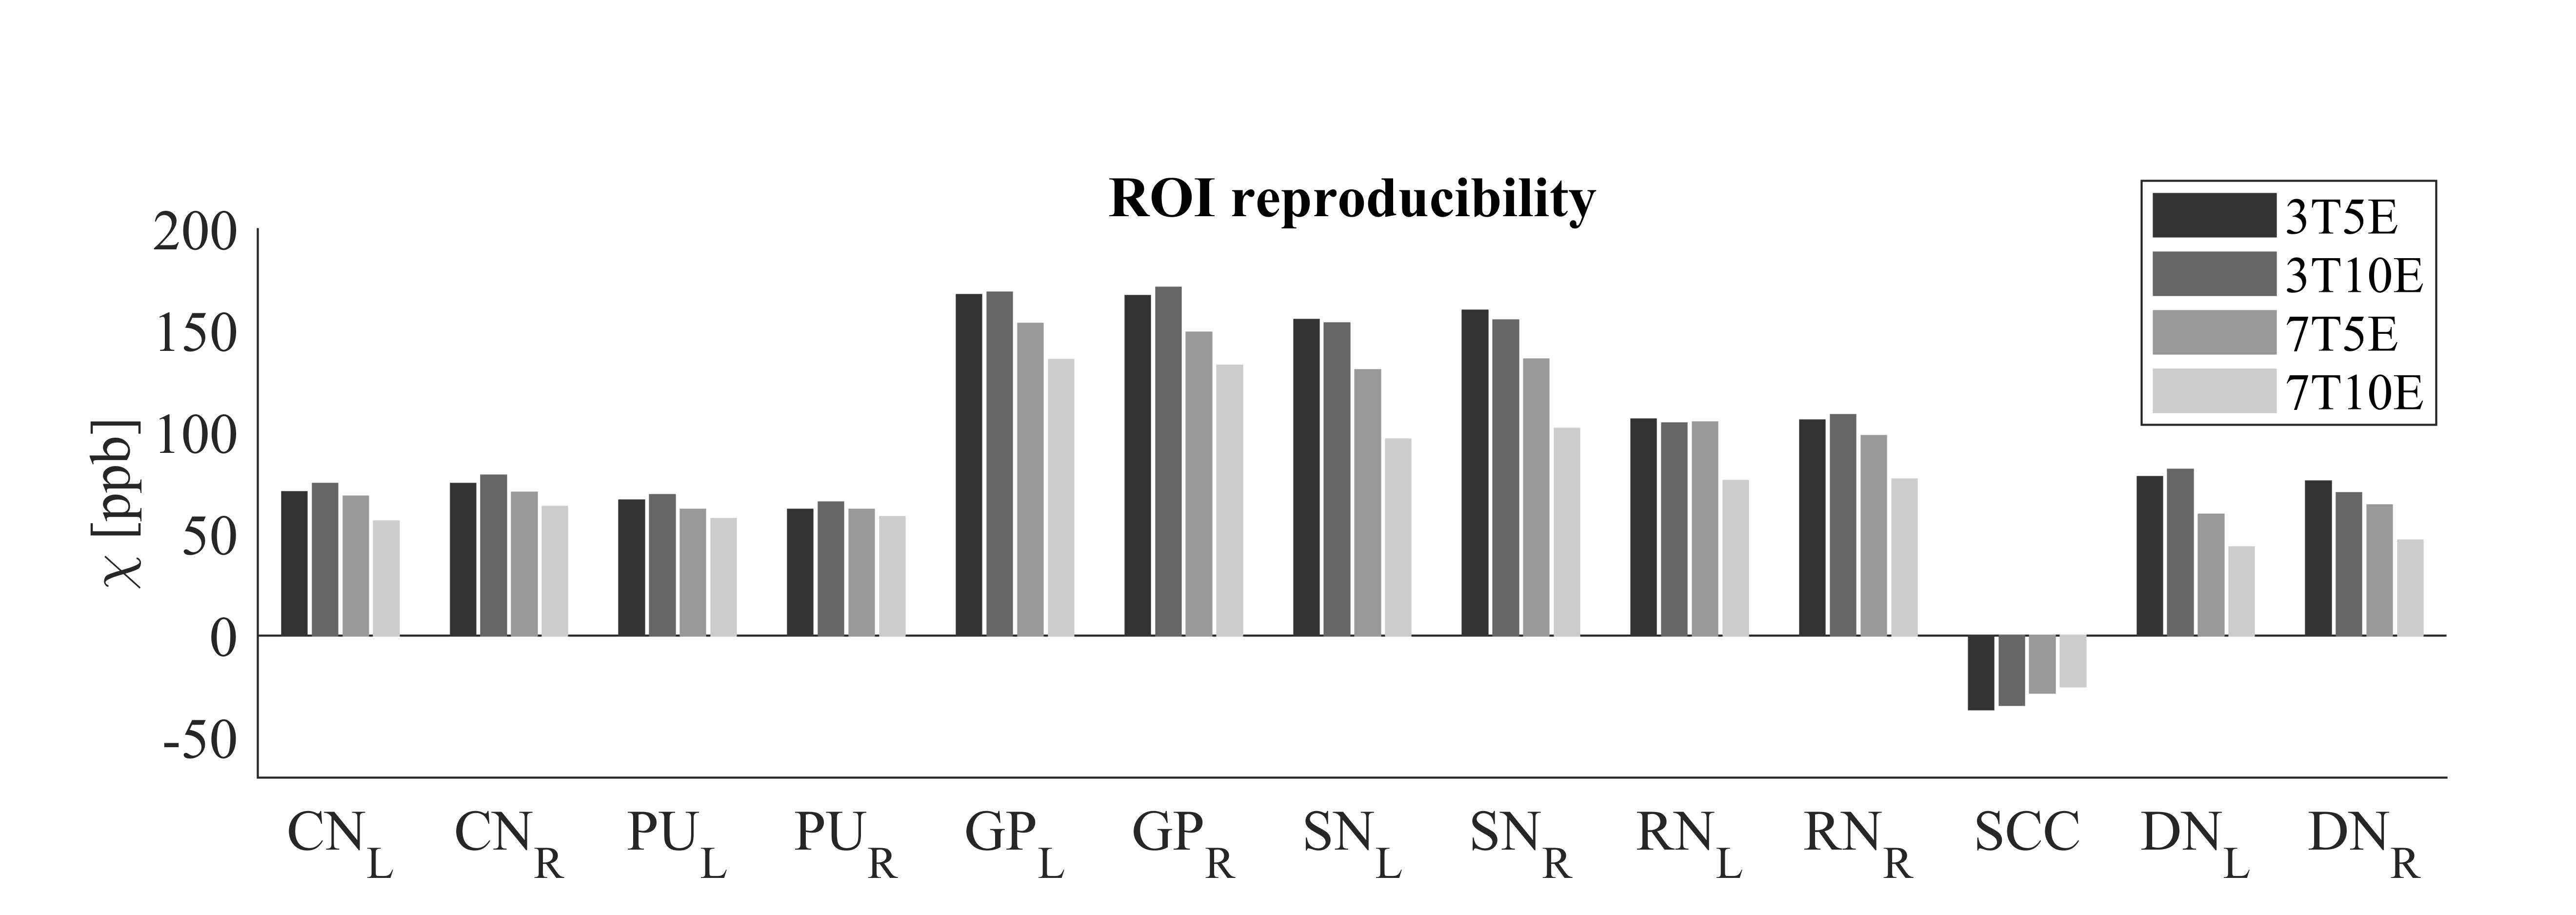
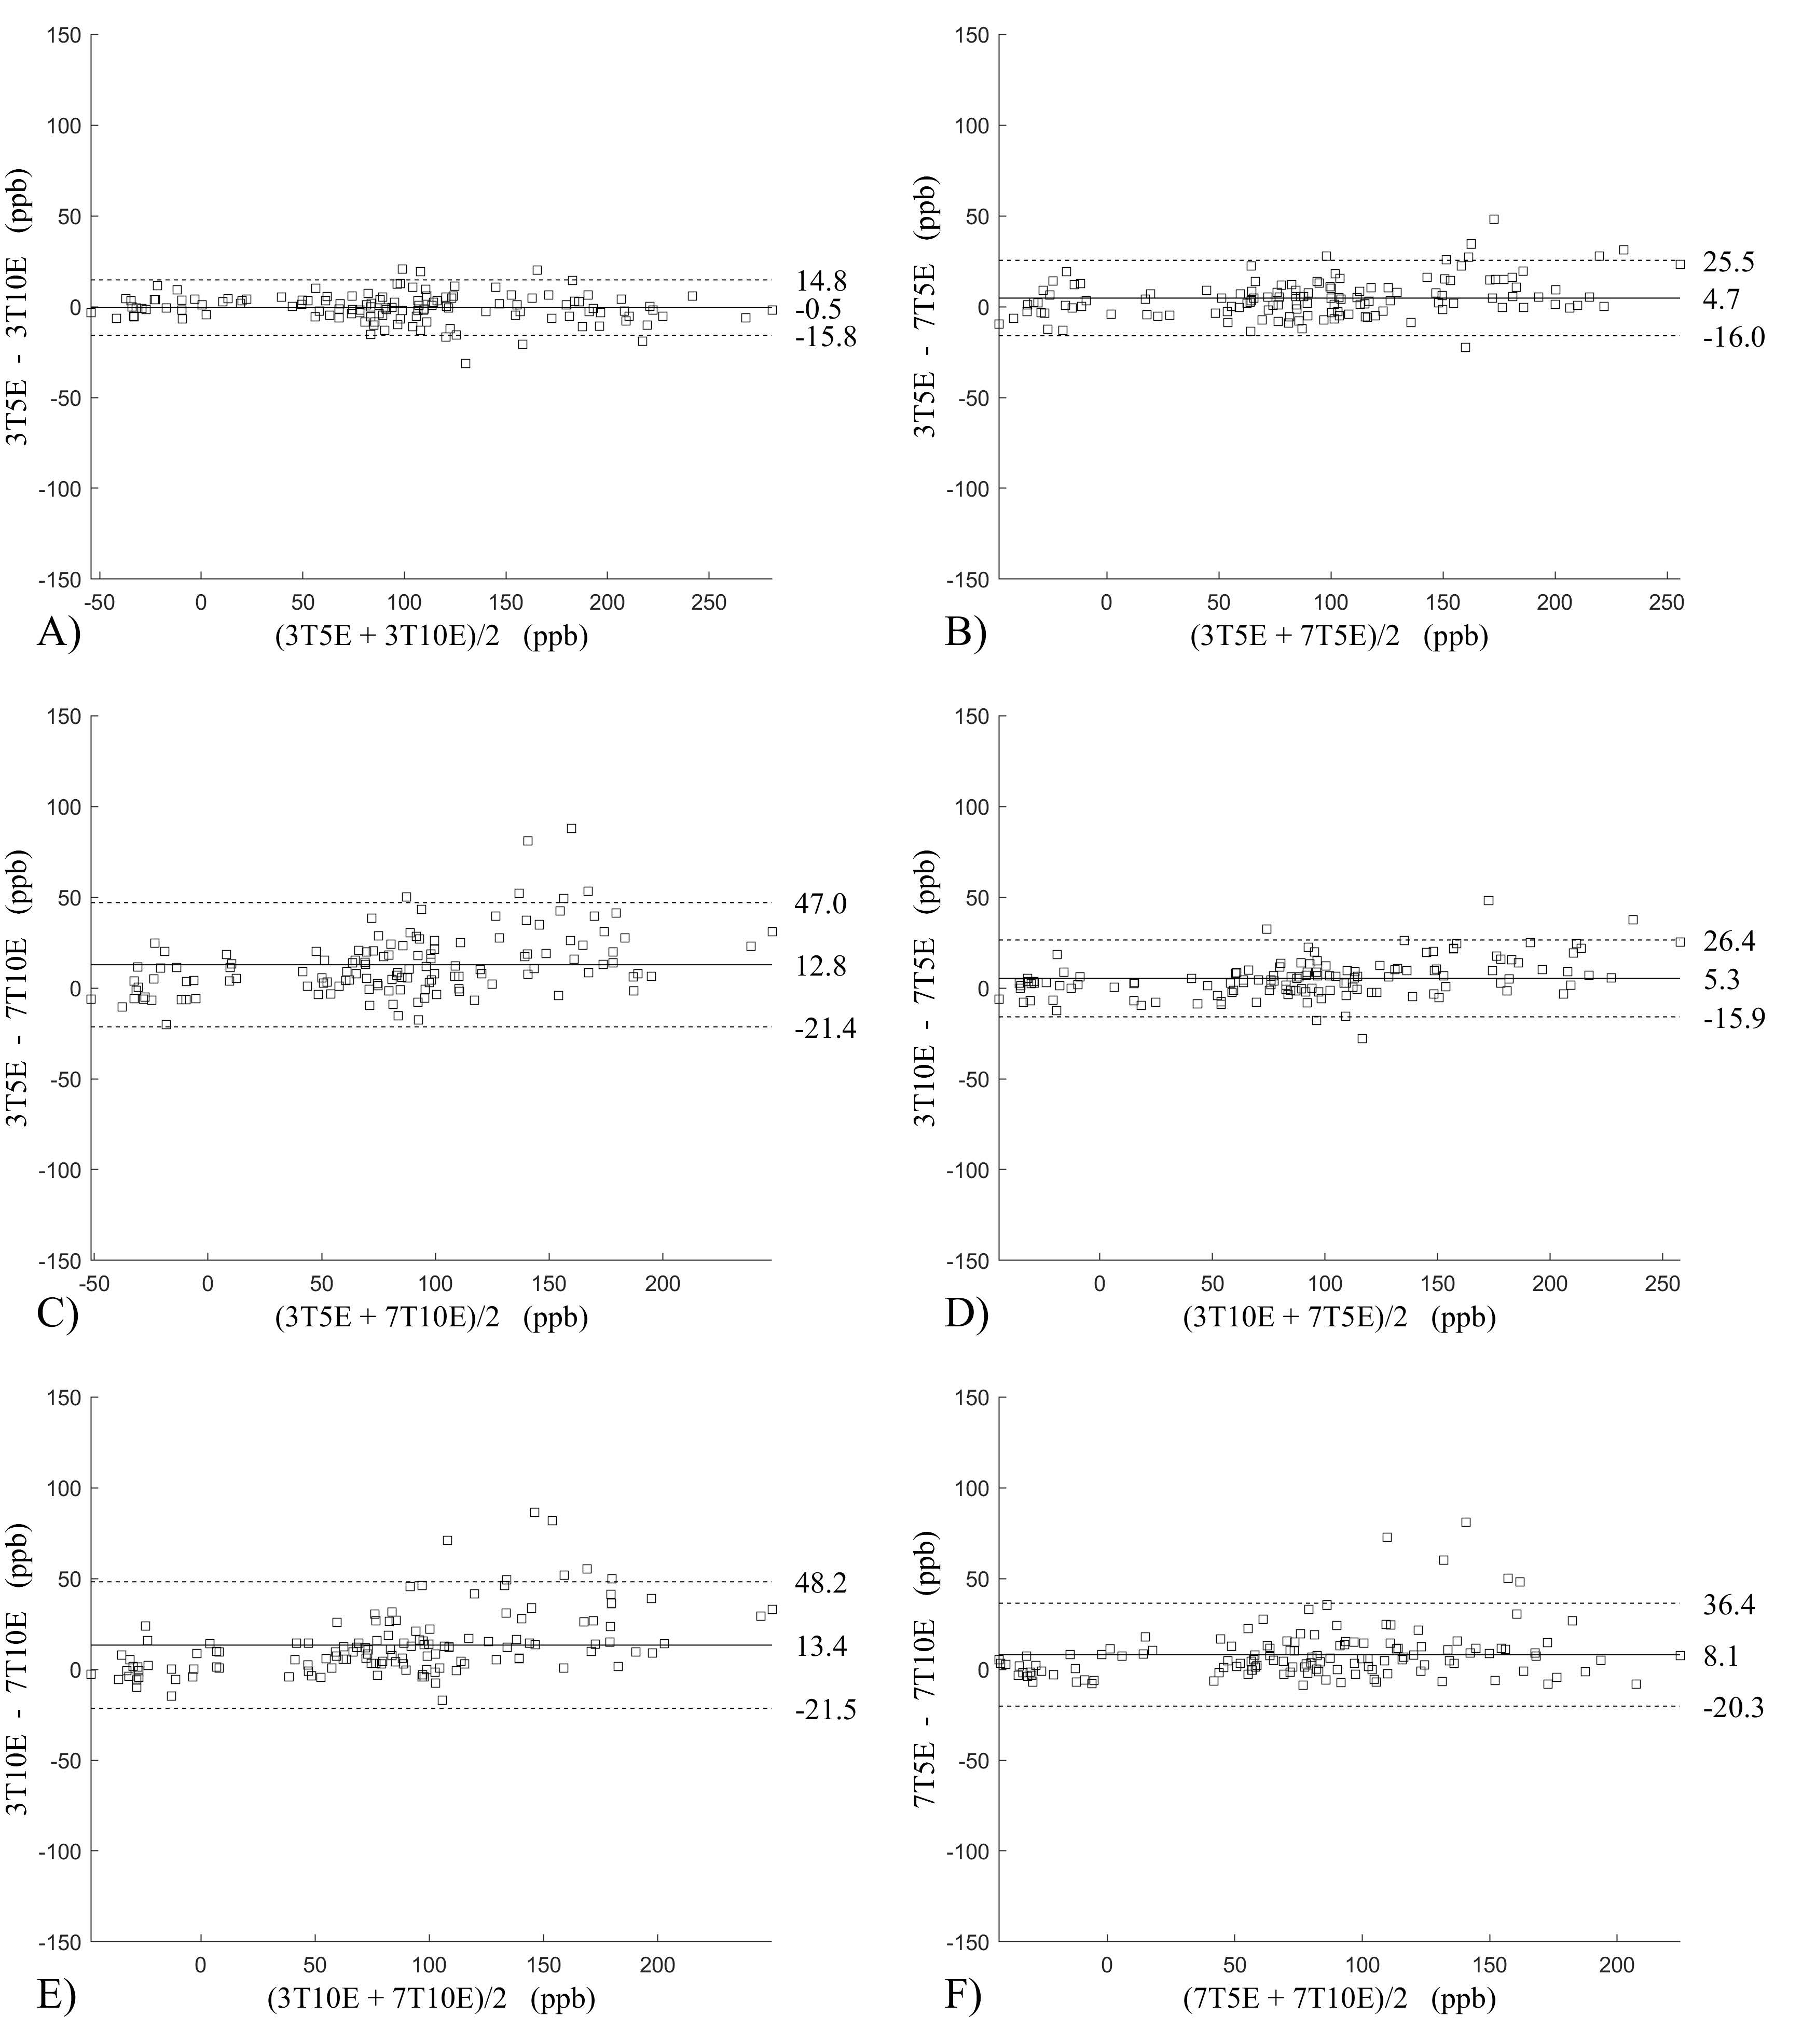
Figure 2 shows the Bland-Altman analysis for fixed field strength and echoes. Absolute bias was between 0.2ppb and 3.6ppb and limits of agreement (LOA), between ±16.6ppb and ±23.2ppb around the bias . The corresponding regression analysis shows slopes between 0.94 and 1.01 and R2>0.85. Figure 3 shows that ROI values were similar between the 3T 5 echoes, 3T 10 echoes and 7T 5 echoes, with lower values for 7T 10 echoes. Figure 4 shows the Bland-Altman analysis across field strengths and echoes showing a bias less than 13.4ppb between any pair of acquisitions. Similarly, good correlation between acquisitions was observed with R2>0.8.
The image quality score for 3T 5 echoes was 3.0±0.0 and 3.0±0.0(test/retest, p=1.00), for 3T 10 echoes 1.30±0.48 and 1.10±0.32(test/retest, p=0.30), for 7T 5 echoes 1.20±0.42 and 1.50±0.53(test/retest, p=0.19), for 7T 10 echoes 1.90±0.74 and 1.80±0.42(test/retest, p=0.82). The image quality for 3T 10 echoes was not statistically significantly different from 7T 5 echoes(p=0.65).
Discussion and Conclusion
QSM reconstructed from 5 echoes at 7T was similar to that from a long echo train at 3T (10 echoes). QSM was reproducible within fixed field strength when the same number of echoes were used. Across field strengths and with different numbers of echoes, acceptable levels of reproducibility were achieved between the 3T acquisition with 10 echoes and the 7T acquisition with 5 echoes. The preliminary data suggest that 7T can be used to shorten QSM acquisition time or enable higher resolution QSM in clinically acceptable scan times.Acknowledgements
This work was supported by the NIHReferences
1. Ladd ME, Bachert P, Meyerspeer M, et al. Pros and cons of ultra-high-field MRI/MRS for human application. Prog Nucl Magn Reson Spectrosc 2018;109:1-50. 2.
2. Barisano G, Sepehrband F, Ma S, et al. Clinical 7 T MRI: Are we there yet? A review about magnetic resonance imaging at ultra-high field. Br J Radiol 2019;92:20180492
3. Liu Z et al MEDI+0: Morphology enabled dipole inversion with automatic uniform cerebrospinal fluid zero reference for quantitative susceptibility mapping. Magn Reson Med 2018;79:2795-803
4. Jenkinson M, Beckmann CF, Behrens TE, et al. Fsl. Neuroimage 2012;62:782-90.
Figures