1750
Evaluating brain MRE optimal conditions at low and high excitation frequencies1Univ. Paris Saclay, IR4M Laboratory, Orsay, France, 2Institut du Cancer de Montpellier, ICM, Montpellier, France, 3INSERM, IMIV Laboratory, Orsay, France
Synopsis
Mechanical parameters may be underestimated by MR-Elastography if data
quality is not properly monitored to discarded inaccurate and unprecised biased
data. Optimal condition defined by proper spatial data sampling upon λ/a≈[6;9] can
alleviate the quality requirements by lowering Qthreshold, which is defined on each dataset at the drop
of correlation between the quality factor and the targeted mechanical parameters.
Introduction
Brain Magnetic Resonance Elastography is usually performed in humans with 3 mm isotropic voxels at low mechanical excitation frequency, between 40 Hz and 60 Hz, to ease wave propagation deep inside the organ. Reported overall mean shear elasticity modulus expectedly increased from 2 kPa at 40 Hz to 2.5 kPa at 60 Hz [1] [2]. Yet, MRE quantitation is highly conditioned by data quality and sampling as 6 to 9 voxels per wavelength were found optimal in isotropic and homogeneous media to produce valid mechanical parameters [3]. Here, comparative low and high frequency whole brain MRE was investigated voxel-by-voxel to analyse brain MRE optimal conditions by evaluating the required data quality factor Q and the optimal data sampling λ/a.Methods
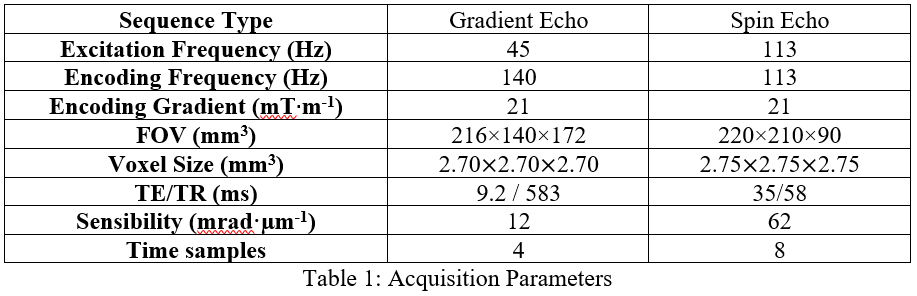
Shear waves were generated in the brain at 45 Hz and 113 Hz by pressure waves guided into the buccal cavity [4]. Displacement fields were acquired for the same volunteer in a 1.5 T Achieva system (Philips, Best, Netherlands) with parameters reported in Table 1.Maps of shear dynamic and loss moduli, Gd and Gl, were extracted from the three motion-encoding directions by inversion of the Helmoltz equation of the rotational displacement field, q. T1-weighted image was used as anatomical reference and was segmented with SPM12 (UCL, United-Kingdom) to infer masks of grey and white matters after removal of CSF, bone and background tissue. Computed maps were spatially-normalized. Data quality maps, Q=q/Δq, were calculated according to [4]. Correlation coefficients, R45 Hz and R113 Hz, between Q and Gd, were calculated to quantify the alteration of the mechanical outcomes with Q, first over the whole organ then for Q-bins of n voxels (n=1000). The correlation coefficients were plotted versus Q and exponentially fitted for 1000 to determine a quality threshold, Qthreshold, beyond which the correlation approaches zero. Finally, the shear dynamic and loss moduli, Gd and Gl were evaluated only for voxels which quality was above Qthreshold.
Results
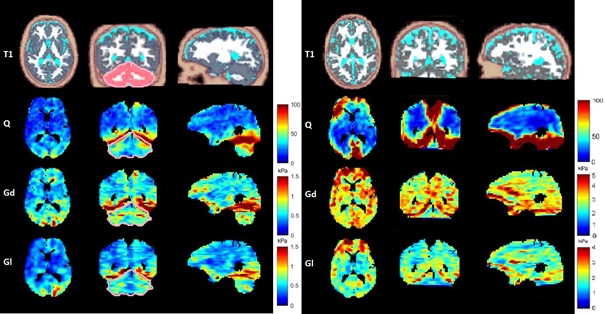
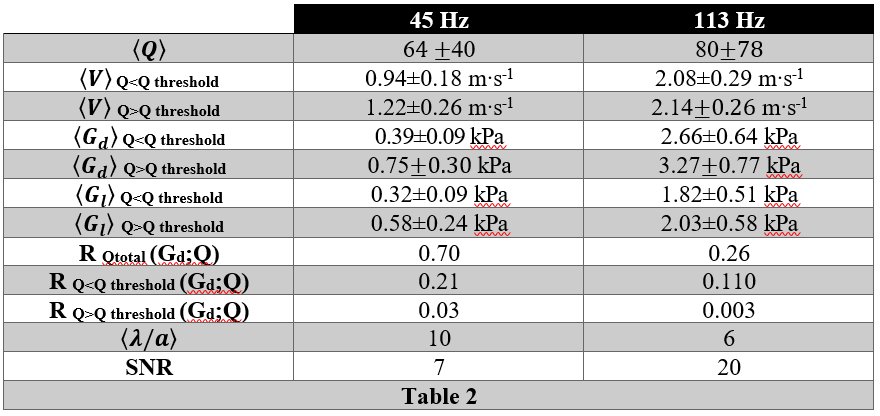
MRE SNR are 7 at 45 Hz and 20 at 113 Hz. Q, Gd, and Gl maps are represented for one of the slices along the three directions on Fig. 1. Mean Q is higher at 113 Hz than at 45 Hz (Fig.1 and Table 2). At both frequencies, maximal values were found at the 2 mm thick tentorial surface of the cerebellum (where Q values also reach maximal values) [5]. Elsewhere, Q is rather homogenous at 45 Hz whereas at 113, despite much higher values at the periphery of the cerebral hemispheres and cerebellum, Q falls down deep inside the brain. Mean V, Gd and Gl increase with the frequency excitation according to the values reported in Table 2.Discussions
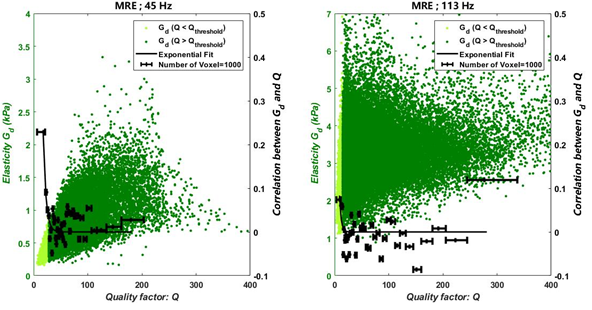
The mean coefficient correlation between Q and Gd shows that Gd is highly correlated to Q at 45 Hz (R45Hz=0.70), whereas, at 113 Hz, it remains rather immune to Q inhomogeneity (R113Hz=0.26). The correlation curve between Gd and Q shows that it is possible to define a Qthreshold of 28 for data at 45 Hz which discriminates data with a mean correlation of 0.21 below the Qthreshold and 0.03 above. A 113 Hz, Qthreshold=15 and the mean correlation is 0.11 below Qthreshold and 0.003 above (Table 2). Finally, at 45 Hz the mean value of Gd for voxels above Qthreshold is (0.75±0.30) kPa and this value is underestimated for voxels below Qthreshold with (0.39±0.09) kPa. Gd and R follow the same trend at 113 Hz but the discrepancy below and above Qthreshold is less pronounced (see Table 2).Conclusions
Mechanical parameters may be underestimated by MR-Elastography if data quality is not properly monitored to discarded inaccurate and unprecised biased data. Optimal condition defined by proper spatial data sampling upon λ/a [6;9] can alleviate the quality requirements by lowering Qthreshold, which is defined on each dataset at the drop of correlation between the quality factor and the targeted mechanical parameters.Acknowledgements
MRE experiments were performed on the 1.5 T MRI platform of CEA/SHFJ, affiliated to the France Life Imaging network (grant ANR-11-INBS-0006).References
[1] I. Sack, K.-J. Streitberger, D. Krefting, F. Paul, et J. Braun, « The Influence of Physiological Aging and Atrophy on Brain Viscoelastic Properties in Humans », PLoS ONE, vol. 6, no 9, p. e23451, sept. 2011.
[2] K. M. Pepin et al., « Magnetic resonance elastography analysis of glioma stiffness and IDH1 mutation status », AJNR Am J Neuroradiol, vol. 39, no 1, p. 31‑36, janv. 2018.
[3] J. L. Yue et al., « Acquisition and reconstruction conditions in silico for accurate and precise magnetic resonance elastography », Phys. Med. Biol., oct. 2017.
[4] X. Maitre, E. Lamain, R. Sinkus, B. Louis, L. Darrasse (2011) Whole brain MRE with guided pressure waves. in 19th Annual Meeting of the International Society for Magnetic Resonance in Medicine (ISMRM) (Montréal (Canada)).
[5] Castel Jean-Pierre, « L’enveloppe ostéo-durale », Campus Numérique de Neurochirurgie, févr-2006.
[6] J. Diedrichsen, « A spatially unbiased atlas template of the human cerebellum », NeuroImage, vol. 33, no 1, p. 127‑138, oct. 2006.
Figures