1749
The Feasibility of Accelerated Brain 3D T1WI MRI Using Compressed Sensing: Qualitative and VBM validation
Yunyun Duan1, Yaou Liu1, and Jiazheng Wang2
1Beijing Tiantan Hospital, Capital Medical University, Beijing, China, 2Philips (China) Investment Co., Ltd, Beijing, China
1Beijing Tiantan Hospital, Capital Medical University, Beijing, China, 2Philips (China) Investment Co., Ltd, Beijing, China
Synopsis
A major barrier of clinical application of 3D T1 sequence is the long acquisition time. Compressed SENSE (CS-SENSE) was introduced into the clinical routine and showed reduced scan time without reduced image quality. However, automatically quantitative assessment of brain structure has not been certificated up to date. This study evaluated the different acceleration factors of CS-SENSE or SENSE of a 3D brain T1 sequence with qualitative and quantitative measurements in health volunteers and patients, in order to assess the feasibility of 3D brain structural imaging acceleration.
Abstract
Introduction: A major barrier of clinical application of 3D T1 sequence is the long acquisition time. Compressed SENSE (CS-SENSE) [1] was introduced into the clinical routine and showed reduced scan time without reduced image quality [2-6], especially with 3D sequences. However, automatically quantitative assessment such as brain volume, which is critical in the 3DT1, has not been certificated up to date. The aim of the study is to identify the optimal acceleration factor for 3D T1 images for clinical and research. We evaluated the image quality and cost efficiency of different acceleration factors of CS-SENSE (3, 4.5 and 6) or SENSE (3 and 4.5) of a 3D brain T1 sequences (tested with qualitative and quantitative measurements) in HC, MS and AD patients, compared to the standard reference 3D sequence without any accelerated technique. Methods: This single-center prospective study was approved by the institutional review board. Written informed consent was obtained from all participants. 53 subjects were recruited including 33 healthy controls (HCs), 10 multiple sclerosis (MS) patients and 10 Alzheimer's disease (AD) patients. The scan was repeated one month lateras in five HCs. A conventional 3D T1-TFE sequence with 1mm isotropic resolution (reference sequence, RS) and accelerated sequences with CS-SENSE (acceleration factor of 3, 4.5, 6, abbreviated as CS3, CS4.5,CS6) and SENSE (acceleration factor of 3, 4.5, abbreviated as SE3, SE4.5) were acquired for all participants on a 3.0-Testla MR system (Ingenia CX , Philips Healthcare, Best, the Netherlands) (Table1). Qualitative measures including visual assessment of the overall image quality, visual signal noise ratio (SNR), image contrast, lesion boundary sharpness, motion artifact and image artifacts were assessed by two blinded to the MR technique independently, and then in consensus. Quantitative image quality metrics [7] and intraclass correlation coefficients (ICC) between RS and the different accelerated sequences were performed using VBM analysis based on CAT12. The group comparisons between HC and AD or MS were performed by VBM analysis. Results: For the visual assessment in HCs, AD and MS patients, there were no significant difference in any metrics between RS and CS3 (with 65% scan time reduction). For the overall image quality, sequence CS4.5 showed no significant difference compared to RS. Visual SNR is visually reduced from CS4.5 (p<0.05), CS6 and SE3, 4.5 sequence (p<0.01). For lesion or gray-white matter boundary sharpness, CS 6 and SE 4.5 showed reduced quality (p<0.01). All the accelerated sequences showed good gray-white matter contrast. Motion artifacts mildly increased with no significance in the RS for the long scan time. For the image artifacts, only SE4.5 showed significant increased image artifacts (p<0.01). MS and AD patients group showed consistent results with HCs . Quantitative metrics, including signal-to-noise ratio (SNR) , coefficient of joint variation (CJV) , contrast-to-noise ratio (CNR) and entropy-focus criterion (EFC) and FBER, showed significant decrease trend from the RS to SE4.5(p<0.001, FDR corrected)(Fig.2). There’s no significant difference of the SNR in the grey matter between different accelerated scan and RS. The ICC values of each accelerated scan and reference one were high (Fig.3). For the group comparisons, AD or MS patients and HCs were compared using the same acceleration factor. Each protocol can catch the most significant group differences (Fig.4). Discussion For the visual assessment, CS3 showed optimal image quality with 65% scan time reduction. Visual image quality was mainly affected by the decreased SNR (CS4.5, CS6, SE3, SE4.5), unsharp lesion boundary (CS6, SE4.5) and somewhat image artifacts (SE4.5). The ICC values of different acceleration factor with RS are really high enough. However, the ICC values slightly decreased with no significance in the regions of cerebellum, subcortical regions, periventricular area, and the temporal pole. Group difference showed higher test-retest properties using VBM. Each protocol can catch the most significant group differences. Conclusion: CS-SENSE with factor 3 can accelerates the 3D brain T1 (65% time reduction) with preserved visual image quality for radiological diagnosis. CS-SENCE with factor 3, 4.5 (65, 72% time reduction) can quantify brain volume measurements without compromising image quality.Acknowledgements
The authors thank the patients as well as healthy volunteers for participating in this study, and members of the neurology team for various supports.References
References 1. Geerts-Ossevoort L, deWeerdt E, Duijndam A, van Ijperen G, Peeters H, Doneva M, Nijenhuis M, Huang A. Compressed SENSE. Speed done right. Every time. Philips® healthcare, Netherlands. Available via https://philipsproductcontent.blob.core.windows.net/ assets/20180109/619119731f2a42c4acd4a863008a46c7.pdf. Accessed 16 May 2018. 2. Fushimi Y, Fujimoto K, Okada T, et al. Compressed sensing 3-dimensional time of flight magnetic resonance angiography for cerebral aneurysms: optimization and evaluation. Invest Radiol. 2016; 51:228–235. 3.Toledano-Massiah S, Sayadi A, de Boer R, et al. Accuracy of the compressed sensing accelerated 3D-FLAIR sequence for the detection of MS plaques at 3T. AJNR Am J Neuroradiol. 2018; 39:454–8. 4. Vranic JE, Cross NM, Wang Y, et al. Compressed sensing-sensitivity encoding (CS-SENSE) accelerated brain imaging: reduced scan time without reduced image quality. AJNR Am J Neuroradiol. 2019;40:92–8. 5. Cho SJ, Choi YJ, Chung SR, et al. High-resolution MRI using compressed sensing-sensitivity encoding (CS-SENSE) for patients with suspected neurovascular compression syndrome: comparison with the conventional SENSE parallel acquisition technique. Clin Radiol. 2019; 74(10):817.e9-817. 6. Eichinger P, Hock A, Schön S, et al. Acceleration of double inversion recovery sequences in multiple sclerosis with compressed sensing. Invest Radiol. 2019;54:319–24. 7. Dietrich O, Raya JG, Reeder SB, et al. Measurement of signal-to-noise ratios in MR images: influence of multichannel coils, parallel imaging, and reconstruction filters. J Magn Reson Imaging. 2007; 26(2):375-85.Figures
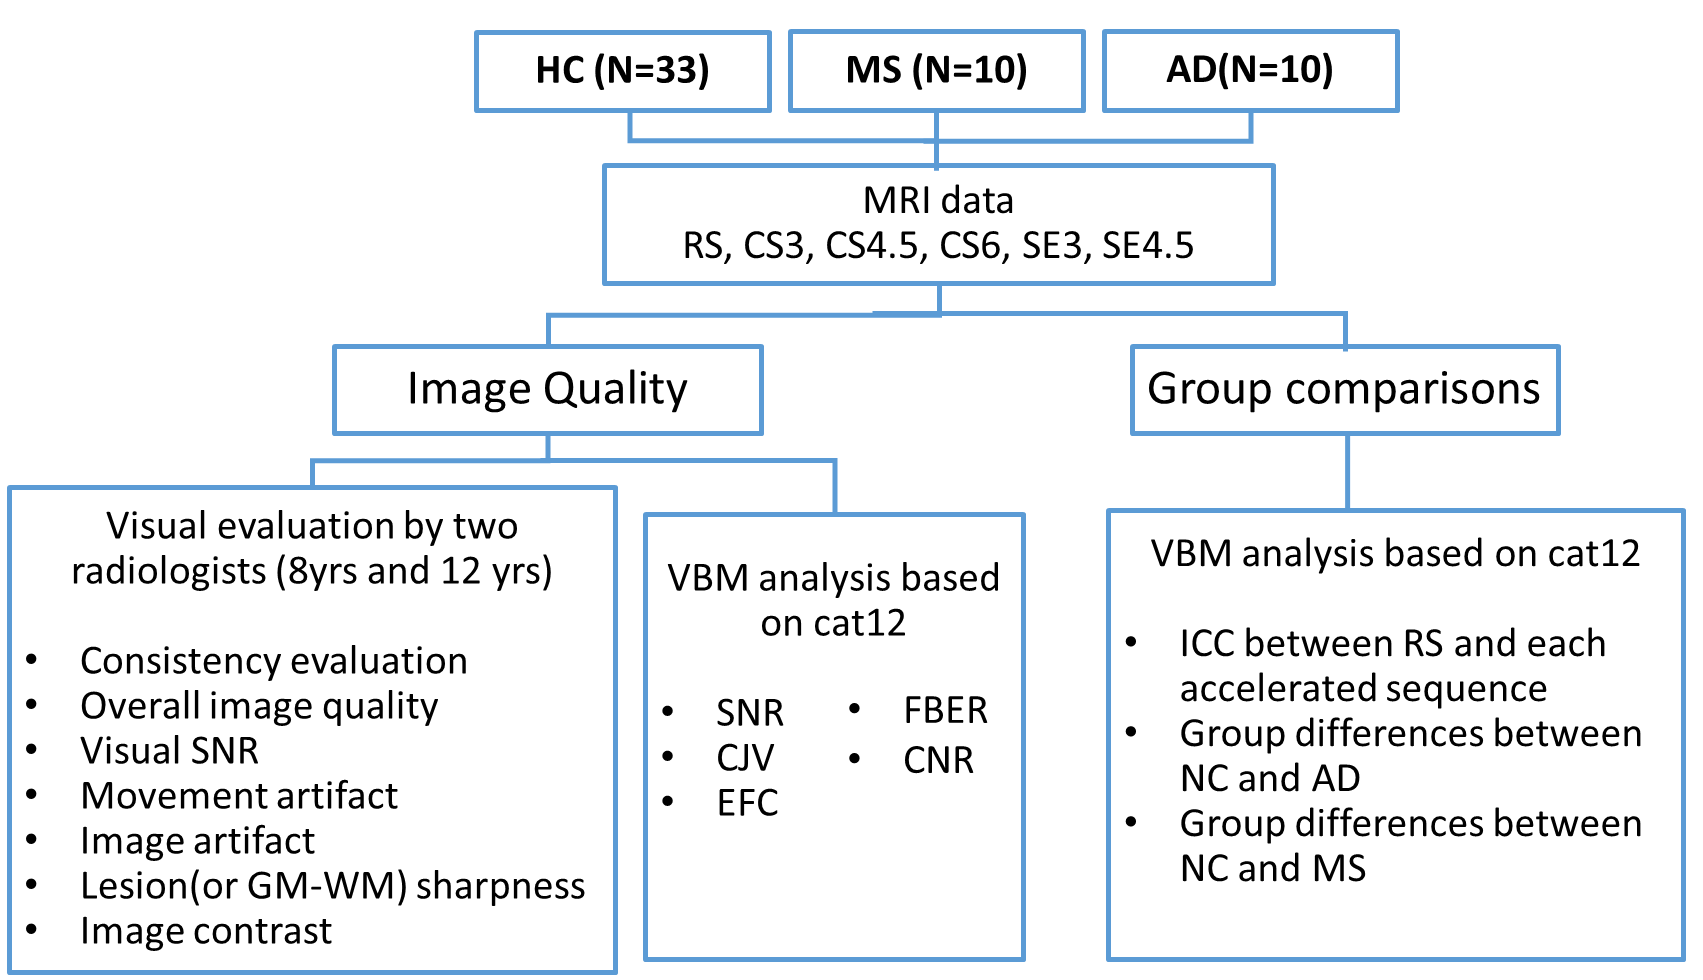
Workflow of the study design.
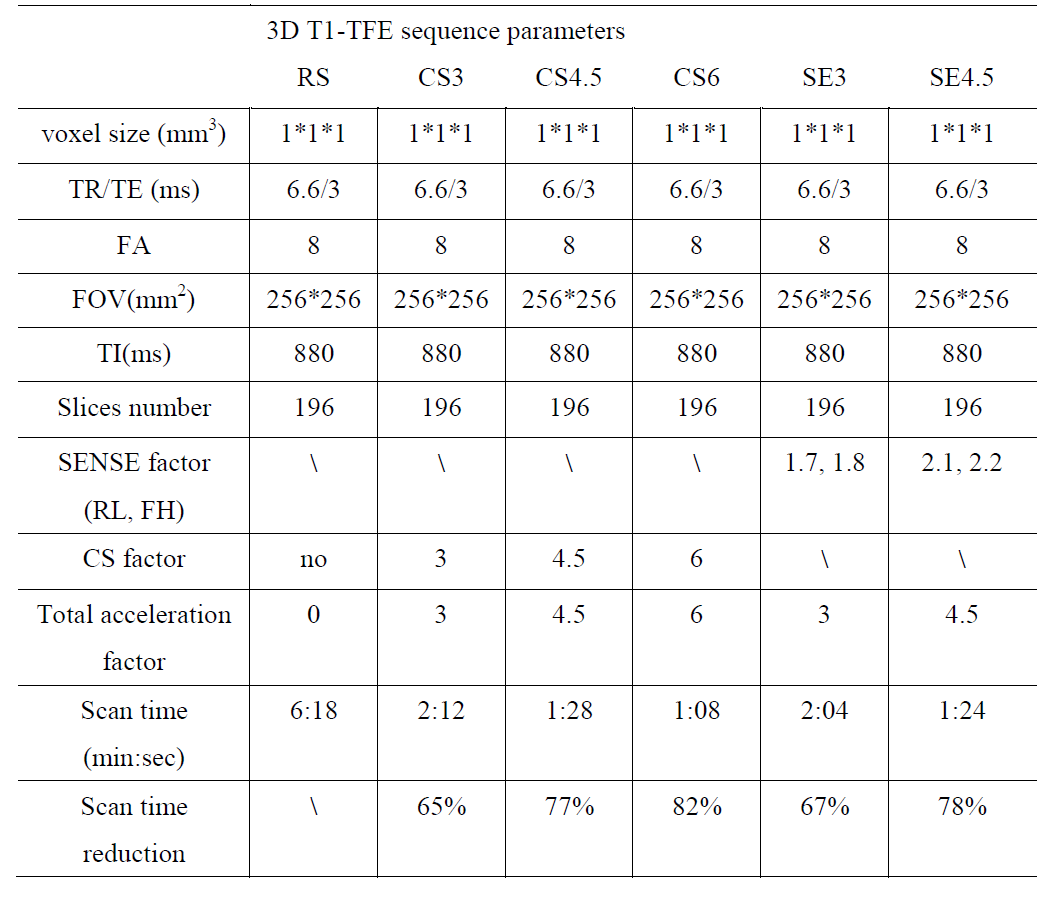
Table 1 Imaging parameters for CS-SENSE accelerated and reference
MRI sequences.
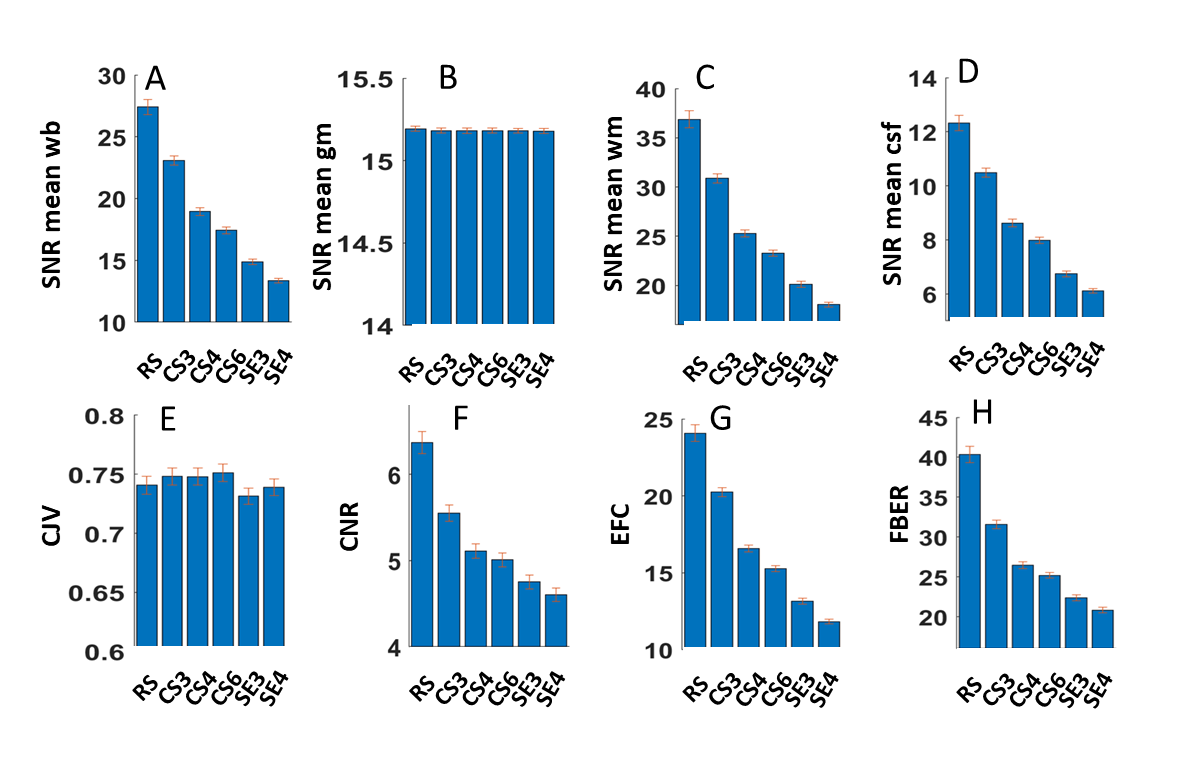
Quantitative metrics of different scan parameters.
A) SNR of the whole brain, B) SNR of the gray
matter, C) SNR of the white matter, D) SNR of the CSF, E) Coefficient of Joint
Variation of GM and WM(CJV) , F) Contrast-to-noise Ratio (CNR), G)
Entropy-Focus Criterion (EFC), H) FBER with different scan parameters. RS,
reference sequence; CS3, CS4.5, CS6, CS-SENSE accelerated sequence with factor
3, 4.5, 6; SE3, SE4.5, SENSE accelerated sequence with factor 3, 4.5.
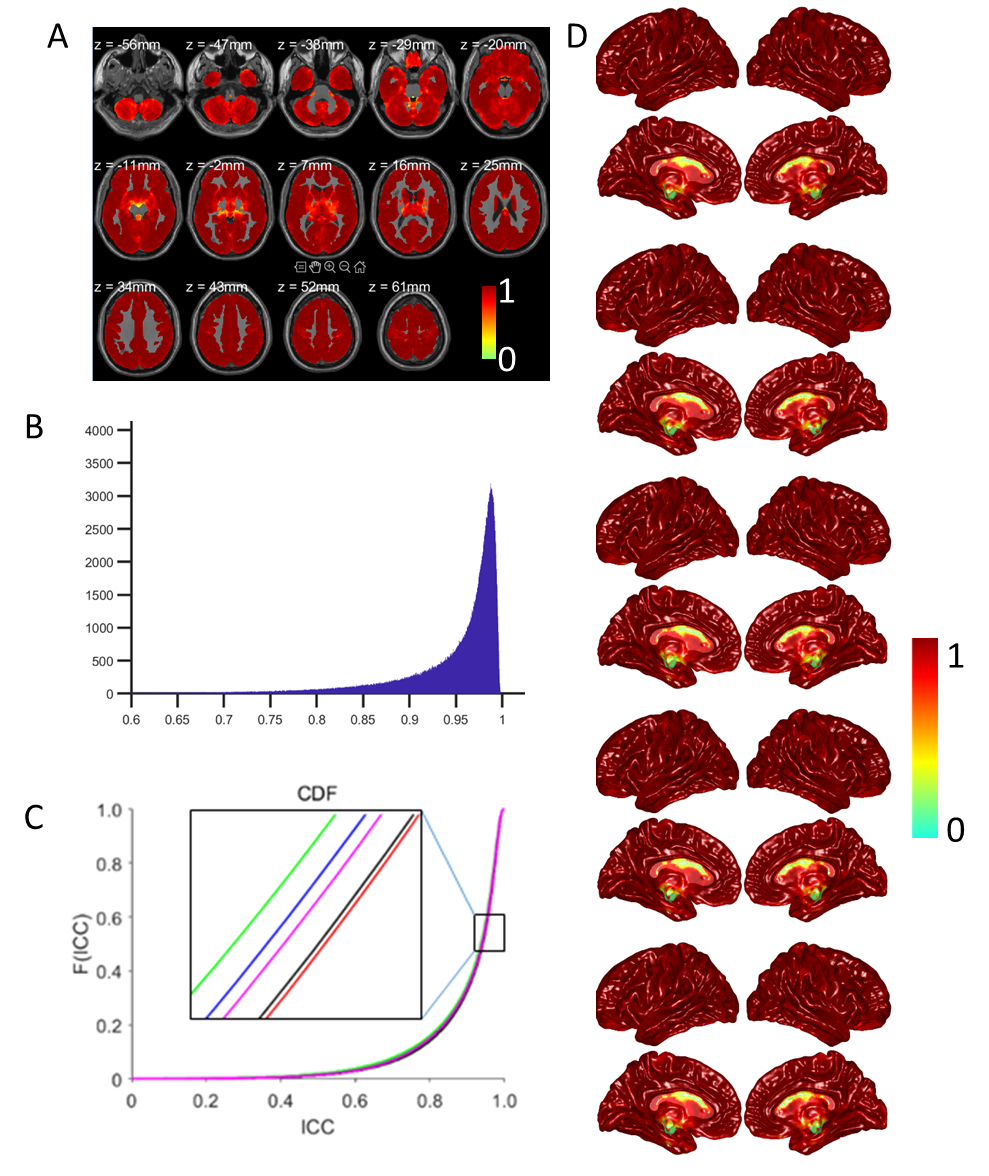
ICC value of the gray matter
volume across the six different scan parameters.
A) Slice view of the ICC value of the gray matter volume. B) ICC
distribution of the ICC in A. C) CDF plot of the ICC value between the reference
sequence and other accelerated scan parameters. D) Brain map of the ICC values
within normal controls at each scan parameter.
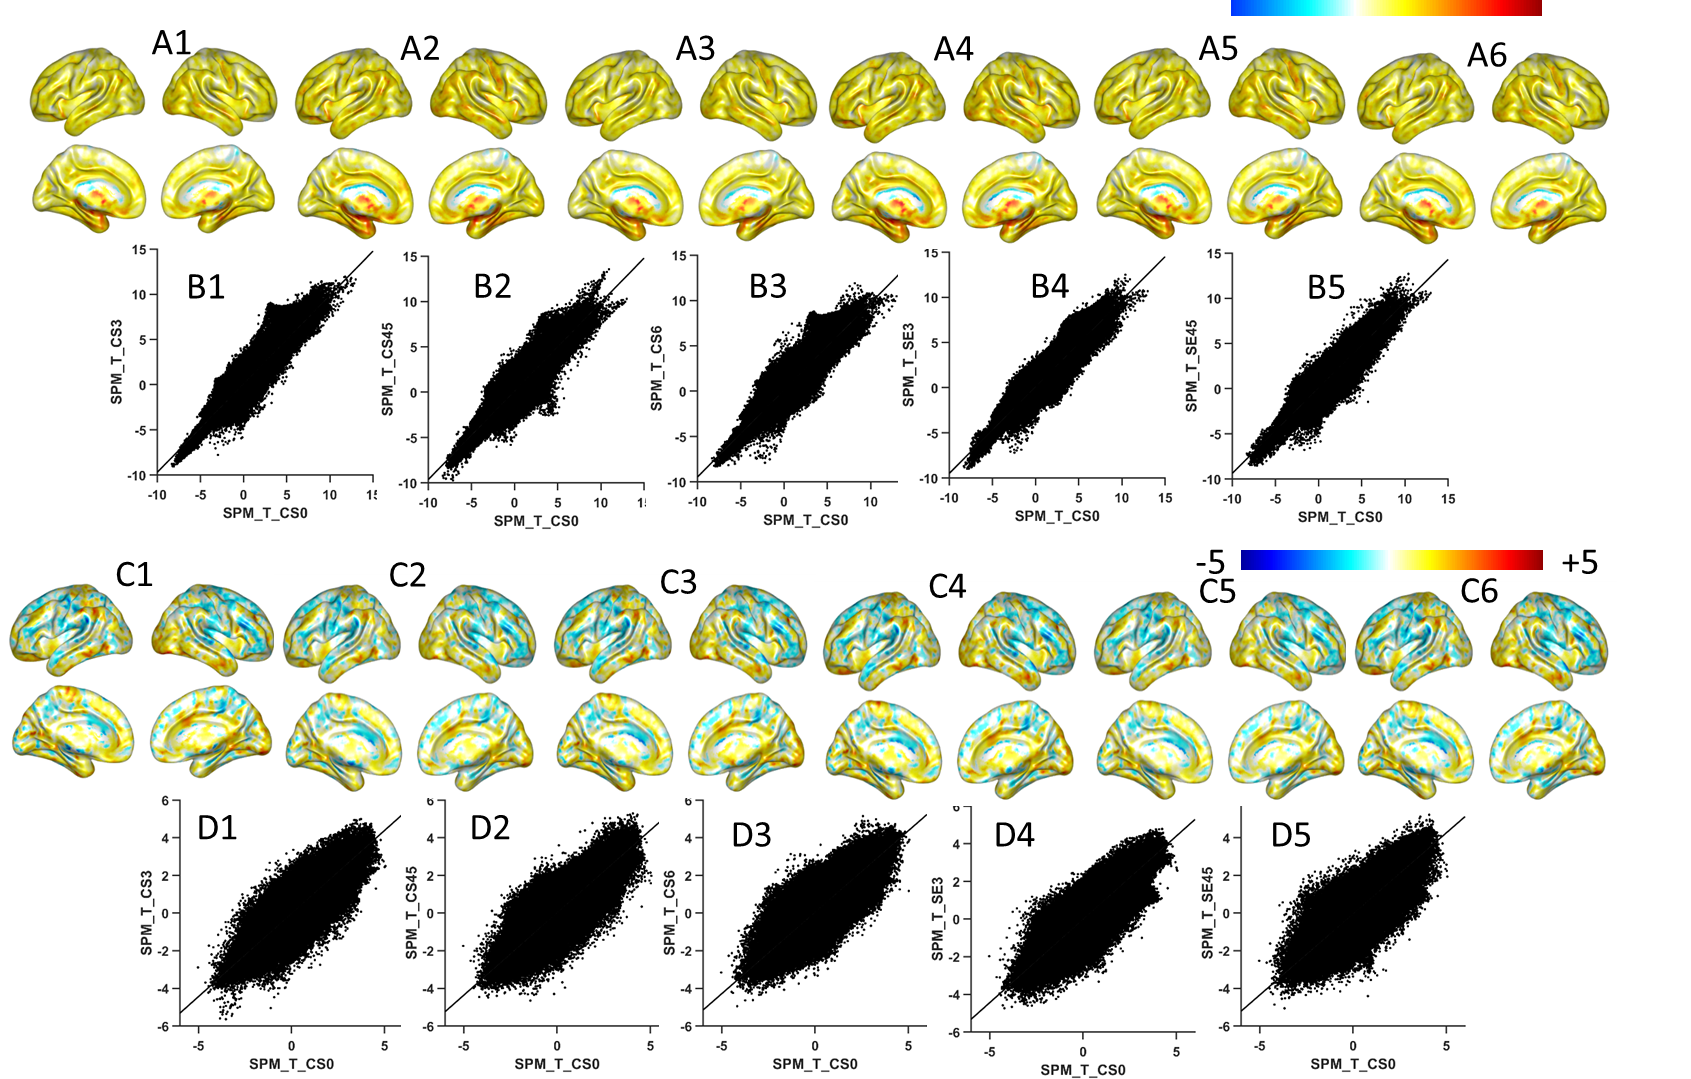
AD&HC and MS&HC group comparisons of gray matter volume
with different accelerated factor.
A1-6 T-map of the ICC values between healthy controls and AD
subjects with the reference sequence, CS3,
CS4.5, CS6, SE3, SE4.5. B1-5 Correlation between the T-map of the RS and the accelerated
sequences in AD. C1-6 T-map of the
ICC values between HC and MS subjects with RS and CS3, CS4.5, CS6, SE3, SE4.5. D1-5
Correlation between the T-map of the RS and the accelerated sequence in MS. Each protocol can catch the most significant group differences.