1748
Detectability of the Dura Matter at 7T using Compressed Sensing1School of Physics and Astronomy, SPMIC, Nottingham, United Kingdom, 2Department of Biomedical Engineering & Physics, Amsterdam University Medical Center, Amsterdam, Netherlands
Synopsis
High resolution of the dura matter is useful to detect and follow meningeal pathology. We presented 0.5mm isotropic images obtained at 7T, using compressed sensing to reduce the acquisition time and improve the detectability of the dura matter. Acceleration up to a factor of 8 was possible with broadening of the PSF of the dura visible at acceleration factor higher than 6.
Introduction
The aim of this study was to accelerate imaging of the dura at 7T for use in contrast enhanced studies of meningeal pathology (e.g. meningiomas, subdural and extra-dural collections, neurosarcoidosis1,2). Compressed sensing enables the reduction of the total amount of data necessary to acquire and reconstruct a MR image3, improving robustness to motion and possibly improving SNR in areas where standard parallel imaging methods would fail due to poor g-factor. One important image property generally needed in MRI is a good point spread function (PSF). Reducing the number of samples by changing the k-space trajectory will affect the intrinsic point spread function in addition to the reconstruction algorithm used. The goal of this study is to evaluate the detectability of the dura with increasing undersampling factor and reduced scan time. High speed is required for contrast enhancement studies and because small motion can easily degrade image quality in such small features, particularly in patient population.Methods
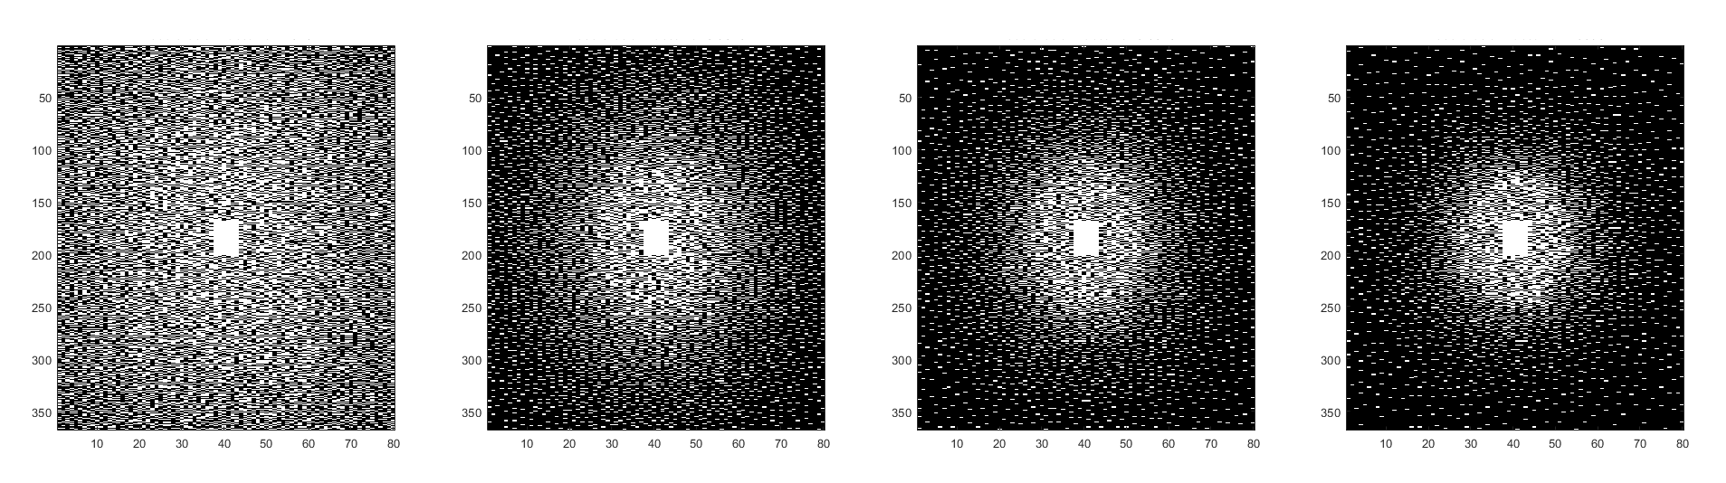
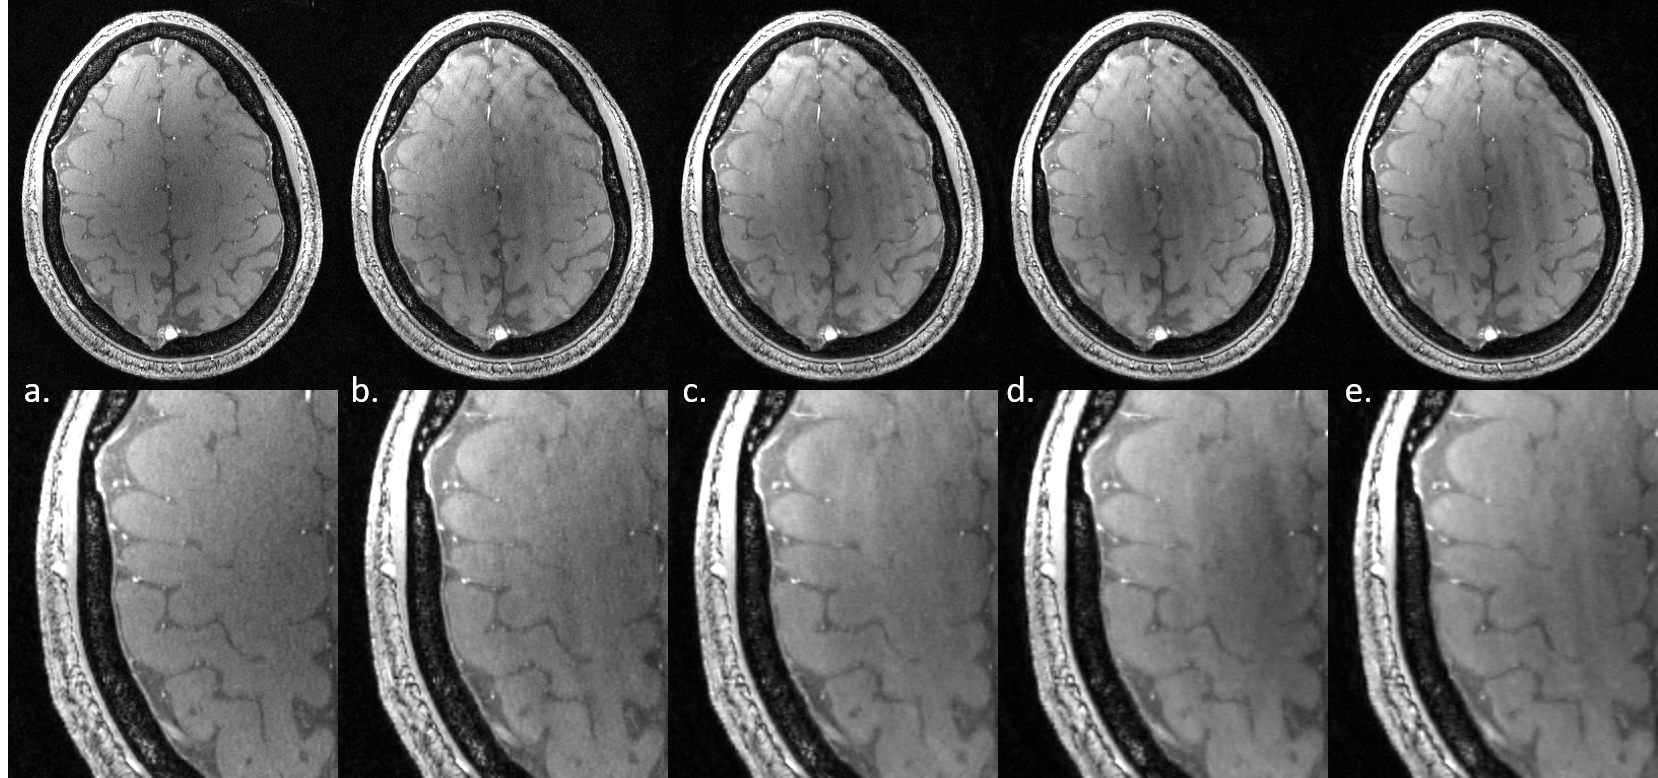
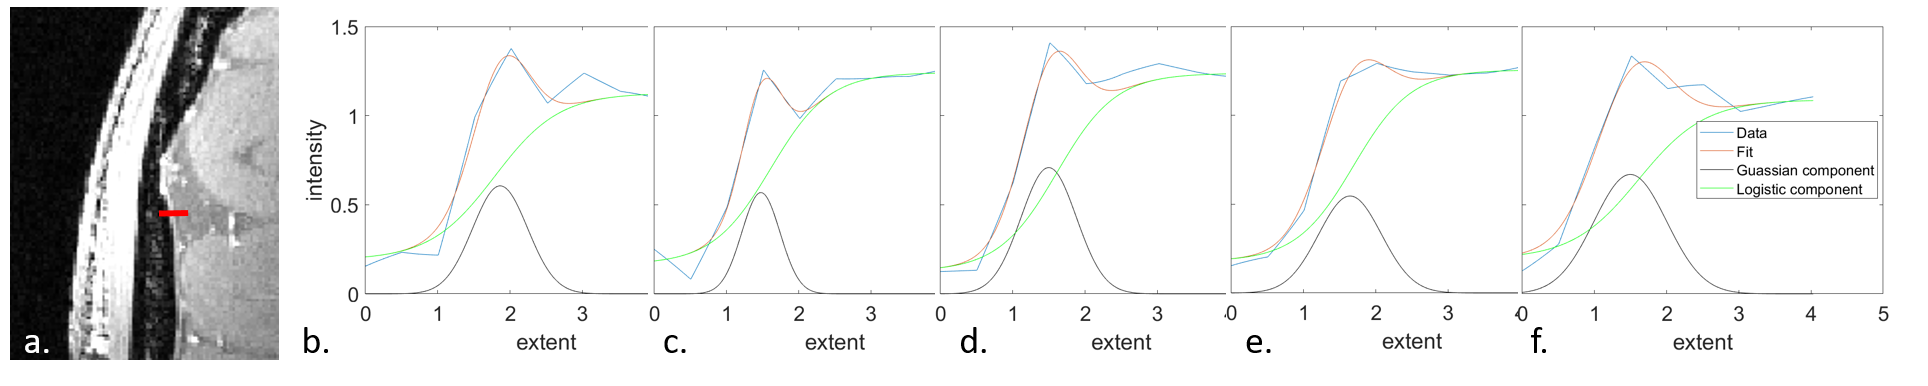
Data was acquired on a 7T Philips Achieva MRI using a single transmit/32 receiver channel coil. Undersampling was performed prospectively using the PROUD patch (PROspective Undersampling in multiple Dimensions) developed by the group in Amsterdam Medical Centre. The k-space trajectory strategy was obtained using a variable density Poisson-disc sampling. The sequence used was a 3D FLASH sequence with partial echo enabling short echo time necessary to visualise the dura matter. Acquisition parameters are TE/TR=2.1ms/9ms, flip angle of 9o, linear k-space encoding and no parallel imaging, giving a nominal spatial resolution of 0.5mm isotropic for a FOV=192x184x40mm. Acceleration factor (Acc) was set to none, 2, 4, 6 and 8 for a respective acquisition time of 4min25 (Acc=none), 2min07 (Acc=2), 1min06 (Acc=4), 47s (Acc=6) and 38s (Acc=8) (figure 1). The reconstruction was performed using the BART toolbox4 using Fast Iterative Soft-Thresholding Algorithm (FISTA) with l1-wavelet regularization (figure 2). Post-processing was performed using a matlab routine to fit and quantify the sharpness of the dura in different directions, using a Gaussian component modelling the dura added to a logistic component representing the skull/CSF transition (figure 3). Full Width at Half Maximum (FWHM) of both components were extracted to compare dura detectability between acceleration factors (figure 4) and a one-way ANOVA was performed on the FWHM using the Tukey-Kramer multiple comparison test.Results
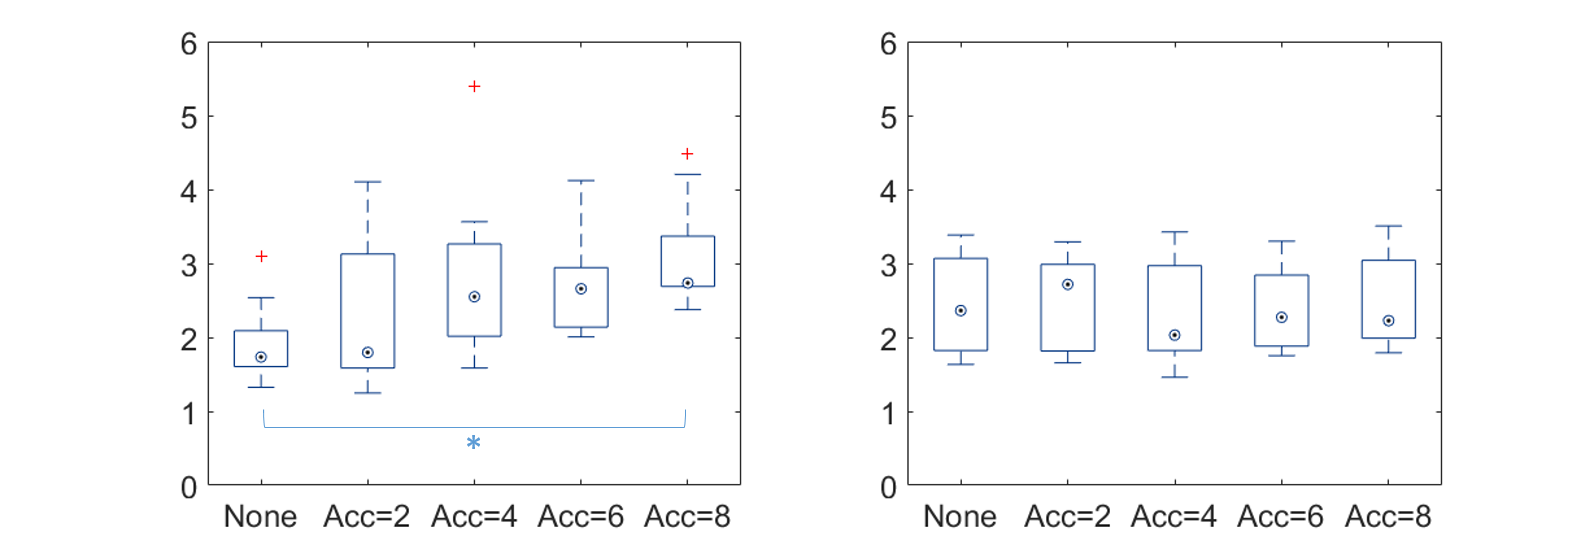
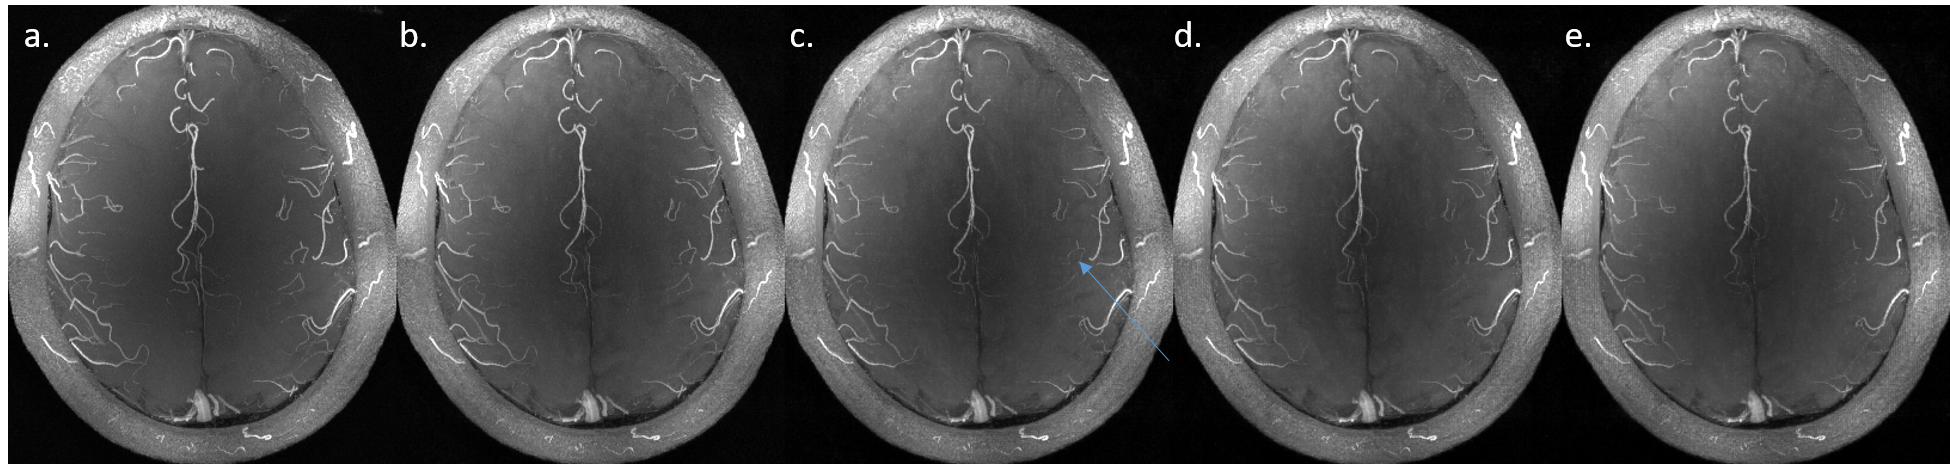
The increase acceleration factor did not influence the overall image quality as visible in figure 1, and reasonable delineation of all structures including the dura was possible for even the highest Acc. As expected the sharpness of the dura reduces with shorter scan time and the FWHM increased with the acceleration factor, from below 2 pixels for Acc=none to nearly 3 pixels for Acc=8. A one-way ANOVA was performed on the FWHM adjusted for multiple comparison (Tukey-Kramer), showing significant difference (p=0.045) between mean FWHM only between the non-accelerated dura PSF and the PSF from Acc=8. The FWHM of the logistic function however did not change and stayed constant at around 2.5 pixels. Additionally the maximum intensity projection obtained from the arteries in these images was comparable in quality and little difference was visible between the different acceleration factors (figure 5), except small details lost with Acc=4 or above.Discussion
Results presented here were acquired with a small FOV in the z-direction due to the large amount of data (and subsequent large RAM requirement) generated by a whole brain 3D dataset with 32 channels. Use of a high performance computing facility will enable whole brain dataset to be acquired and reconstruct in the near future, allowing full brain coverage and higher spatial resolution. Future work will also involve patient data acquisition with Gad uptake. This will require additional work on optimizing the sampling pattern together with the sequence parameters using in-house Bloch simulator to produce the sharpest PSF for this particular enhancing feature. Additional work will also focus on combining CS with SENSE for this particular application.Conclusion
Compressed sensing can be used to allow high resolution imaging of small features at 7T in a reasonable imaging time. This is important to reduce movement artefacts and to allow dynamic scanning, for instance of contrast agent uptake.Acknowledgements
No acknowledgement found.References
1: JL Dietemann, R Correia Bernardo, A Bogorin, M Abu Eid, M Koob, Th Nogueira, MI Vargas, W Fakhoury and G Zöllner. Normal and abnormal meningeal enhancement: MRI features. J Radio 2005, 86: 1659-83.
2: J.K. Smith M.G. Matheus and M. Castillo. Imaging Manifestations of Neurosarcoidosis. AJR 2004, 182(2).
3: Lustig M, Donoho D, Pauly JM. Sparse MRI: The application of compressed sensing for rapid MR imaging. 1. Magn Reson Med. 2007 Dec;58(6):1182-95.
4: Martin Uecker, Frank Ong, Jonathan I Tamir, Dara Bahri, Patrick Virtue, Joseph Y Cheng, Tao Zhang, and Michael Lustig. Berkeley Advanced Reconstruction Toolbox. Annual Meeting ISMRM, Toronto 2015, In Proc. Intl. Soc. Mag. Reson. Med. 23:2486
Figures