1744
The value of 3D ASL and DTI combined with conventional MRI features in differential diagnosis of hemangiopericytoma and angiomatous meningioma1taihe hospital, shiyan, China
Synopsis
To investigate the value of MRI characteristics in the differential diagnosis of hemangiopericytoma and angiomatous meningioma.15 cases of AM and 11 cases of the HPC which were confirmed by pathology. MRI sequences were routinely available. The mean ADC values of HPC was significantly higher than that of AM (t = 2.613, p =0.02). The mean CBF values (t= -8.99, P<0.01) and FA values (t= -3.66, P<0.01) were lower for HPC compared with AM. MRI imaging characteristics of HPC and AM have significant difference. Combining structural MRI comparative analysis and functional MRI was useful for distinguishing HPC from MA.
Purpose
It is very difficult to distinguish the image of intracranial hemangioblastoma(HPC) and meningioma, especially one subtype of meningioma - angiomatous meningioma( AM). Both of them belong to the extra cerebral tumor with abundant blood supply. The location and imaging features are very similar, often difficult to distinguish, and the clinical misdiagnosis rate is very high. However, AM belongs to benign tumor, with different biological behavior, surgical scheme and prognosis of which is also different. Therefore, accurate preoperative image diagnosis is of great significance for the choice of surgical methods and prognosis evaluation of patients.We aim to investigate the value of MRI characteristics in the differential diagnosis of HPC and AM.Methods
A retrospective review of medical records was conducted for 15 cases of AM and 11 cases of the HPC which were confirmed by pathology. MRI sequences including T1-weighted image, T2-weighted image, T1-weighted Gd-enhanced image, diffusion tensor imaging and 3D ASL were routinely available. Two independent samples t tests and chi-square test were conducted to observe the differences in imaging features and clinical histopathological features(p<0.05).Results
The mean ADC values of HPC was significantly higher than that of AM (t = 2.613, p =0.02). The mean CBF values (t= -8.99, P<0.01) and FA values (t= -3.66, P<0.01) were lower for HPC compared with AM. MRI imaging features including lobulated sign(χ2= 9.09, P<0.01) , tumor cystic necrosis(χ2=9.38,P<0.01), narrow base with dura mater(χ2=28.54,P<0.01), seldomly on dural tail sign (χ2=25.00,P<0.01) , dilated blood flow void(χ2=9.02,P=0.01), mild extent of peritumoral edema (χ2=19.25, P<0.01) , mainly iso to hypeintense signal on T1 weighted images (χ2=27.78,P<0.01) and iso to hyporintense signal on T2 weighted images (χ2=16.33,P<0.01) were much more comman on HPC, compared with AM. The average age of onset in HPC patiants were younger than that in AM patiants (t= -8.99, P<0.01). Gender (χ2=1.69, P=0.19) showed no statistical difference in the two group (p > 0.05).Conclusion
MRI imaging characteristics of HPC and AM have significant difference. Combining structural MRI comparative analysis and functional MRI was useful for distinguishing HPC from MA.Acknowledgements
I would like to show my deepest gratitude to my partners of this research group,who have provided me with valuable guidance in every stage of the experiment and the writing of thisthesis.References
[1] Rutkowski M J, Jian B J, Bloch O, et al. Intracranial hemangiopericytoma: clinical experience and treatment considerations in a modern series of 40 adult patients. Cancer,2012,118(6):1628-1636.
[2] Hayenga H N, Bishop A J, Wardak Z, et al. Intraspinal Dissemination and Local Recurrence of an Intracranial Hemangiopericytoma. World Neurosurg,2019,123:68-75.
[3] Yilmaz S S, Demirel G, Vatansever B, et al. Urgent surgical management of congenital intracranial hemangiopericytoma in a preterm neonate. Br J Neurosurg,2017:1-3.
[4] Yilin Sun,Hanzhi Zhang,Baoqing Qu,et al. Ultrastructural pathological differentiation of intracranial hemangiopericytoma and hemangioma meningioma. Journal of Capital Medical University,2009,30(6):845-848.
[5] Min Chen,Feng Li,ChunYing Liu,et al. A comparative study of imaging features and pathology of intracranial hemangioblastoma. radiologic practice,2014,29(1):49-52.
[6] Robson P M, Dai W, Shankaranarayanan A, et al. Time-resolved vessel-selective digital subtraction MR angiography of the cerebral vasculature with arterial spin labeling. Radiology,2010,257(2):507-515.
[7] Wu W C, Fernandez-Seara M, Detre J A, et al. A theoretical and experimental investigation of the tagging efficiency of pseudocontinuous arterial spin labeling. Magn Reson Med,2007,58(5):1020-1027.
[8] Bokkers R P, Bremmer J P, van Berckel B N, et al. Arterial spin labeling perfusion MRI at multiple delay times: a correlative study with H(2)(15)O positron emission tomography in patients with symptomatic carotid artery occlusion. J Cereb Blood Flow Metab,2010,30(1):222-229.
[9] Chenbo Li,Chun wang,Guoguang Fan, et al. MRI manifestations and differential analysis of intracranial periangiocytoma and meningioma. International Journal of Medical Radiology,2019,42(1):99-102.
[10] Fei Tang,Hui Liu. Comparative analysis of MRI and pathology of intracranial hemangioblastoma. journal of clinical radiology,2014,33(9):1438-1441.
[11] Liyan Xu,Haibao Wang,Wen Song, et al. MRI manifestations and pathological analysis of intracranial hemangioblastoma. Chinese medical imaging technology,2012,28(2):239-242.
[12] Wenyi Li,Hong Liu,Junlin Zhou, et al. Comparative analysis of imaging features of primary peripheral primitive neuroectodermal tumor and hemangioma meningioma of meninges. Magnetic resonance imaging,2014(6):441-445.
Figures
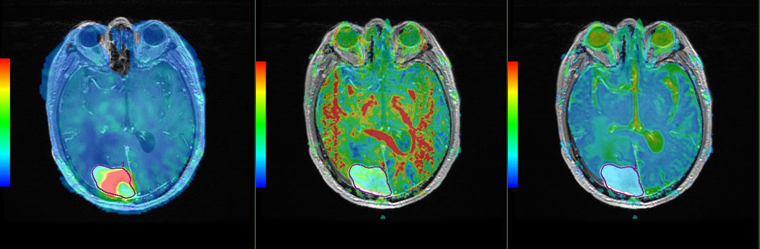
Male, 26 years old, HPC Left. enhanced fusion of CBF and T1WI (mean CBF value = 133.18 CBF value in high perfusion area = 248.15 CBF value in low perfusion area = 55.84); Middle. enhanced fusion of FA and T1WI (FA value = 0.12); Right. enhanced fusion of ADC and T1WI (ADC value = 1.20)