1743
Evaluation of glioma grade and proliferation activity by different diffusion-weighted-imaging models: including DKI and MAP-MRI1Department of Radiology, Affiliated Hospital of Inner Mongolia Medical University, Hohhot, China, 2Siemens Healthineers, Shanghai, China, 3East China Normal University, Shanghai, China
Synopsis
The purpose of this study was to explore the diagnostic value of multimode diffusion imaging in the evaluation of glioma tumor grade and proliferation activity. (DKI) and MAP-MRImodel). The results showed that there were significant differences in MK, RTOP and QIV between high and low grade glioma, and the values of MK and QIV of the tumor parenchyma were positively correlated with ki-67. MK and QIV have great potential in predicting tumor proliferation activity. Multimode diffusion-weighted imaging is valuable for the evaluation of preoperative glioma grade and tumor proliferation activity.
Objective
To explore the diagnostic value of two types of diffusion models in evaluation of glioma tumor grade and proliferation activity using advanced diffusion models, including diffusion kurtosis imaging (DKI) and newly proposed mean apparent propagator (MAP)-MRI.Materials and methods
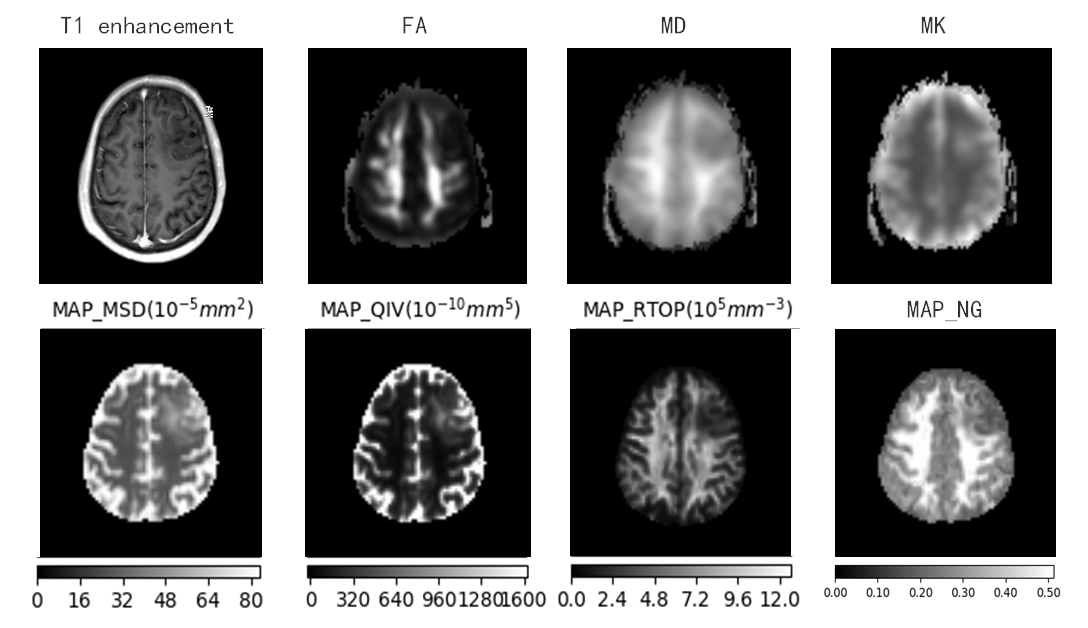
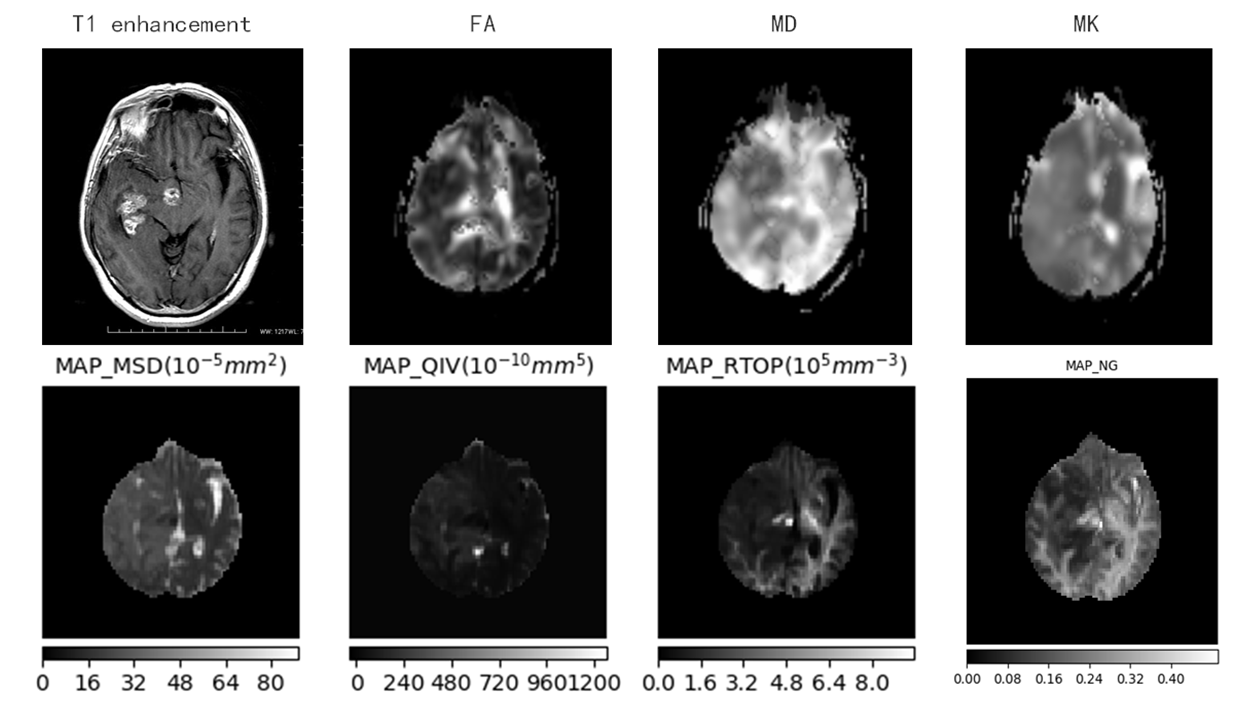
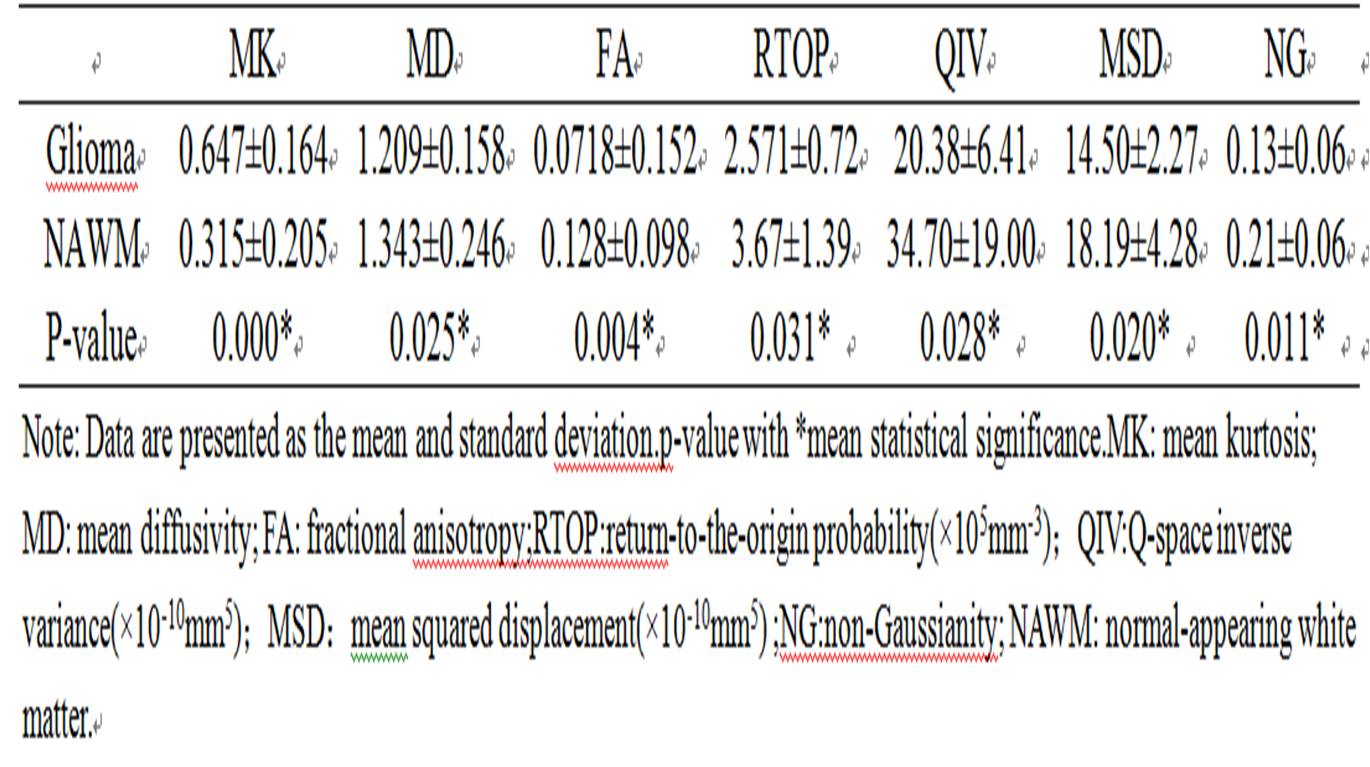
42 patients clinically diagnosed as glioma and confirmed by surgery were enrolled in this prospective study(22 had of low-grade glioma, 20 had of high-grade glioma). All the patients underwent DKI and MAP-MRI scanning on a 3T MR scanner (MAGNETOM Skyra, Siemens Healthcare, Erlangen, Germany). DKI parameters were as follows: TR=5500ms, TE=83.6ms, FOV=220mm×220mm, matrix =110×110, slice thickness= 4mm, inter-slice spacing = 0, b value = 0, 1000, 2000s/mm2, 30 diffusion directions, scan time = 9min12s. MAP-MRI parameters were as follows: TR=7000ms, TE=107ms, FOV=220mm×220mm, slice thickness= 3.0mm, matrix =98×98, the maximum b value = 3000s /mm2. Scan time= 15min40s. DKI data was post-processed on a Diffusional Kurtosis Estimator(DKE,NITRC) software, DKI parameters included mean diffusion kurtosis (MK), mean diffusion (MD) and fractional anisotropy (FA) value. The MAP-MRI parameters were calculated based on an in-house developed tool with Python, called NeuDiLab, which is based on an open-resource tool DIPY (Diffusion Imaging In Python, http://nipy.org/dipy). MAP-MRI parameters included the return-to-the-origin probability (RTOP), Q-space inverse variance (QIV), mean squared displacement (MSD) and the non-Gaussianity (NG).The tumor parenchyma was manually delineated and the ROI of the normal white brain texture on the contralateral side was standardized, and the differences of each parameter in glioma classification were compared. The receiver operating characteristic (ROC) curve was used to evaluate the diagnostic performance of these parameters, and the correlation between each parameter and ki-67 marker index was analyzed and calculated.Results
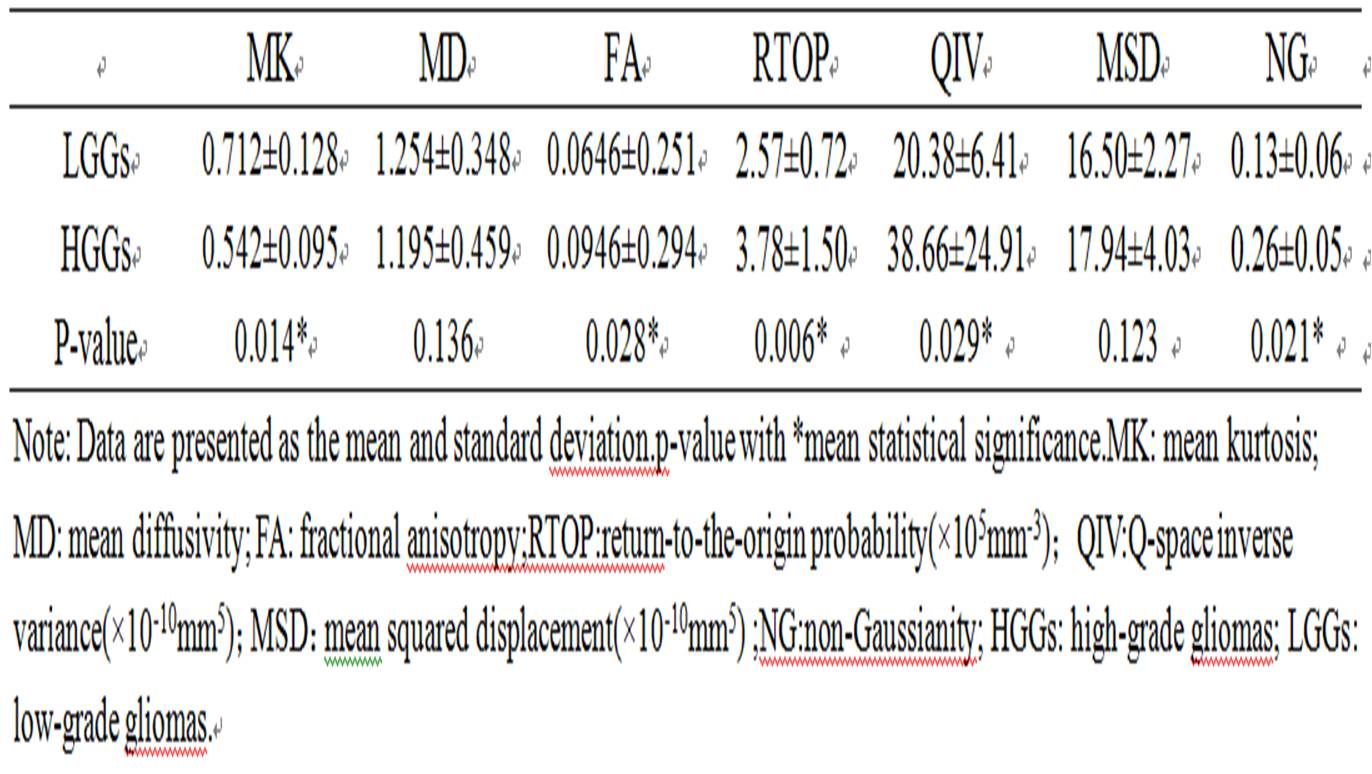
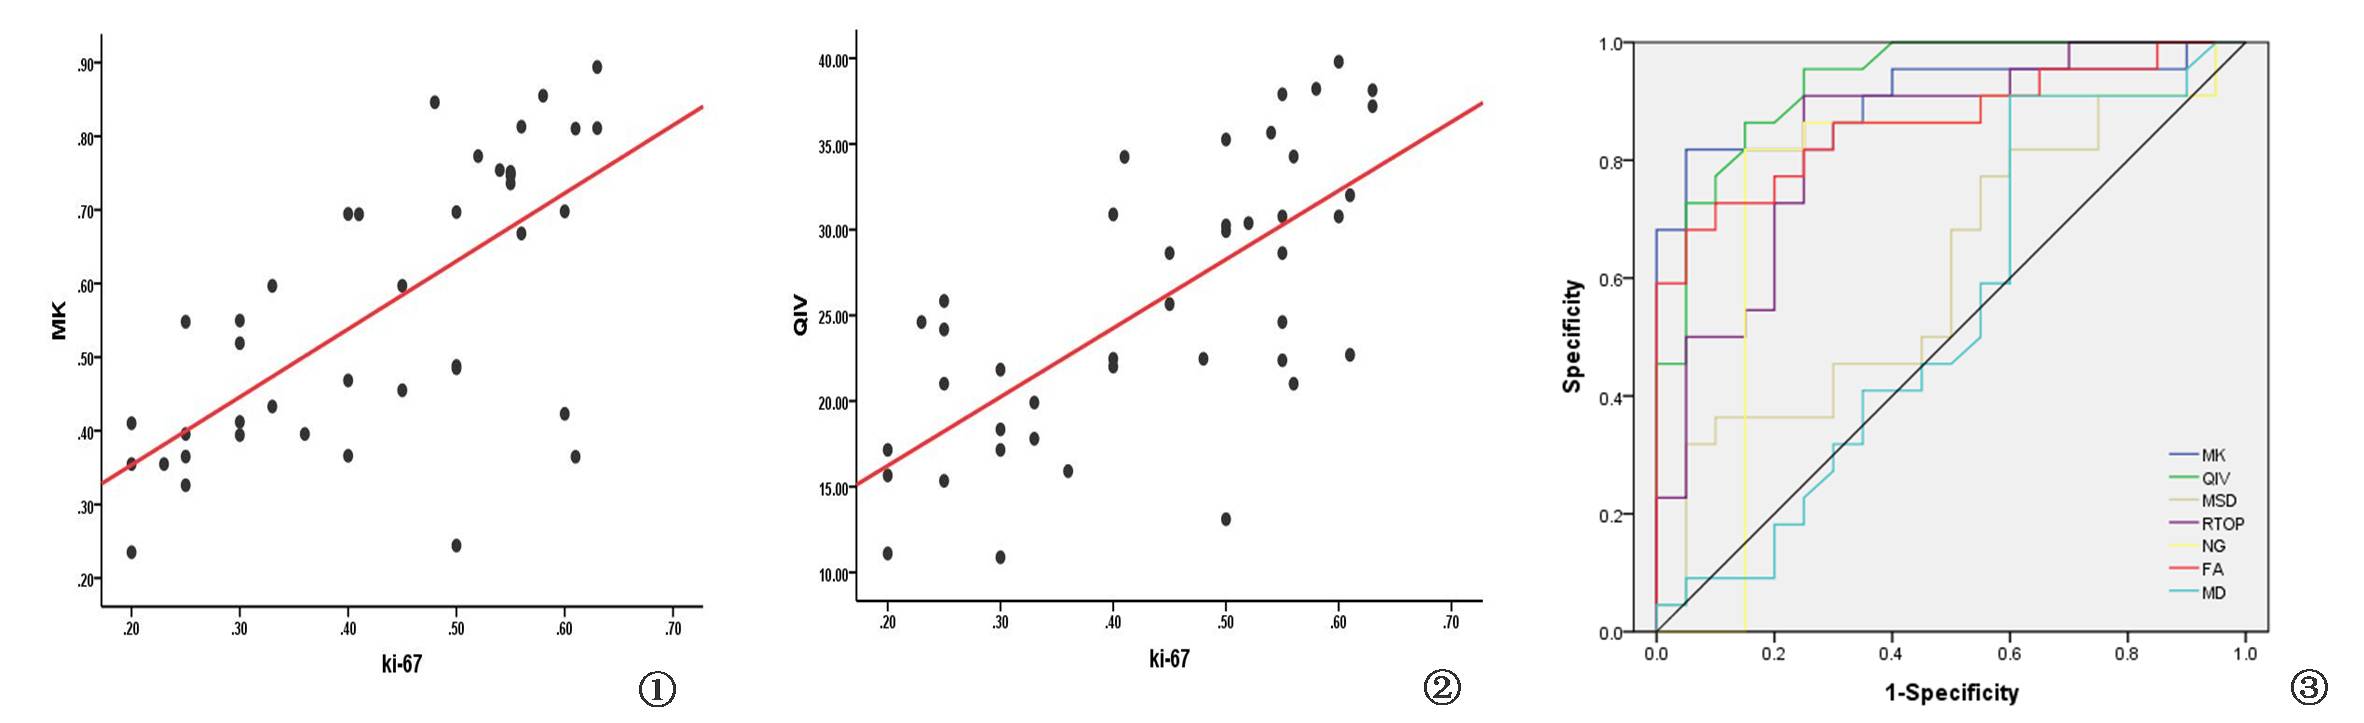
There were statistically significant differences in MK, FA,RTOP、NG and QIV between high and low grade glioma tumor parenchyma (P<0.05), and QIV and MK had a higher area under ROC curve (0.931 and 0.905). There was no statistically significant difference in MD and MSD between high and low grade gliomas (P > 0.05). MK and QIV values of tumor parenchyma were positively correlated with ki-67 (r = 0.682 and 0.694).Discussion
Diffusion kurtosis imaging (DKI) is an advanced non-gaussian diffusion imaging technique that provides a more accurate diffusion model to quantify deviations from gaussian distribution, or kurtosis. By obtaining at least two non-zero diffusion gradient factors (b values) in more than 15 nonlinear directions, the kurtosis indexes MK, Ka and Kr as well as the diffusion indexes MD and FA were obtained. The MAP-MRI model does not rely on the prior model. The model uses probability density function to describe the complete spatial distribution of the diffusion motion, and accurately distinguishes the local complex interleaving fibers with excellent angular resolution to obtain a true six-dimensional diffusion image. Therefore, it is of great significance for heterogeneous classification of glioma cells.High-grade gliomas are characterized by more cells, nuclear atypia, pleomorphism, and heterogeneity, with angiogenesis, necrosis, hemorrhage, and endothelial cell proliferation. In contrast, lower-grade gliomas are composed of well-differentiated cells with lower cell density, larger cells, and more uniform nests, and also have fewer diffusion barriers.
Conclusion
MK and QIV had great potential in predicting tumor proliferation activity. MK, RTOP, QIV and MK can effectively display the changes of tumor microstructure. RTOP and QIV not only reflect the diffusion characteristics of water molecules in the central nervous system, but also reflect the changes in the microstructure of tissues. Multimode diffusion-weighted imaging was valuable for the evaluation of preoperative glioma grade and tumor proliferation activity.Acknowledgements
Thanks to director gao Yang of radiology department of affiliated hospital of Inner Mongolia medical university for his guidance on this subject, and thanks to Mr. Wang shaoyu of Siemens scientific research team and Mr. Yang guang of Shanghai key magnetic resonance laboratory of east China normal university for their analysis and processing of experimental data.References
1. Zhang J , Chen X , Chen D , et al. Grading and proliferation assessment of diffuse astrocytic tumors with monoexponential, biexponential, and stretched-exponential diffusion-weighted imaging and diffusion kurtosis imaging[J]. European Journal of Radiology, 2018.
2. Qi X X , Shi D F , Ren S X , et al. Histogram analysis of diffusion kurtosis imaging derived maps may distinguish between low and high grade gliomas before surgery[J]. European Radiology, 2017.
3. Maximov I I , Tonoyan A S , Pronin I N . Differentiation of glioma malignancy grade using diffusion MRI[J]. Physica Medica, 2017:S1120179717302193.
4.Avram A V , Sarlls J E , Barnett A S , et al. Clinical feasibility of using mean apparent propagator (MAP) MRI to characterize brain tissue microstructure.[J]. Neuroimage, 2016, 127(3):422-434.
Figures