1741
Do targeted biopsies improve the correlation between ADC and cellularity in patients with glioma?1Department of Radiotherapy and Imaging, Institute of Cancer Research, Sutton, United Kingdom, 2Department of Surgery and Cancer, Imperial College London, London, United Kingdom, 3Department of Imaging, Imperial College London, London, United Kingdom, 4Department of Neurosurgery, Imperial College London, London, United Kingdom, 5Department of Histopathology, Imperial College London, London, United Kingdom, 6Department of Medicine, Imperial College London, London, United Kingdom, 7Centre for Clinical Brain Sciences, The University of Edinburgh, Edinburgh, United Kingdom
Synopsis
It is thought that hypercellular regions of glioma have lower ADC values via a restriction in flow path, but there is no consensus regarding the correlation between ADC values and the cellularity of histological biopsies. In this study a slightly stronger negative correlation was observed between sample cellularity and the average ADC across the biopsy region as compared to the average ADC across the whole tumour in patients with glioma. However, neither correlation was found to be significant, which could be due to a small cohort size and the variation in tumour biological factors other than cellularity affecting ADC.
INTRODUCTION
It is widely accepted that there is a link between the apparent diffusion coefficient (ADC) measured using diffusion weighted imaging, and the cellularity of brain tumours. While most studies have shown a negative correlation between ADC and cellularity, indicating that a high cellularity results in a lower ADC via a restriction in flow path [1] [2] [3], other studies have shown no or a positive correlation [4] [5]. Studies have investigated cellularity vs either a whole tumour ADC analysis [1] [4] or a biopsy region ADC analysis [2] [5] [6]. Given the heterogeneity of brain tumours, in the present study we investigate whether using targeted biopsies would improve the significance of the relationship between ADC and cellularity.METHODS
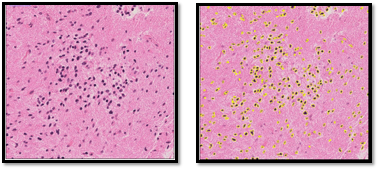
Twelve patients (6 male, 6 female; aged 23-73 years, mean 40 years) with suspected hemispheric glioma were recruited to this study following ethical approval and informed consent. MR images were acquired on a 3T Siemens Verio MRI system (Siemens, Erlangen, De; VB19) using a 32-channel head coil. The MR protocol included pre- and post-gadolinium volumetric T1 images (1x1x1mm); T2-FLAIR (0.9x0.9x5mm), DWI (TR=4600ms, TE=90ms; b=0,500,1000; 1.4x1.4x5mm). Whole tumour regions of interest (ROIs) were drawn on hyperintense regions on FLAIR images registered to the T1 image by a radiologist. Targeted stereotactic biopsies were obtained from each patient in 1-2 regions with high and low choline on MR spectroscopy and PET. The location of sample was recorded to create sample ROIs [7]. In total 20 samples were obtained. Samples were H&E stained for cellularity measurements and scanned at x40 magnification.Cellularity measurements from digital pathology images were carried out in ImageJ. The NDPIsplit programme was used to convert the images to TIFFs at x10 magnification. ROIs were drawn manually on each image, to include as much tissue as possible but exclude vascular areas, tears and imaging artefacts. The area of these ROIs was recorded. Images were converted to 8-bit and the automatic MaxEntropy threshold was applied. Images were converted to binary, and a watershed transform computed, segmenting overlapping nuclei. Particles larger than 10 pixels units squared were counted, as shown in Figure 1. Cell density was calculated assuming each cell contained one nucleus. This method was visually confirmed by a histopathologist. Average and minimum ADC values in biopsy regions were carried out by creating masks from the intra-operative recorded locations. ADC values for each sample were calculated by processing in Python. Average and minimum ADC values were also generated over the whole tumour masks. The correlation between the sample cellularity and the mean ADC of the biopsy region was examined. This was compared to the correlation between the cellularity of each sample and the mean and minimum ADC across the tumour it was taken from.
RESULTS
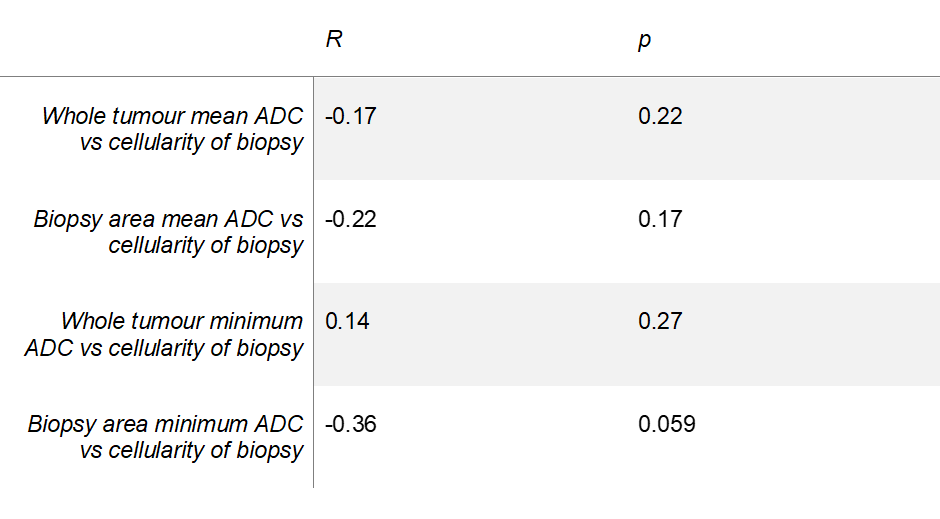
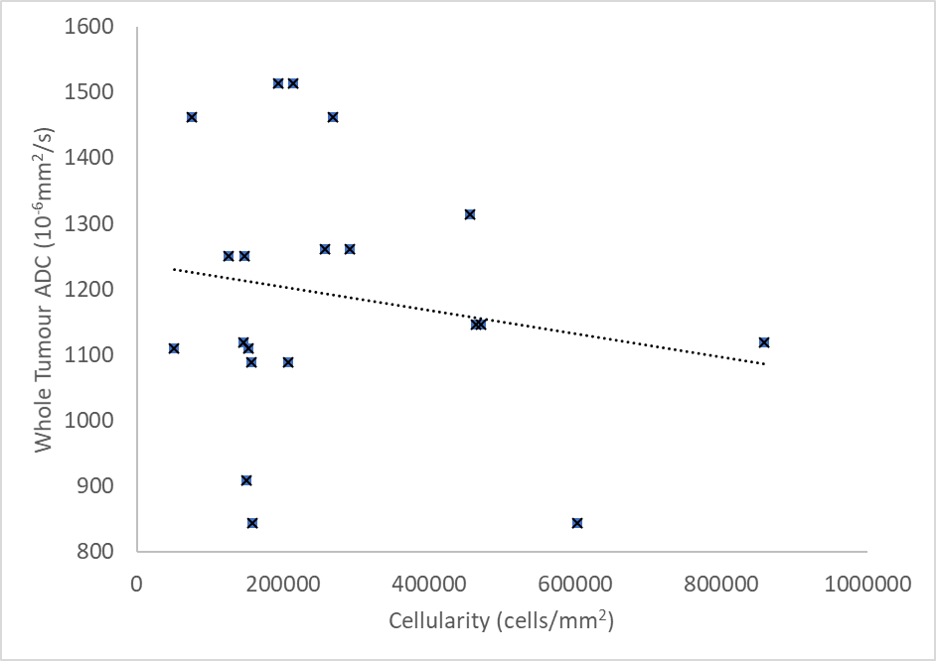
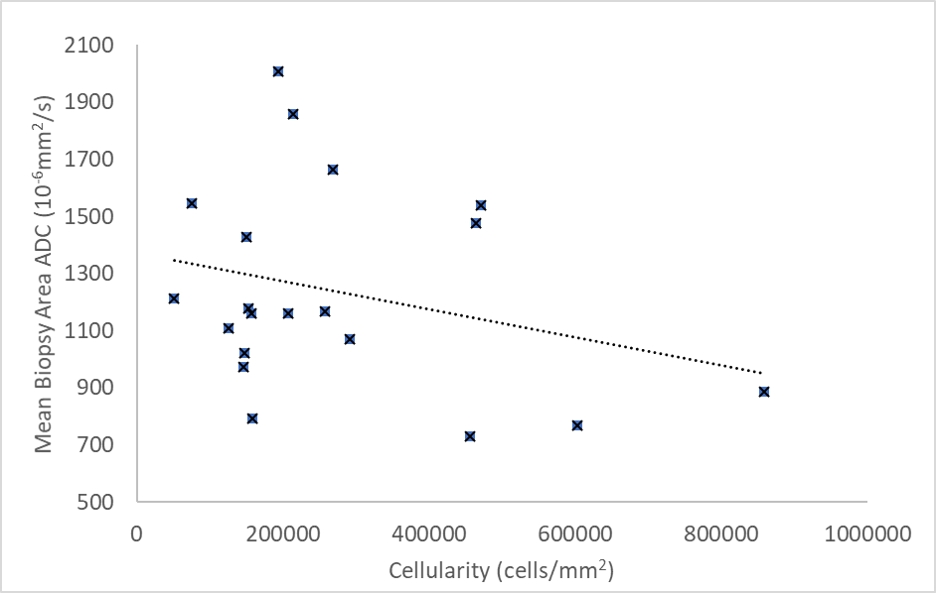
No significant correlation was observed between the cellularity of samples and ADC values (Table 1). A graph of whole tumour average ADC vs cellularity is shown in Figure 2 (R=-0.17, p=0.22). A weak negative correlation was observed between the cellularity of samples and the average ADC across the samples as shown in Figure 3 (R=-0.22, p=0.17). Minimum ADC values were also investigated across the whole tumour and biopsy areas. Across the whole tumour, no significant correlation was found (R=0.14, p=0.27). For biopsy areas there was a moderate negative correlation albeit insignificant (R=-0.36, p=0.059).DISCUSSION
ADC maps are routinely acquired during investigation of glioma. Validation of ADC values as a biomarker for cellularity could improve understanding of brain tumours and help guide biopsies. Although a negative correlation between ADC and cellularity of stereotactic biopsies was observed, this was insignificant and weaker than correlations published previously [2] [6]. This may be due to the small cohort size, however a similarly sized study with a similar patient group and one biopsy per patient demonstrated significant negative correlation [2]. A weaker (or no) correlation has been suggested to be due to factors such as necrosis [6] or the hydrophobicity of the extracellular matrix [8] affecting ADC. The cellularity of vascular areas, excluded from our measure of cellularity, may also play a role. Necrotic areas having a higher ADC could explain why a stronger correlation was observed when comparing minimum rather than mean ADC in the biopsy area. Additionally, differences between the diffusion characteristics of subgroups of glioma have been observed, with oligodendroglioma found to have significantly lower group ADC values than astrocytoma [9]. In previous studies, stronger correlations were observed when the cellularity of stereotactic biopsies were compared to the mean ADC within the sample area rather than the whole tumour. This was thought to overcome sampling errors caused by the heterogeneity of gliomas [2]. In our study there was no statistically significant correlation between cellularity and ADC for either method.CONCLUSION
While analysing ADC in biopsy regions showed a slightly stronger negative correlation as compared to using whole tumour regions, neither method showed a significant correlation between ADC and cellularity in our cohort. This may be due to the small cohort size. However, while our results are suggestive that targeted biopsies may improve biomarker validation, the other biological effects on ADC need to be investigated further.Acknowledgements
The authors would like to thank the patients who participated in this study. This study was supported by Imperial Experimental Cancer Medicine Centre, Imperial NIHR Biomedical Research Centre, Cancer Research UK Imperial Centre, the Imperial College Healthcare NHS Trust Tissue Bank and the Imperial College Healthcare NHS Trust Imaging Research Team. The authors would like to thank Lisa Del Bel Belluz from Imperial College London, UK, for their help in this study.References
REFERENCES
[1]
T. K. Y. Sugahara,
M. Kochi, I. Ikushima, Y. Shigematu, T. Hirai, T. Okuda, L. Liang, Y. Ge, Y.
Komohara, Y. Ushio and M. Takahashi, “Usefulness of diffusion-weighted MRI
with echo-planar technique in the evaluation of cellularity in gliomas.,” Journal
of Magnetic Resonance Imaging, pp. 53-60, 1999.
[2] B. Ellingson, M. Malkin, S. Rand, J. Connelly, C. Quinsey, P. LaViolette, D. Bedekar and K. Schmainda, “Validation of functional diffusion maps (fDMs) as a biomarker for human glioma cellularity,” Journal of Magnetic Resonance Imaging, vol. 31, no. 3, pp. 538-548, 2011.
[3] K. Gauvain, R. McKinstry, P. Mukherjee, A. Perry, J. Neil, B. Kaufman and R. Hayashi, “Evaluating pediatric brain tumor cellularity with diffusion-tensor imaging,” AJR Am J Roentgenol, pp. 449-454, 2001.
[4] M. Jenkinson, D. du Plessis, T. Smith, A. Brodbelt, K. Joyce and C. Walker, “Cellularity and apparent diffusion coefficient in oligodendroglial tumours characterized by genotype.,” J Neurooncol, vol. 96, no. 3, pp. 385-392, 2010.
[5] A. Stadlbauer, O. Ganslandt, R. Buslei, T. Hammen, S. Gruber, E. Moser, M. Buchfelder, E. Salomonowitz and C. Nimsky, “Gliomas: Histopathologic Evaluation of Changes in Directionality and Magnitude of Water Diffusion at Diffusion-Tensor MR Imaging,” Radiology, vol. 240, no. 3, 2006.
[6] O. Eidel, J.-O. Neumann, S. Burth, P. Kieslich, C. Jungk, F. Sahm, P. Kickingereder, K. Kiening, A. Unterberg, W. Wick, H.-P. Schlemmer, M. Bendszus and A. Radbruch, “Automatic Analysis of Cellularity in Glioblastoma and Correlation with ADC using Trajectory Analysis and Automatic Nuclei Counting,” PLoS ONE, vol. 11, no. 7, 2016.
[7] M. Grech-Sollars, B. Vaqas, G. Thompson, T. Barwick, L. Honeyfield, K. O'Neill and A. Waldman, “An MRS- and PET-guided biopsy tool for interoperative neuronavigational systems,” Journal of Neurosurgery, pp. 1-7, 2017.
[8] N. Sadeghi, I. Camby, S. Goldman, H.-J. Gabius, D. Balériaux, I. Salmon, C. Decaesteckere, R. Kiss and T. Metens, “Effect of Hydrophilic Components of the Extracellular Matrix on Quantifiable Diffusion-Weighted Imaging of Human Gliomas: Preliminary Results of Correlating Apparent Diffusion Coefficient Values and Hyaluronan Expression Level,” Neuroradiology, vol. 181, pp. 235-241, 2003.
[9] D. J. Tozer, H. R. Jager, N. Danchaivijitr, C. E. Benton, P. S.Tofts, J. H. Rees and A. D. Waldman, “Apparent diffusion coefficient histograms may predict low-glioma subtype.,” NMR in Biomedicine, vol. 20, pp. 49-57, 2006.
[10] D. L. Bihan, E. Breton, D. Lallemand, P. Grenier, E. Cabanis and M. Lavel-Jeantet, “MR Imaging of Intravoxel Incoherent Motions: Application to Diffusion and Perfusion in Neurologic Disorders,” Radiology, pp. 401-407, 1996.
Figures