1740
IVIM analysis using Total Variation Penalty Regularization Based Model for Brain Tumor Analysis1Centre for Biomedical Engineering, Indian Institute of Technology Delhi, New Delhi, India, 2Department of Neuroimaging & Interventional Radiology, National Institute of Mental Health and Neuro Sciences, Bengaluru, India
Synopsis
The occurrence of brain tumor is increasing; it is believed that early detection will prove to be beneficial for its treatment. IVIM has proved to provide valuable information and has been explored for brain tumor in prior studies. In the following study, IVIM analysis for brain tumor detection was performed using a novel Biexponential model with Total Variation regularization function (BE+TV model), and a comparison with established Biexponential model was performed. Improvement in coefficient of variation by 16.5 to 43.4% was observed across IVIM parameter. Perfusion faction was estimated to be reliably with this novel methodology.
Purpose
Diffusion Weighted Imaging – Intravoxel Incoherent Motion (DWI-IVIM) can characterize water diffusion and vasculature. It can be used as an alternative technique to measure brain diffusion and perfusion simultaneously [1,8] with no injection of Gadolinium based contrast; explicitly applicable for patients suffering from renal disorders[4,8]. Prior studies reported IVIM analysis with Biexponential (BE) model as proposed by Le Bihan et.al.[1] to characterize diffusion and perfusion in brain tumor. The conventional methodologies for fitting IVIM (single-step and two-step parameter fitting), perform a voxel-wise fitting[5,6] without taking into consideration the values of the neighboring voxels; this results in abrupt changes in the parameter values in a tissue region. In concern to the above stated problem, a novel modification of the BE model was reported which used Total Variation regularizing function (BE+TV model)[2]. The model had claimed to reduce non-physiological noise and maintained spatial homogeneity leading to better parameter fitting[2,3]. The model (BE+TV) has also been reported to perform better than BE model in osteosarcoma[2] and prostate cancer[7]. The objective of this study was to compare BE model and BE+TV model for brain tumor detection.Methodology
Clinical data acquisition: Seven patients (age 49±15years, 3Females:4Males) diagnosed with brain tumor underwent DWI-IVIM scans at NIMHANS (Bangalore) using 3T MRI (Achieva: Philips Healthcare, Best, The Netherlands). The IVIM acquisition was performed with 15 b-values [0, 10, 20, 40, 80, 110, 140, 170, 200, 300, 400, 500, 600, 700, 900] s/mm2, in three encoding directions.Processing: For IVIM analysis, the BE model and BE+TV model with Non-linear Least Square fitting were used, with values of TV parameters, alpha, and beta set to 0.01 & 0.99, respectively. For every patient region of interest (ROIs) of tumor region (~5600x5600 pixels) and healthy regions (~5500x5500 pixels), were drawn manually on the highest b value (b=900s/mm2) IVIM image and used for parametric maps. Parameter values estimated from BE and BE+TV method, and Coefficient of Variation (CV) were evaluated.
Results
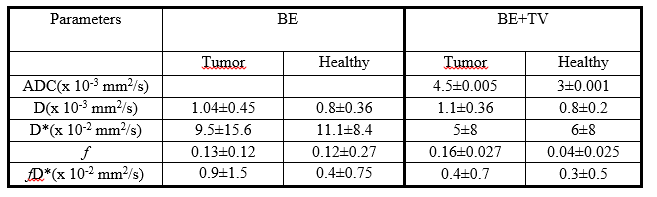
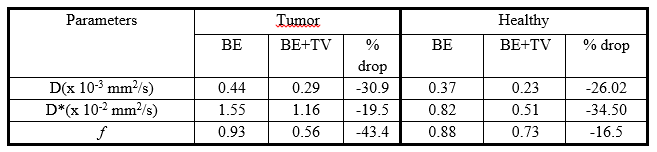
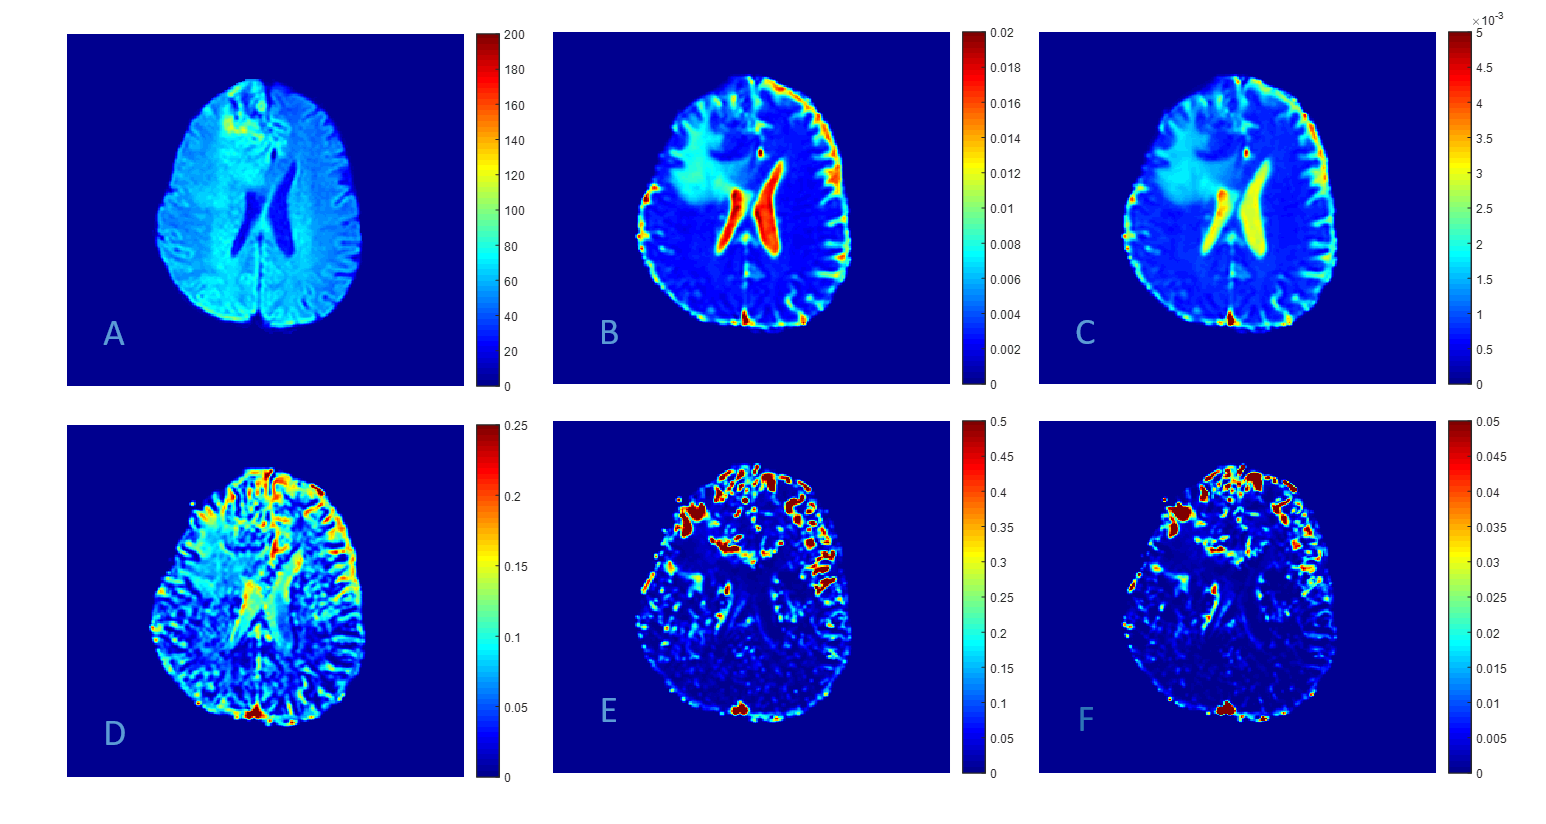
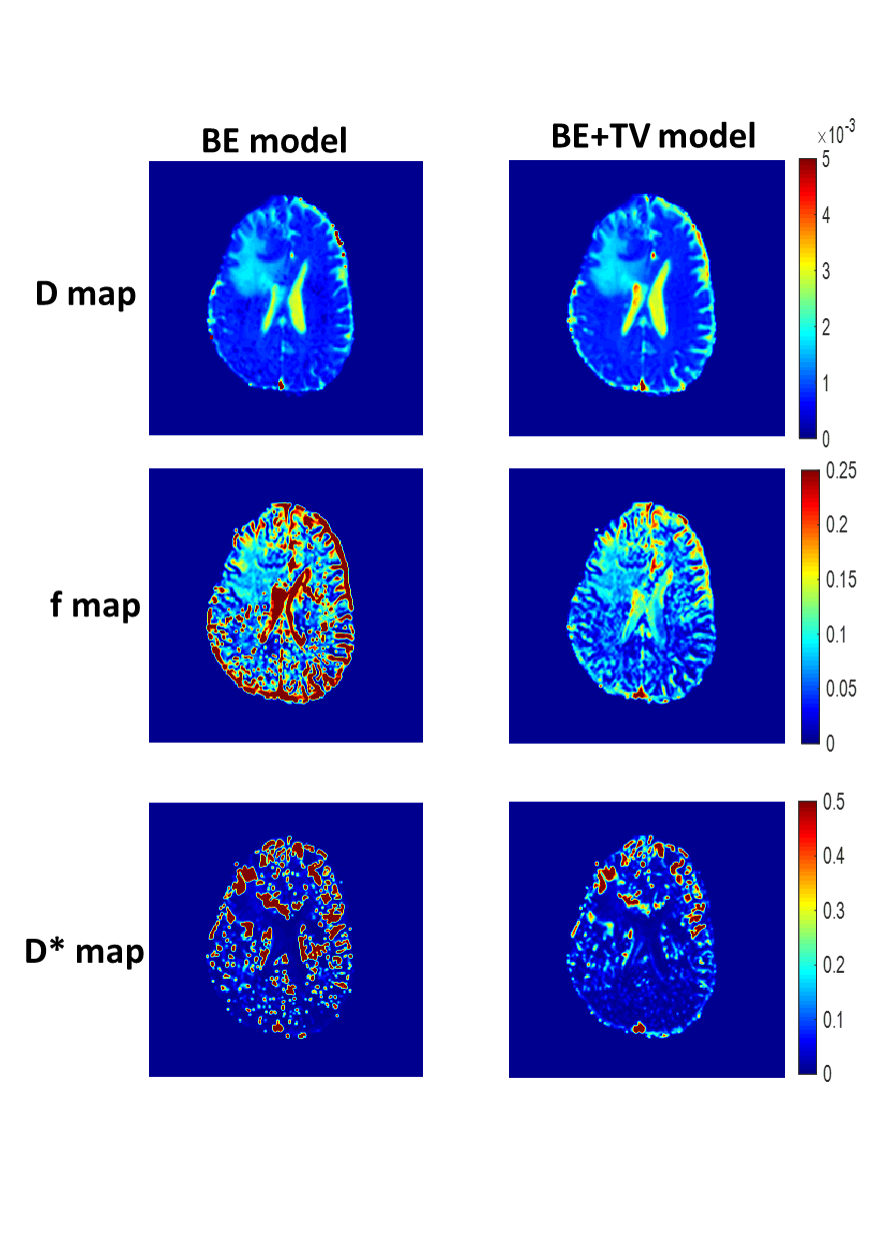
ADC and IVIM parameter(D, f, D*, & fD*) were estimated and analysed for tumor and healthy regions. The mean values for all the parameters estimated using BE and BE+TV model are presented in Figure1. Coefficient of variation (CV) calculated for all parameters using BE and BE+TV models are presented in Figure2. The mean values of parameters(D and f) in tumor region were observed to be higher with BE+TV model(D= 1.1±0.36, f= 0.16±0.027) than BE model(D=1.04±0.45, f=0.13±0.12). Parameters estimated using BE models were observed to have higher variability (tumor: 20-77.5%, healthy:4.76-66.2%) than BE+TV model. A Reduction by 31%, 19.5% and 43.4% in CV values of tumor region and 26%, 34.5% and 16.5% in CV values of healthy region was observed in parameters, D, D* and f, respectively with BE+TV model. For D*, CV value greater than 1 (CV=1.165) was observed in tumor region with BE+TV model. Figure 3 shows a representative patient with grade III tumour in right Fronto-Temporal region, ADC and D show similar hyper enhanced tumor and perfusion (f) shows higher values in tumor whereas D* and fD* are very variable and difficult to interpret. Figure 4 shows a qualitative comparison between the parameter maps using BE and BE+TV models.Discussion
In this study, two methods were compared for reliable analyses of IVIM MRI in brain tumors. The BE model has been used in past; recently a novel methodology was proposed to process IVIM, BE+TV model. TV function, a regularization function reduces sudden changes in parameter value and maintains spatial homogeneity. The mean values for D and f in tumor region obtained using BE+TV model(D= 1.1±0.36, f= 0.16±0.027) were higher than those calculated using BE model(D=1.04±0.45, f=0.13±0.12); however, D* and fD* followed a reverse trend. The use of BE+TV model also led to decreased variability in parameters, as observed by reduction in standard deviation(tumor:20-77.5%, healthy:4.76-66.2%). ADC and D followed a similar trend and were able to differentiation between healthy and tumor tissue using either models. The mean value of f, in tumor region obtained with BE+TV model was observed to be four times higher than of healthy tissue, suggesting its higher sensitivity for tumor. Along with improved mean values the application of BE+TV model resulted in decrease in CV values for all the parameters. The greatest reduction was observed for f, followed by D in tumor region. The use of TV function also resulted in improvement of quality of parameter maps (Figure 4). However, D* and fD* were observed to be highly variable and are difficult to analyse. The f map generated might be used to analyse tumor heterogeneity as areas of active growth were observed to be hyper-intense, while areas of edema and necrosis were observed as hypo-intense. A comparison of different maps (Figure 3) can be used for marking areas for biopsy. However, statistical analysis could not be made due to low number of patient cohorts.Acknowledgements
This study was supported by IIT Delhi, New Delhi and NIMHANS, Bengaluru.References
1. Le Bihan, D., Breton, E., Lallemand, et al. Separation of diffusion and perfusion in intravoxel incoherent motion MR imaging. Radiology, 1988; 168(2), 497-505.
2. Kayal, E. B., Kandasamy, D., Khare, et al. Quantitative analysis of intravoxel incoherent motion (IVIM) diffusion MRI using total variation and huber penalty function. Med. Phys., 2017; 44(11), 5849-5858.
3. Rudin, L. I., Osher, S., & Fatemi, E. Nonlinear total variation based noise removal algorithms Physica D, 1992; 60(1-4), 259-268.
4. Shen, N., Zhao, L., Jiang, J., et al. Intravoxel incoherent motion diffusion‐weighted imaging analysis of diffusion and microperfusion in grading gliomas and comparison with arterial spin labeling for evaluation of tumor perfusion. J. Magn. Reson. Imaging, 2016; 44(3), 620-632.
5. Togao, O., Hiwatashi, A., Yamashita, K., et al. Measurement of the perfusion fraction in brain tumors with intravoxel incoherent motion MR imaging: validation with histopathological vascular density in meningiomas. Br J Radiol, 2018; 91(1085), 20170912.
6. Federau, C., Maeder, P., O’Brien, K., et al. Quantitative measurement of brain perfusion with intravoxel incoherent motion MR imaging. Radiology, 2012; 265(3), 874-881.
7. Malagi, A. V., Das, C. J., Khare, K., et al. Effect of combination and number of b values in IVIM analysis with post-processing methodology: simulation and clinical study. Magn Reson Mater Phy, 2019; 32(5),519-527.
8. Le Bihan, D. What can we see with IVIM MRI? 2017. Neuroimage.
Figures