1737
Along-tract quantitative analysis of arcuate fasciculus for awake glioma surgery1Biomedical and Neuromotor Sciences, University of Bologna, Bologna, Italy, 2IRCCS Istituto delle Scienze Neurologiche di Bologna, Neurosurgery Unit, Bologna, Italy, 3IRCCS Istituto delle Scienze Neurologiche di Bologna, Neuroradiology Functional Diagnostic Unit, Bologna, Italy, 4Section of Anatomic Pathology 'M. Malpighi', Bellaria Hospital, Bologna, Italy, 5Physics and Astronomy, University of Bologna, Bologna, Italy, 6, IRCCS Istituto delle Scienze Neurologiche di Bologna, Bologna, Italy
Synopsis
Probabilistic arcuate fasciculus (AF) tractography was computed in healthy controls (HC) and for a patient with a diffuse glioma, IDH 1 wild type left frontal lobe. Bilateral curvature mapping and along-tract DTI measures were evaluated, modelling surface geometry. In HC, hemispheric asymmetries in tract curvature showed a more lateral and inferior trajectory on the left, not measured for the patient’s left AF, medially dislocated. In HC, a left-lateralized asymmetries (higher FA and volume) was measured, and it was preserved for the patient. During pre-surgical evaluation, the proposed developed tractography analyses allowed a quantitative investigation of AF dislocation and microstructural integrity.
Introduction
Tractography has been shown to provide useful information in preoperative stages1 and intraoperatively, through neuronavigation systems supporting direct cortical electrostimulation to preserve white matter (WM) tracts2. To date, DTI measure alterations have been quantified at a whole-tract level, even in case of selected tract segment infiltration/disruption/dislocation due to intracranial lesions3. Previous studies assessed tract dislocation qualitatively (e.g. latera-medial) by visual assessment 4,5.The proposed investigation aims to provide a quantitative analysis of the arcuate fasciculus (AF), evaluating curvature mapping in the MNI space and along-tract DTI measures. Bilateral AF tractography was performed in a patient candidate to awake-surgery for left hemisphere glioma. Hemispheric asymmetries were evaluated in comparison to a healthy control (HC) population.Methods
A patient (F, 29y, right-handed) presented a diffuse glioma IDH 1 wild type, localised in the left precentral, inferior and middle frontal gyri. The patient and nineteen HC (F/M=7/12, age [mean±SD]= 41±15 y) underwent a standardised 3T MR protocol, including: T1w MPRAGE (1mm isotropic voxel, TE= 2.98 ms, TR=2300 ms), SS-EPI DTI (2mm isotropic voxel, b-value=2000 s/mm2, 64 diffusion gradient directions, 5 null b-value volumes, phase encoding AP, TE=98 ms, TR=4300 ms) and 3 volumes with null b-value and reversed-phase encoding.The tumour mask was manually defined (AFNI software), basing on T1w and Flair contrast (3D T2w SPACE, 1mm isotropic voxel). For DTI preprocessing, PCA denoising (MRtrix3), topup and eddy (FSL) corrections were applied. Ifod2 probabilistic constrained spherical deconvolution tractography was computed (MRtrix3) using MNI-VOIs non linearly registered to the subject's native space (flirt and fnirt for MNI to T1w registration, epi_reg for T1 to DTI). Tractography seed was located in the WM underlying the angular gyrus6, targeting both frontal and temporal lobes (Harvard-Oxford probabilistic atlas thresholded at 25% of subjects). Tractography AF results were thresholded at 10% of the maximum of connectivity within each voxel, for HC and patient. Tractography results were linearly registered to the MNI space to preserve the native bundle geometry, which can be modified applying non-linear registration fields, especially for pathological brains. Tractography group variability maps for HC were computed and showed including at least 20% of subjects. Tractography 3D rendering was modelled using the brainR package.
The along-tract analysis was restricted to the WM core before tract branching (MNI-152 coordinate limits y=-6mm and z=8mm) and the AF was divided into fifteen segments7. AF segment centroid coordinates were measured to map: curvature, along-tract DTI metrics (FA, MD) and segment volume. The non-parametric paired Wilcoxon signed-rank test, was used for left-right comparisons in HC, p-value<0.05 corrected by the False Discovery Rate (FDR) across segments (Matlab R2019a).
Results
Bilateral AF tractography was successfully computed for HC, and in a patient with a diffuse glioma IDH 1 Wild type, whose molecular analysis is going (figure 1,2,3).In HC, AF curvature mapping showed a significant more lateral and inferior trajectory towards the left frontal lobe in comparison to the right. On the contrary, the patient’s left AF was medially dislocated by the tumour mass, as quantified by the minor x-coordinate (increasing from the midsagittal plane to lateral sides) in comparison to HC, in the frontal AF segments. Besides, the right patient’s AF presented a more medial trajectory following the same HC curvature profile (Figure 4). Moreover, in HC the AF left frontal segments presented a significantly higher FA and increased volume in comparison to the right. For the patient, these DTI measure and volume asymmetries, described in HC, were overall preserved (Figure 5).
After surgery, the patient did not show neurological deficit.
Discussion
The implemented AF curvature and along-tract DTI measure evaluation provided a valid method for quantitative tractography analysis. Even if other along-tract approaches are possible8,9, they are not always suitable for probabilistic tractography and do not allow tract geometry description. In our results, the AF hemispheric asymmetries, especially towards the frontal pars opercularis, may underlay a left language functional dominance, and confirmed previous findings showing a left-AF tractography lateralisation10. The proposed curvature mapping approach well describes the qualitative observations on the left AF dislocation, visible in the patient’s native space (Figure 3). Moreover, the tract 3D-rendering (Figure 2) supports the interpretation of curvature mapping profiles (Figure 4). The patient’s DTI measures were comparable with HC distributions (Figure 4), suggesting a preservation of the left AF microstructural integrity.Conclusion
The proposed along-AF analysis offered a valid tool for quantitative MR pre-surgical planning. The comparison between the patient and a group of HC offered a robust approach for tractography analysis in presence of glioma. The developed curvature mapping and along-tract DTI evaluation were successfully applied for the bilateral AF, and for future applications they can be computed for other WM tracts, informative in presurgical planning (frontal aslant tract, cortico-spinal tract)2,11.Acknowledgements
No acknowledgement found.References
1- Essayed WI, Zhang F, Unadkat P, Cosgrove GR, Golby AJ, O'Donnell LJ. White matter tractography for neurosurgical planning: A topography-based review of the current state of the art. Neuroimage Clin. 2017 Jun 15;15:659-672.
2-Kinoshita M, de Champfleur NM, Deverdun J, Moritz-Gasser S, Herbet G, Duffau H. Role of fronto-striatal tract and frontal aslant tract in movement and speech: an axonal mapping study. Brain Struct Funct. 2015 Nov;220(6):3399-412.
3-Mormina E, Longo M, Arrigo A, Alafaci C, Tomasello F, Calamuneri A, Marino S, Gaeta M, Vinci SL, Granata F. MRI Tractography of Corticospinal Tract and Arcuate Fasciculus in High-Grade Gliomas Performed by Constrained Spherical Deconvolution: Qualitative and Quantitative Analysis. AJNR Am J Neuroradiol. 2015 Oct;36(10):1853-8.
4-Romano A, D'Andrea G, Minniti G, Mastronardi L, Ferrante L, Fantozzi LM, Bozzao A. Pre-surgical planning and MR-tractography utility in brain tumour resection. Eur Radiol. 2009 Dec;19(12):2798-808.
5-Delgado AF, Nilsson M, Latini F, Mårtensson J, Zetterling M, Berntsson SG, Alafuzoff I, Lätt J, Larsson EM. Preoperative Quantitative MR Tractography Compared with Visual Tract Evaluation in Patients with Neuropathologically Confirmed Gliomas Grades II and III: A Prospective Cohort Study. Radiol Res Pract. 2016;2016:7671854.
6-Giorgio A, Watkins KE, Chadwick M, James S, Winmill L, Douaud G, De Stefano N, Matthews PM, Smith SM, Johansen-Berg H, James AC. Longitudinal changes in grey and white matter during adolescence. Neuroimage. 2010 Jan 1;49(1):94-103.
7-Talozzi L, Testa C, Evangelisti S, Cirignotta L, Bianchini C, Ratti S, Fantazzini P, Tonon C, Manners DN, Lodi R. Along-tract analysis of the arcuate fasciculus using the Laplacian operator to evaluate different tractography methods. Magn Reson Imaging. 2018 Dec;54:183-193.
8-Colby JB, Soderberg L, Lebel C, Dinov ID, Thompson PM, Sowell ER. Along-tract statistics allow for enhanced tractography analysis. Neuroimage. 2012 Feb 15;59(4):3227-42.
9-Yeatman JD, Dougherty RF, Myall NJ, Wandell BA, Feldman HM. Tract profiles of white matter properties: automating fiber-tract quantification. PLoS One. 2012;7(11):e49790.
10-Bain JS, Yeatman JD, Schurr R, Rokem A, Mezer AA. Evaluating arcuate fasciculus laterality measurements across dataset and tractography pipelines. Hum Brain Mapp. 2019 Sep;40(13):3695-3711.
11-Pujol S, Wells W, Pierpaoli C, Brun C, Gee J, Cheng G, Vemuri B, Commowick O, Prima S, Stamm A, Goubran M, Khan A, Peters T, Neher P, Maier-Hein KH, Shi Y, Tristan-Vega A, Veni G, Whitaker R, Styner M, Westin CF, Gouttard S, Norton I, Chauvin L, Mamata H, Gerig G, Nabavi A, Golby A, Kikinis R. The DTI Challenge: Toward Standardized Evaluation of Diffusion Tensor Imaging Tractography for Neurosurgery. J Neuroimaging. 2015 Nov-Dec;25(6):875-82.
Figures
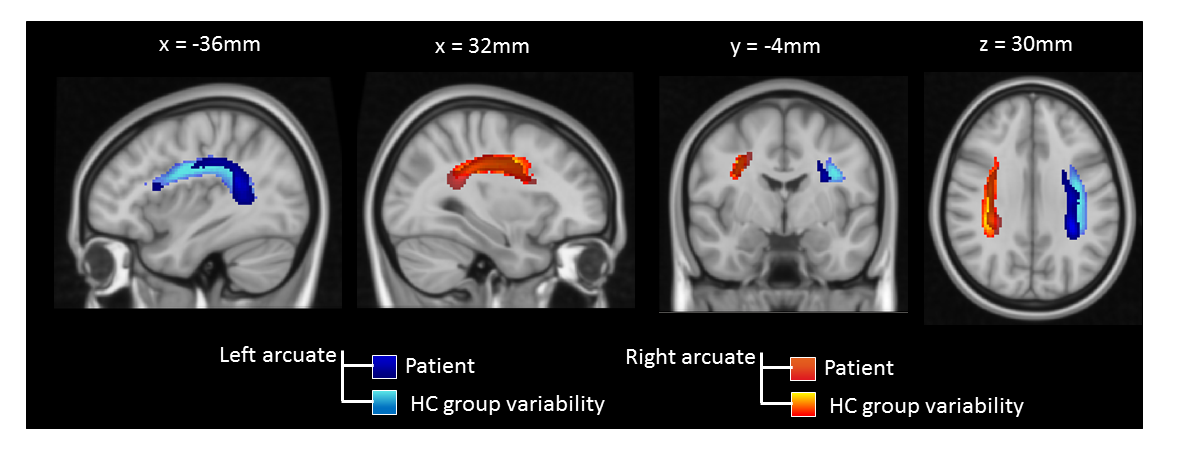
Fig. 1
Sagittal, coronal and axial views of healthy controls’ (HC) group variability (GV) maps, with overlay patient’s tractography results. GV were thresholded to contain at least 20% of subjects. Coordinates of the projections were reported in mm in the MNI-152 standard space. Intensity color-maps are scaled to the minimum (darker) and maximum (brighter), representing the number of subjects for the HC GV maps, and the number of streamlines per voxel for the patient.
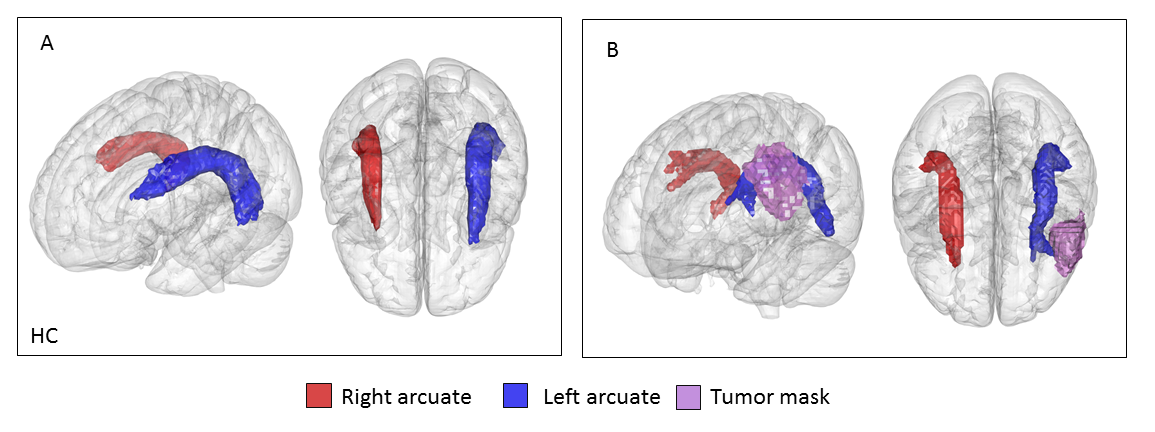
Fig. 2
A: 3-dimensional rendering of healthy controls’ (HC) group variability map volume, on the MNI-152 brain, thresholded to contain at least 20% of subjects. The left arcuate fasciculus (AF) was colored in blue and the right AF in red. Left lateral and superior prospectives are shown.
B: 3-dimensional rendering of the patient’s bilateral arcuate volume and left tumor mass (purple) on the MNI-152 brain. The left AF was colored in blue and right AF in red. Left lateral and superior perspectives are shown.
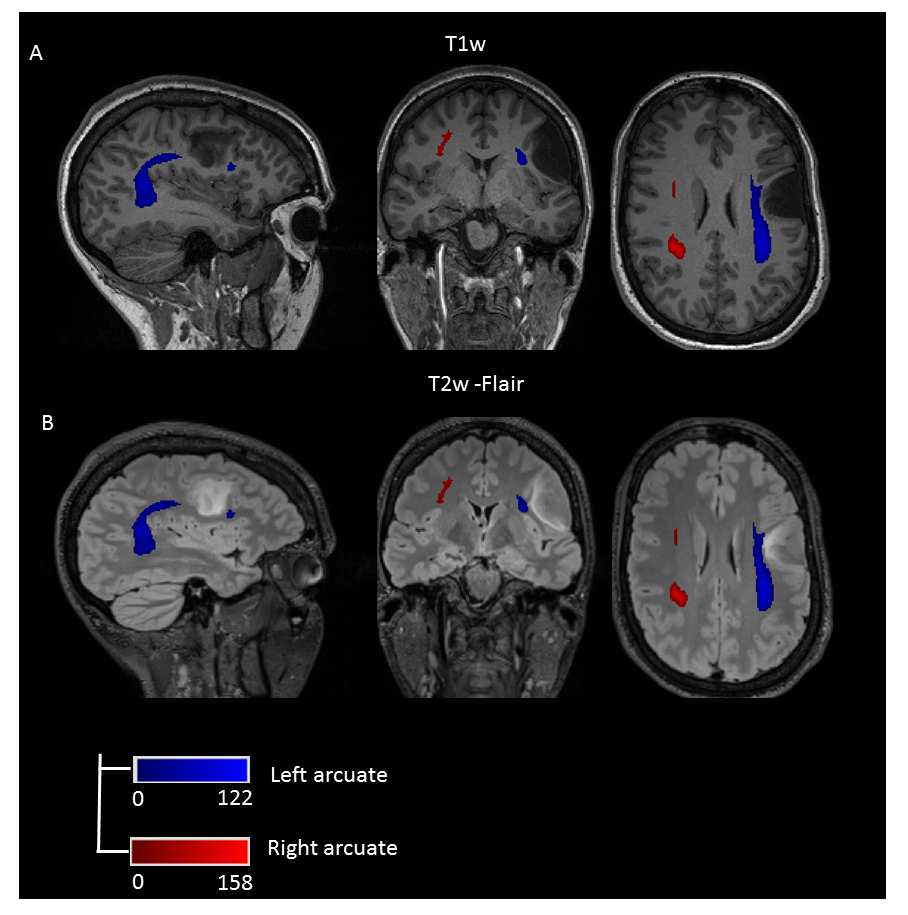
Fig. 3
A: Patient’s T1w MPRAGE (1mm isotropic voxel) with overlay bilateral tractography results, the left arcuate fasciculus (AF) colored in blue and right AF in red. Intensity scales are scaled according to the number of streamlines per voxel to the minimum (darker) and maximum (brighter).
B: Patient’s T2w SPACE FLAIR (1mm isotropic voxel) with an overlay of bilateral tractography results colored for the left AF in blue and right AF in red. Intensity colour-maps are scaled according to the number of streamlines for the minimum (darker) and maximum (brighter).
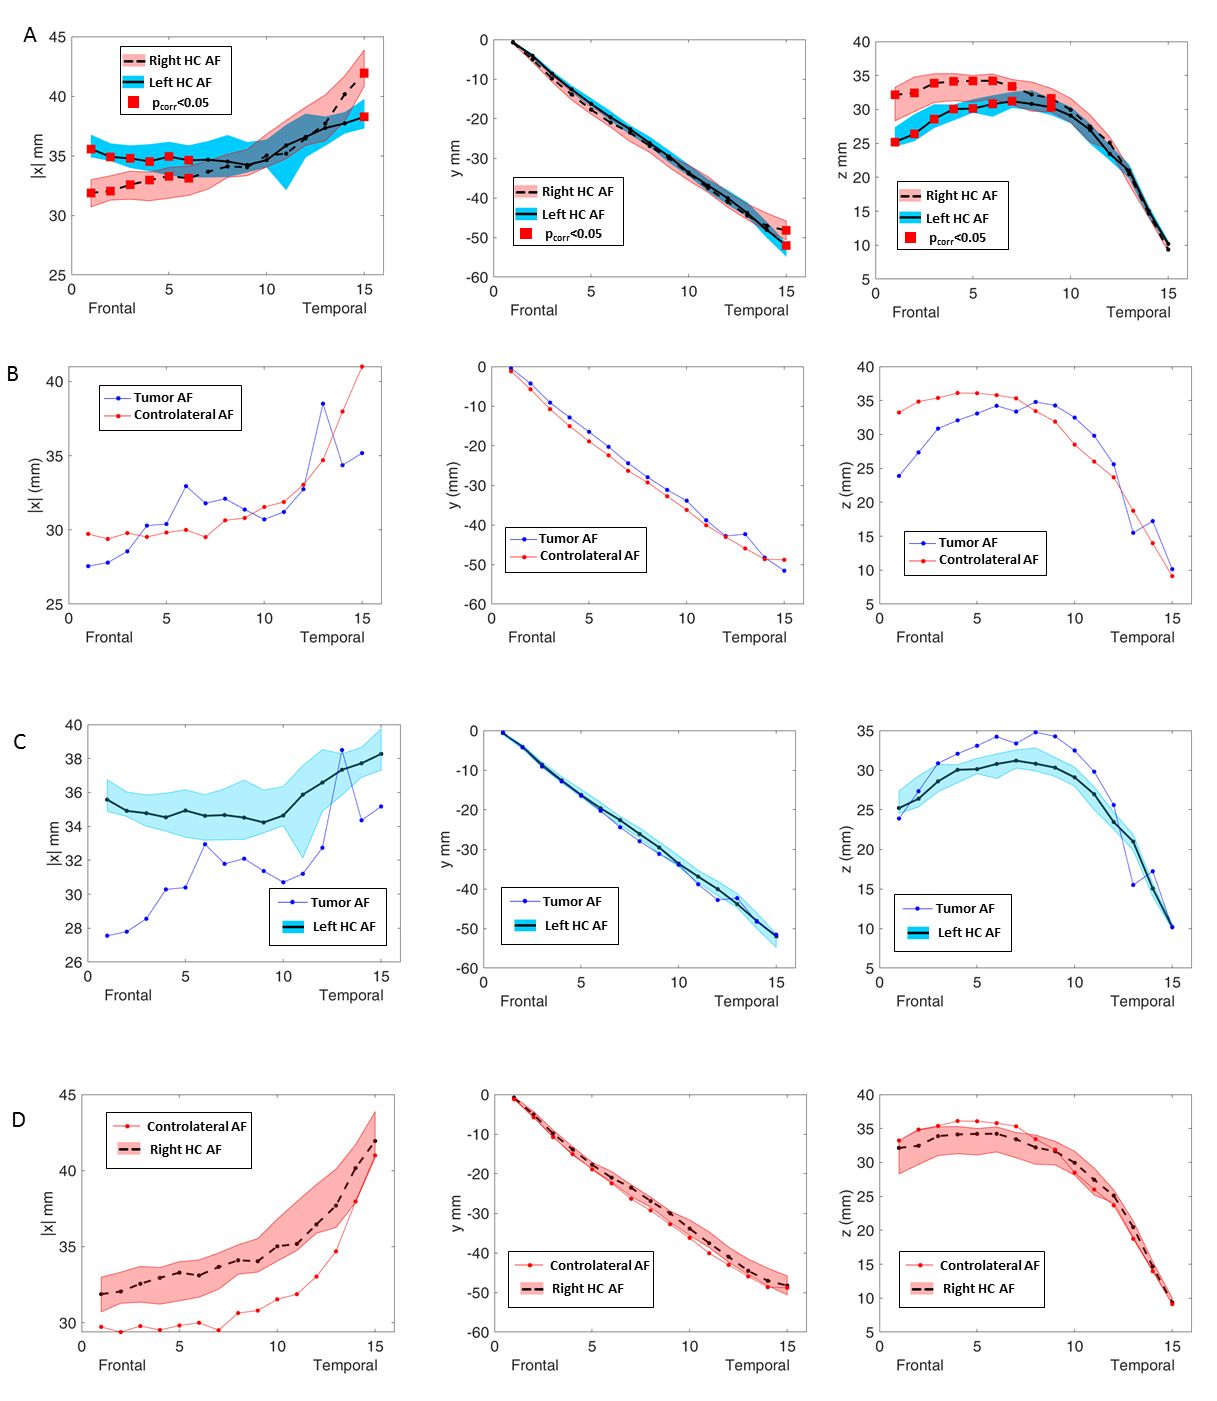
Fig.4
MNI centroid coordinates of arcuate fasciculus (AF) segments.
A: Healthy controls’ (HC) right (R) and left (L) coordinates along with the interquartile range (shaded area). The red squares marked L-R differences (p-value < 0.05 FDR corrected).
B: Patient’s AF coordinates in presence of a L frontal tumor (blue) and the contralateral side (red).
C: L AF coordinates for both HC (black line, blue interquartile area) and L tumor patient side (blue).
D: R AF coordinates, for both HC (black dashed line and red interquartile area) and contralateral patient side (red).
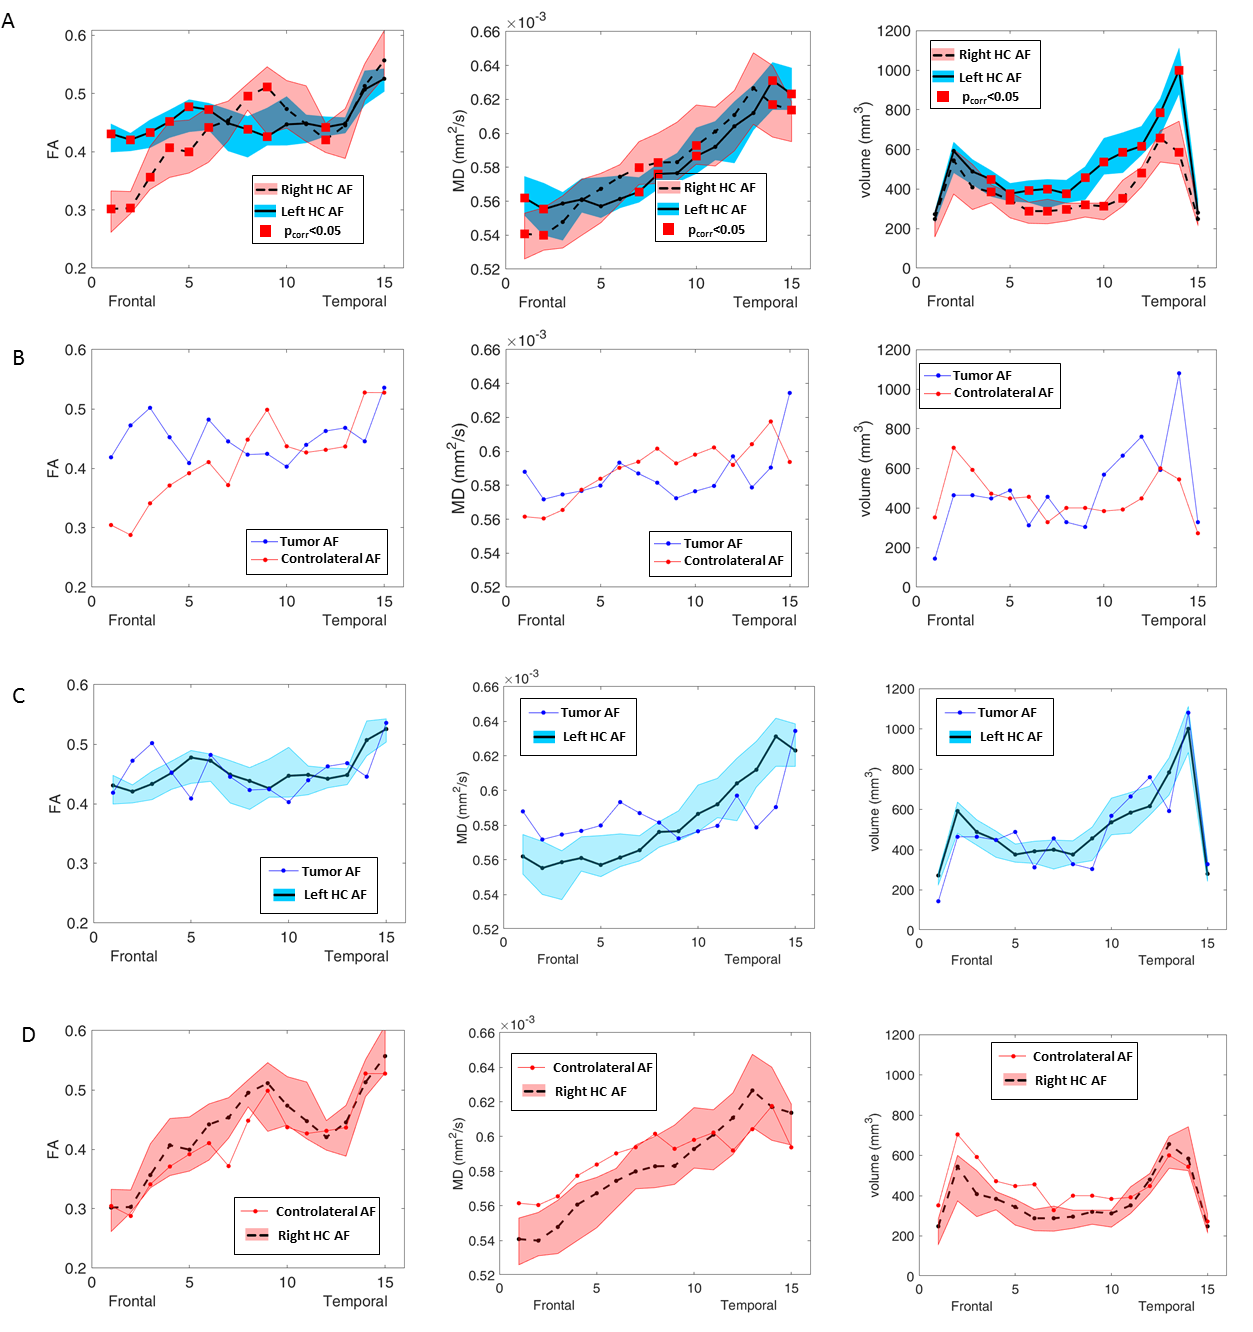
Fig.5
Healthy controls’ (HC) along-tract AF fractional anisotropy (FA), mean diffusivity (MD) and segment volume.
A: comparison between the right (R) and left (L) measures in HC, along with interquartile range (shaded area). The red squares mark significant L-R differences (p-value < 0.05, FDR correction).
B: Patient’s AF measures in presence of L frontal tumor (blue) and in the contralateral side (red).
C: L AF measures for both HC and for the L tumor patient (blue).
D: R AF measures for both HC and for contralateral patient’s side (blue).