1736
Track-density imaging (TDI): Evaluating the peritumoral white matter areas of glioblastoma
Gao Ankang1, Chen Qianqian1, Zhu Jinxia2, Stefan Huwer3, Bai Jie1, and Cheng Jingliang1
1MRI, Dept. of MRI, The First Affiliated Hospital of Zhengzhou University, Zhengzhou, China, 2MR Collaboration, Siemens Healthcare Ltd., Beijing, China, Beijing, China, 3Siemens Healthcare GmbH, Erlangen, Germany, Erlangen, Germany
1MRI, Dept. of MRI, The First Affiliated Hospital of Zhengzhou University, Zhengzhou, China, 2MR Collaboration, Siemens Healthcare Ltd., Beijing, China, Beijing, China, 3Siemens Healthcare GmbH, Erlangen, Germany, Erlangen, Germany
Synopsis
By observing the gradually developing characteristics of track density in the area of peritumoral edema, the extent of possible tumor invasion was judged. This may contribute to neurosurgical planning, the postoperative quality of life, and longer survival expectancy. Simultaneously, TDI was able to show the crossing fibers of the tumor part but could not resolve the disturbed diffusion of severe peritumoral edema’s influence on the fibers.
Background and Purpose
Glioblastoma cell invasion may lead to peritumoral edema and cause the disruption of fibers, leading to changes in track density [1]. High Angular Resolution Diffusion Imaging (HARDI) is a promising sequence that shows tumor crossing fibers and the fibers in edematous areas [2]. This study evaluated the changes in track density of different degrees of peritumoral edema to infer potential glioblastoma invasion.Methods
In total, 32 patients with pathologically confirmed IDH wild-type glioblastoma were recruited. All the patients underwent MR examinations on a 3T system (MAGNETOM Prisma, Siemens Healthcare, Erlangen, Germany) less than one week before surgery. The MR protocols included HARDI, T2-weighted imaging, and contrast-enhanced T1-weighted imaging. The HARDI images were acquired using the following parameters: TR/TE =3800/72 ms, FOV = 220×220 mm2, matrix = 128×128, slice thickness = 2.2 mm, slices = 60, 64 diffusion gradient directions, and b-values = 0, 3000 s/mm2. Whole-brain track-density imaging (TDI) maps were generated using a post-processing prototype (TDI and Tractography, Siemens Healthcare, Erlangen, Germany) [4], [5], [6] with the following parameters: degree of response function and fiber orientation density (FOD) = 6*, number of tracks = 1000000, voxel resolution of TDI map = 0.5mm. The target area of peritumoral edema was chosen according to the following criteria: larger than 6 mm (vertical distance from the edge of the tumor); a site where there was no sign of T1 enhancement; and a site where the track density was greater than 0. Peritumoral edema was divided into two groups, the first with a track density equal to 0 and the second with a track density larger than 0. The T2 signal intensity (T2SI) was calculated to observe the degree of edema. Regions of interest (ROIs) were manually drawn around the peritumoral edema track density maps according to the position (ENT: distance to tumor < 2 mm; EFT: distance to tumor > 4 mm; and ORE: near the boundary of edema). The track densities of contralateral normal areas were selected as the reference. The ratios of track density between the contralateral normal white matter and peritumoral white matter areas were calculated and defined as rENT, rEFT, and rORE. In addition, the rate of track density change between ENT and EFT was defined as Rate 1, and the rate of change between EFT and ORE was defined as Rate 2. All the values were expressed as mean ± standard deviation. Comparative analyses between different areas were performed using the paired-sample t-test. The independent t-test was used to compare the T2SI of the peritumoral edema groups. The statistical analysis was performed using SPSS V21.0 (IBM Corp., Armonk/NY, USA). A value of P < 0.05 was considered to be statistically significant.Results
The peritumoral edema in the group with a track density equal to 0 had a significantly higher T2SI (1112 ± 174[BM(DMM1] ) than the group with a track density greater than 0 (889 ± 63), and the cut-off value of T2SI = 962 (sensitivity = 94%, specificity = 90%) was used as a reference to select the target peritumoral edema. Both rENT (0.28 ± 0.23) and rEFT (0.33 ± 0.29) were significantly lower than rORE (0.55 ± 0.33) (all P < 0.05). However, there was no significant difference between Rate 1 and Rate 2 (P = 0.823). When peritumoral edema T2SI was greater than 990, the track density trended towards 0. In almost all the tumor part with T1 enhancement of GBM, the track could be observed.Discussion
The application of TDI can quantitatively evaluate the track density. The distance close to the tumor track density was lower than the farther area, which may serve as an important reference for the assessment of tumor invasion and the surgical resection range. Unfortunately, not all the peritumoral edema regions were able to show the track density on TDI, and we obtained the value of T2SI > 962, where the track density was equal to 0. Thus, to some extent, this did not solve the disturbed diffusion of the edematous area (T2SI > 962) on the fiber tractography or the fact that severe edema may break the fibers [3]. The tumor part with T1 enhancement could be found as the fibers were evident on TDI; this perhaps proves that some tumor areas have crossing, kissing, diverging, or highly curved fibers [1].Conclusion
TDI may serve as an important reference for the assessment of tumor invasion for planning an accurate range of operations and observing crossing fibers, which is important for reducing operative recurrence.Acknowledgements
No acknowledgement found.References
[1] Eidel O, Burth S, Neumann JO et al. Tumor Infiltration in Enhancing and Non-Enhancing Parts of Glioblastoma: A Correlation with Histopathology[J]. PLoS ONE, 2017, 12(1):e0169292. [2]Barajas RF, Hess CP, Phillips JJ et al. Super-Resolution Track Density Imaging of Glioblastoma: Histopathologic Correlation[J]. American Journal of Neuroradiology, 2013, 34(7):1319-1325. [3]Descoteaux M, Deriche R, Thomas R. Knösche et al. Deterministic and probabilistic tractography based on complex fiber orientation distributions[J]. IEEE Transactions on Medical Imaging, 2009, 28(2):269-286. [4] Tournier JD, Calamante F, Connelly A, Robust determination of the fibre orientation distribution in diffusion MRI: Non-negativity constrained super-resolved spherical deconvolution, NeuroImage 2007,35:1459-1472 [5] Calamante F, Tournier JD, Jackson GD, Connelly A, Track-density imaging (TDI): Super-resolution white matter imaging using whole-brain track-density mapping, NeuroImage 2010, 53:1233-1243 [6] Tournier JD, Calamante F, Connelly A, Improved probabilistic streamlines tractography by 2nd order integration over fibre orientation distributions, Proc. Intl. Soc. Mag. Reson. Med. 2010, 18Figures
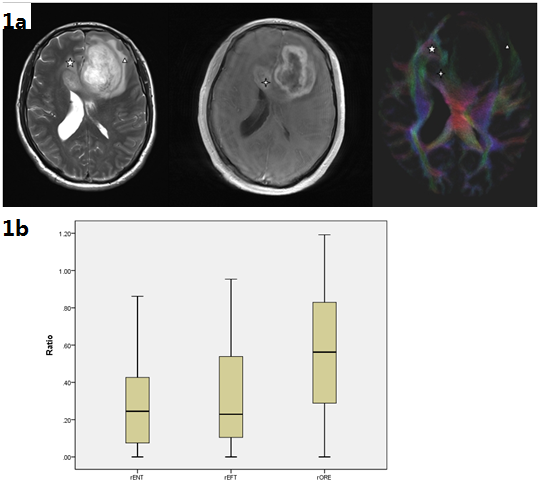
Figure 1a. A 48-year-old male with
glioblastoma.
Figure
shows target peritumoral edema (Pentagram) in
the part of GBM with T1 enhancement
tumor, the site where TDI shows the existence of fibers (Four-pointed star), peritumoral edema
where T2SI = 1290, and TDI shows where no fibers exist (Δ ).
1b. Box-and-whisker plots
showing the distribution of the rENT, rEFT, and rORE values. Both rENT and rEFT
were significantly lower than rORE (all P < 0.05).