1735
Tumor Grading of Glioma by Histogram Analysis Based on Multiple Advanced Diffusion Models, including DTI, DKI, MAP-MRI and NODDI
Gao Ankang1, Zhang Huiting2, Yang Guang3, Wang Shaoyu2, Yan Xu2, Bai Jie1, and Cheng Jingliang1
1MRI, Dept. of MRI, The First Affiliated Hospital of Zhengzhou University, Zhengzhou, China, 2MR Scientific Marketing, Siemens Healthcare, Shanghai, China, 3Shanghai Key Laboratory of Magnetic Resonance, East China Normal University, Shanghai, China
1MRI, Dept. of MRI, The First Affiliated Hospital of Zhengzhou University, Zhengzhou, China, 2MR Scientific Marketing, Siemens Healthcare, Shanghai, China, 3Shanghai Key Laboratory of Magnetic Resonance, East China Normal University, Shanghai, China
Synopsis
Diffusion imaging is widely used to noninvasively detect the microscopic diffusion properties of biological tissues in vivo. Advanced diffusion models were recently proposed to provide additional microstructure information. In present work, we applied four diffusion models in glioma grading, including DTI, DKI, MAP-MRI and NODDI model, which could be acquired within a single scan.
Background and Purpose
Diffusion imaging is widely used to noninvasively detect the microscopic diffusion properties of biological tissues in vivo. Advanced diffusion models were recently proposed to provide additional microstructure information. This study aimed to evaluate the performance 4 diffusion models in glioma grading, including Diffusion tensor imaging (DTI), Diffusion kurtosis imaging (DKI), Mean apparent propagator (MAP)-magnetic resonance imaging (MRI), and Neurite orientation dispersion and density imaging (NODDI) models. A single and comprehensive acquisition scheme was used for all the four models. Histogram features were extracted from parameters of these diffusion models and used in grading of glioma.Materials and Methods
Patients and MRI The institutional review board approved this prospective study, and informed consent was obtained from all patients. Totally 41 patients were recruited, including 15 low-grade glioma (WHO II, III) and 26 high-grade glioma (WHO IV). All the patients underwent diffusion weighted imaging (DWI) and conventional MRI examinations on a 3T MR scanner (MAGNETOM Prisma; Siemens Healthcare, Erlangen, Germany) with a 64 channel of head-neck coil. DWI was performed using a spin-echo echo-planar imaging sequence and the parameters were: FOV = 220 × 220 mm2, slice thickness = 2.0 mm, slices = 66, TR/TE = 3700/72 ms, in-plane acceleration factor = 2, slice acceleration factor = 2, diffusion time δ/Δ = 15.9/35.0 ms, two b=0 data and 98 diffusion images with different diffusion gradient directions and bmax= 3000 s/mm2. The DTI, DKI, MAP, and NODDI parameters were calculated using an in-house developed post-processing software called NeuDiLab, which is based on an open-resource tool DIPY (Diffusion Imaging In Python, http://nipy.org/dipy). The calculated parameters were as follows: fractional anisotropy (FA), axial diffusivity (AD), radial diffusivity (RD) and mean diffusivity (MD) from DTI and DKI; axial kurtosis (AK), radial kurtosis (RK) and mean kurtosis (MK) from DKI; mean squared displacement (MSD), return to the origin probability (RTOP), return to-the plane probability (RTPP), return to the axis probability (RTAP), Q-space Inverse Variance (QIV), perpendicular non-Gaussianity (NG⊥), parallel non-Gaussianity (NG//) and non-Gaussianity (NG) from MAP-MRI; intracellular volume fraction (ICVF), orientation dispersion index (ODI) and isotropic volume fraction (ISOVF) from NODDI. The ROI drawn The region-of-interest (ROI) was manually drawn around the entire tumor on axial T2-weighted images or axial post-contrast 3D T1-weighted magnetization prepared rapid acquisition with gradient echo (MPRAGE) images. Then the ROIs were copy to all the calculated diffusion maps. Then, the histogram features of all parameters were automatically extracted from their corresponding ROIs. Histogram Analysis A statistical model based on histogram features was constructed to predict glioma grading using FeAture Explorer software (FAE, v0.1.1, https://github.com/salan668/FAE). The main technological processes were as follows. First, the normalization and clean of feature was performance. In order to balance the two sets of samples, the data of negative group was up-sampled. 41 cases were selected as the training and validation data set. Then, the dimension of the feature space was reduced. If the cosine value of the feature pair was larger than 0.86, one of them was randomly removed. Before model development, recursive feature elimination (RFE) was used to select features. Logistic regression was used as the classifier. A hyper-plane was searched in the high dimension to separate the samples. To prove the performance of the model, cross validation with 10-folder on the data set was applied. Finally, The performance of the model was evaluated using receiver operating characteristic (ROC) curve analysis and the area under the ROC curve (AUC). The accuracy, sensitivity, specificity, positive predictive value (PPV), and negative predictive value (NPV) were also calculated at a cutoff value equivalent to the maximum value of the Yorden index.Results
The clinical statistics and the selected features in the prediction model were shown in Table 1 and Table 2. Finally, four features, including the median of FA from DTI, the minimum value of AK, the 90 percentile of ODI, and the median of NG//, were used in the model to achieve AUC and accuracy at 0.899 and 0.904, respectively, which is the highest AUC on the validation data set. The ROC curve was shown in Figure 1.Discussion
As reported in previous studies [1-4], MD and MK were more useful in glioma grading. In this study, four diffusion models and histogram parameters were analysis here, and the results found that the combination of these models could generate the best overall prediction power for glioma grading. The optimized features combination are generated from four models (AK, FA, ODI, and NG// are from DKI, DTI, NODDI and MAP-MRI). The good performance of this combination may be due to the multiple dimension of the microstructure information these models offered.Conclusion
Histogram Analysis based on multiple diffusion models showed a great potential in glioma grading.Acknowledgements
No acknowledgement found.References
[1] Qi Xi-Xun, Shi Da-Fa, Ren Si-Xie, et al. Histogram analysis of diffusion kurtosis imaging derived maps may distinguish between low and high grade gliomas before surgery.[J]. European radiology,2018,28(4). [2] Hempel Johann-Martin, Brendle Cornelia, Bender Benjamin, et al. Diffusion kurtosis imaging histogram parameter metrics predicting survival in integrated molecular subtypes of diffuse glioma: An observational cohort study.[J]. Europe-an journal of radiology,2019,112. [3] A. Vamvakas,S.C. Williams,K. Theodorou, et al. Imaging biomarker analysis of advanced multiparametric MRI for glioma grading[J]. Physica Medica,2019,60. [4] Raja Rajikha, Sinha Neelam, Saini Jitender, et al. Assessment of tissue heterogeneity using diffusion tensor and diffusion kurtosis imaging for grading gliomas. [J]. Neuroradiology,2016,58(12).Figures
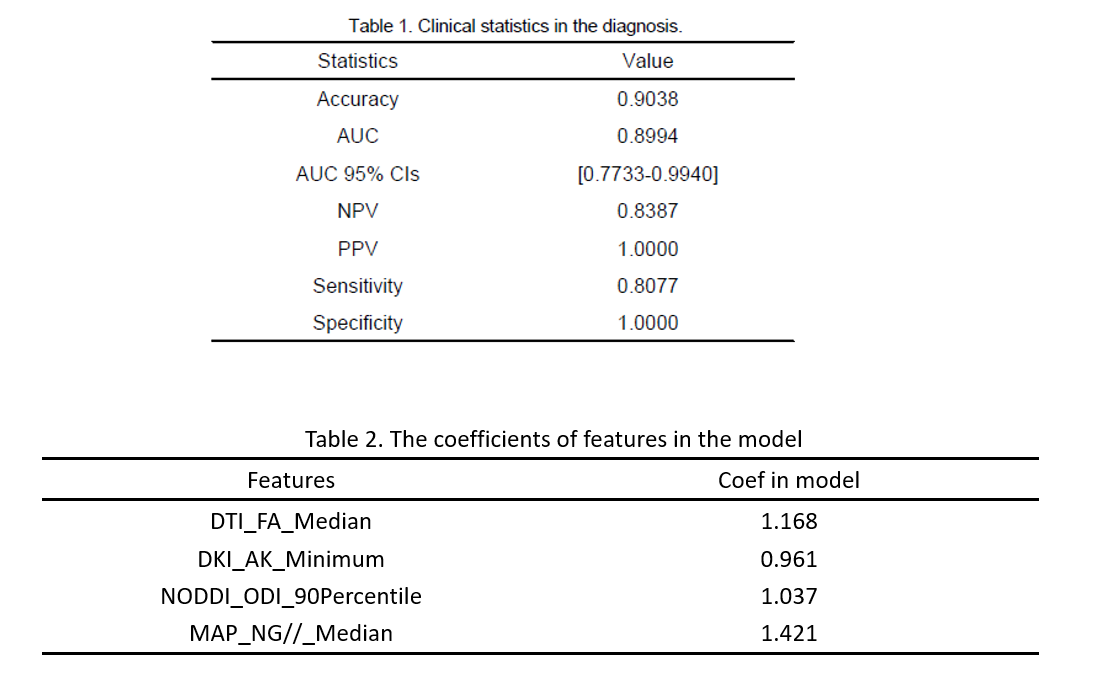
Table1 and Table 2
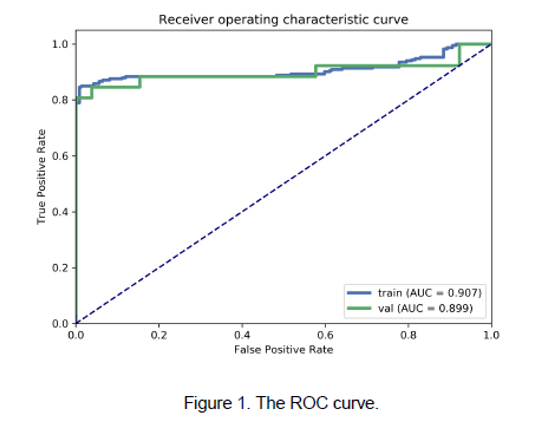
Figure 1. The ROC curves for radiomics
model on the training and validation data set