1734
Non-invasive separation of low and high grade gliomas with diffusion kurtosis decomposition (DKD)1Zhongnan Hospital of Wuhan University, Wuhan, China, 2UIH America, Inc., Houston, TX, United States, 3United Imaging Healthcare, Shanghai, China, 4Random Walk Imaging, Lund, Sweden, 5Lund University, Lund, Sweden
Synopsis
Diffusion kurtosis decomposition (DKD) is a novel advanced diffusion MRI modality relying on customized pulse sequences and high-performance hardware to assess cell shapes and density heterogeneity via the anisotropic and isotropic mean kurtosis parameters, MKa and MKi, which are fundamentally different microstructural properties that are inextricably entangled in conventional diffusion kurtosis imaging (DKI). We have investigated DKD imaging of gliomas in a clinical setting, and for the first time established the correlations between MKa, MKi, and tumor grade. In comparison to conventional diffusion methods, DKD more accurately describes the microstructural changes and provides a useful tool for glioma diagnosis.
Introduction
Glioma is the most common malignant primary brain tumor.1 Progression from low to high grade glioma (LGG and HGG) coincides with microstructural changes related to cell shape and density heterogeneity which may be assessed via the anisotropic and isotropic mean kurtosis parameters, MKa and MKi, obtained from the advanced diffusion MRI modality diffusion kurtosis decomposition (DKD).2-5 MKa characterizes the microscopic anisotropy independent of the subvoxel structure alignment, while MKi measures the isotropic diffusivity dispersion which is often related to the cell density variation (Fig. 1). The fundamentally different microstructural properties captured in the MKa and MKi metrics are entangled in the DKI6 parameter mean kurtosis (MK), which is generally interpreted in terms of “tissue complexity”.1 As opposed to the diffusion tensor imaging (DTI) metrics MD and FA,7 the MK parameter from DKI is significantly higher in HGG than in LGG.1 While DTI and DKI can be performed with off-the-shelf pulse sequences, the additional information in DKD relies on customized sequences and high-performance hardware allowing for high-amplitude and rapidly slewing gradient waveforms in three dimensions. Here we investigate DKD imaging of gliomas in a clinical setting, and establish correlations between MKa, MKi, and tumor grade. In comparison to conventional diffusion methods, DKD more accurately describes the microstructural changes and provides a useful tool for glioma diagnosis.Methods
Forty-one glioma patients (13 LGG and 28 HGG) underwent MRI and subsequent surgery within one month. Glioma grade was determined from histological and molecular analysis of the resected tumor according to the 2016 WHO guidelines and tumors were classified as LGG (grades I and II) or HGG (grades III and IV). MRI was performed on a uMR 790 3.0 T scanner (United Imaging Healthcare, Shanghai, China) with a 24-channel head coil and 100 mT/m maximum gradient. Images were acquired with a custom spin-echo EPI sequence using TR = 3750 ms, TE = 84.9 ms, FA = 90°, slice thickness = 4 mm, whole brain coverage, FOV = 224×224 mm, matrix = 112×112, bandwidth = 1560 Hz/pixel, partial Fourier factor = 0.75, in-plane parallel imaging factor = 2 (anterior-posterior). Diffusion encoding was performed with 40 directional and 40 isotropic encodings8 using optimized gradient waveforms9,10 for b = 100, 700, 1400, 2000 s/mm2, and 6, 6, 12, 16 directions or averages, giving a total scan time of ~5 min. After motion and eddy current correction, the per-voxel signals were powder-averaged and analyzed with the Gamma distribution model to extract MKa, MKi, and total mean kurtosis MKt=MKa+MKi parameter maps.2-5 ROIs delineating solid tumor were defined by two radiologists in consensus using T1 images for contrast-enhancing tumors and T2/T2 FLAIR images for non-enhancing ones. Non-linear image registration was performed between anatomical and EPI images to project ROIs onto the parameter maps.11 DKD parameters with normal/non-normal distribution (by Shapiro-Wilk test) were compared between groups using two sample t-test or Mann–Whitney U test, p < 0.05 was considered significant. ROC analysis was applied to determine optimal cutoff values for classifying HGG/LGG according to the maximal Youden index.Results & Discussion
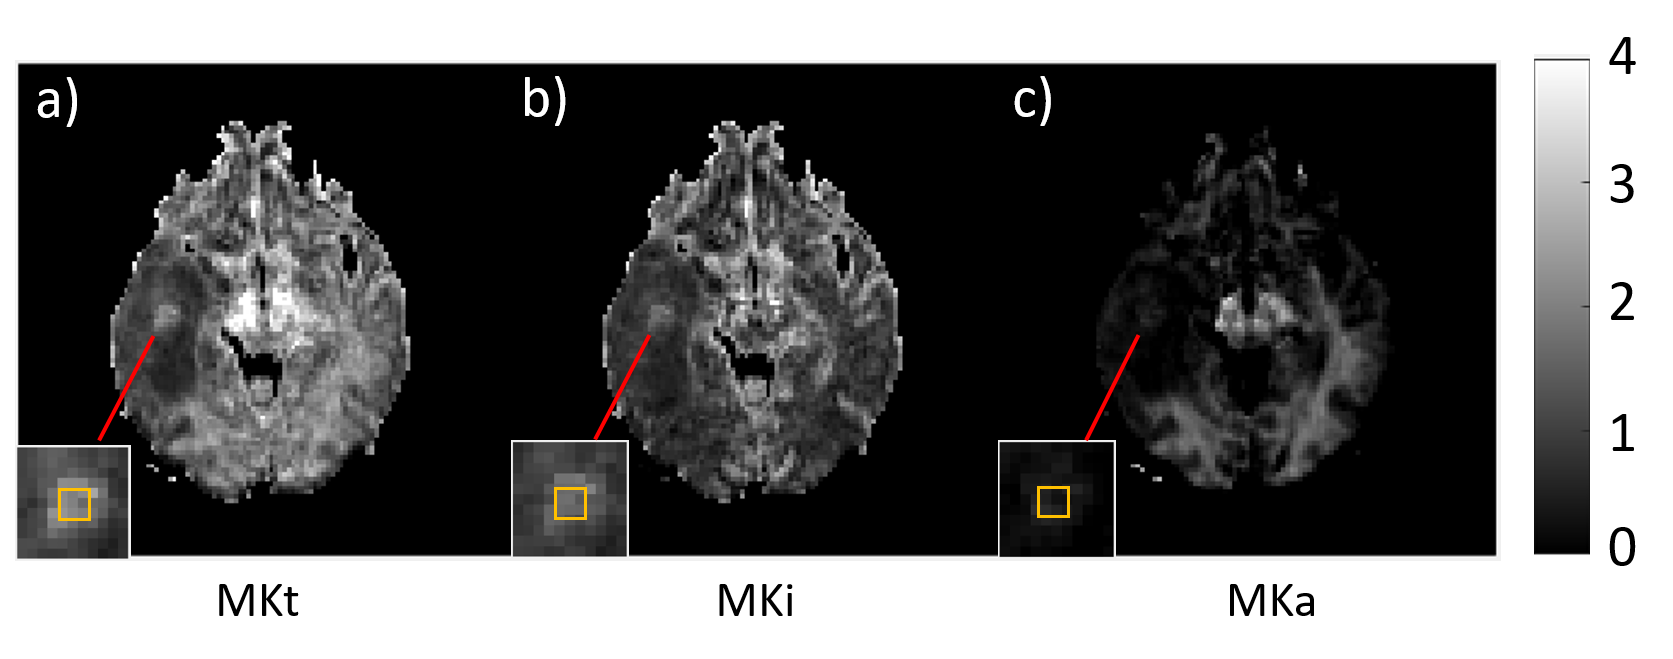
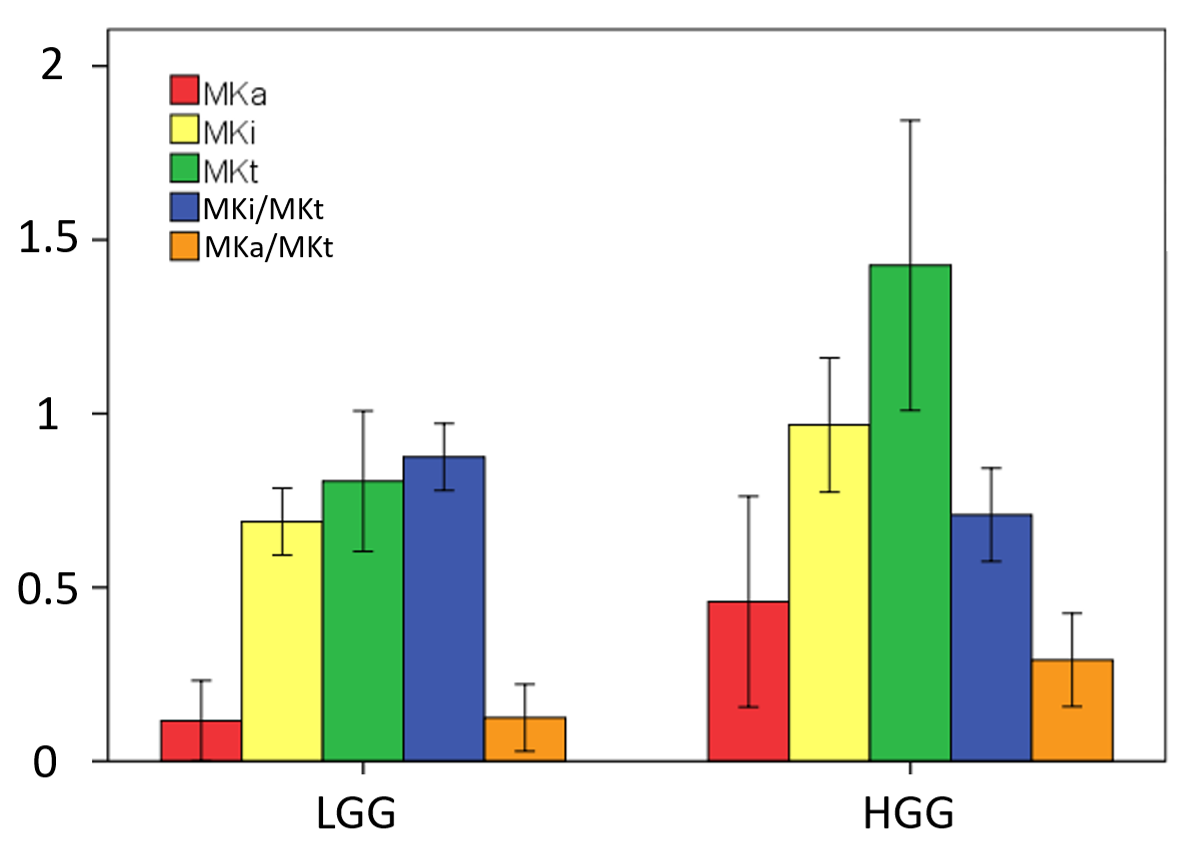
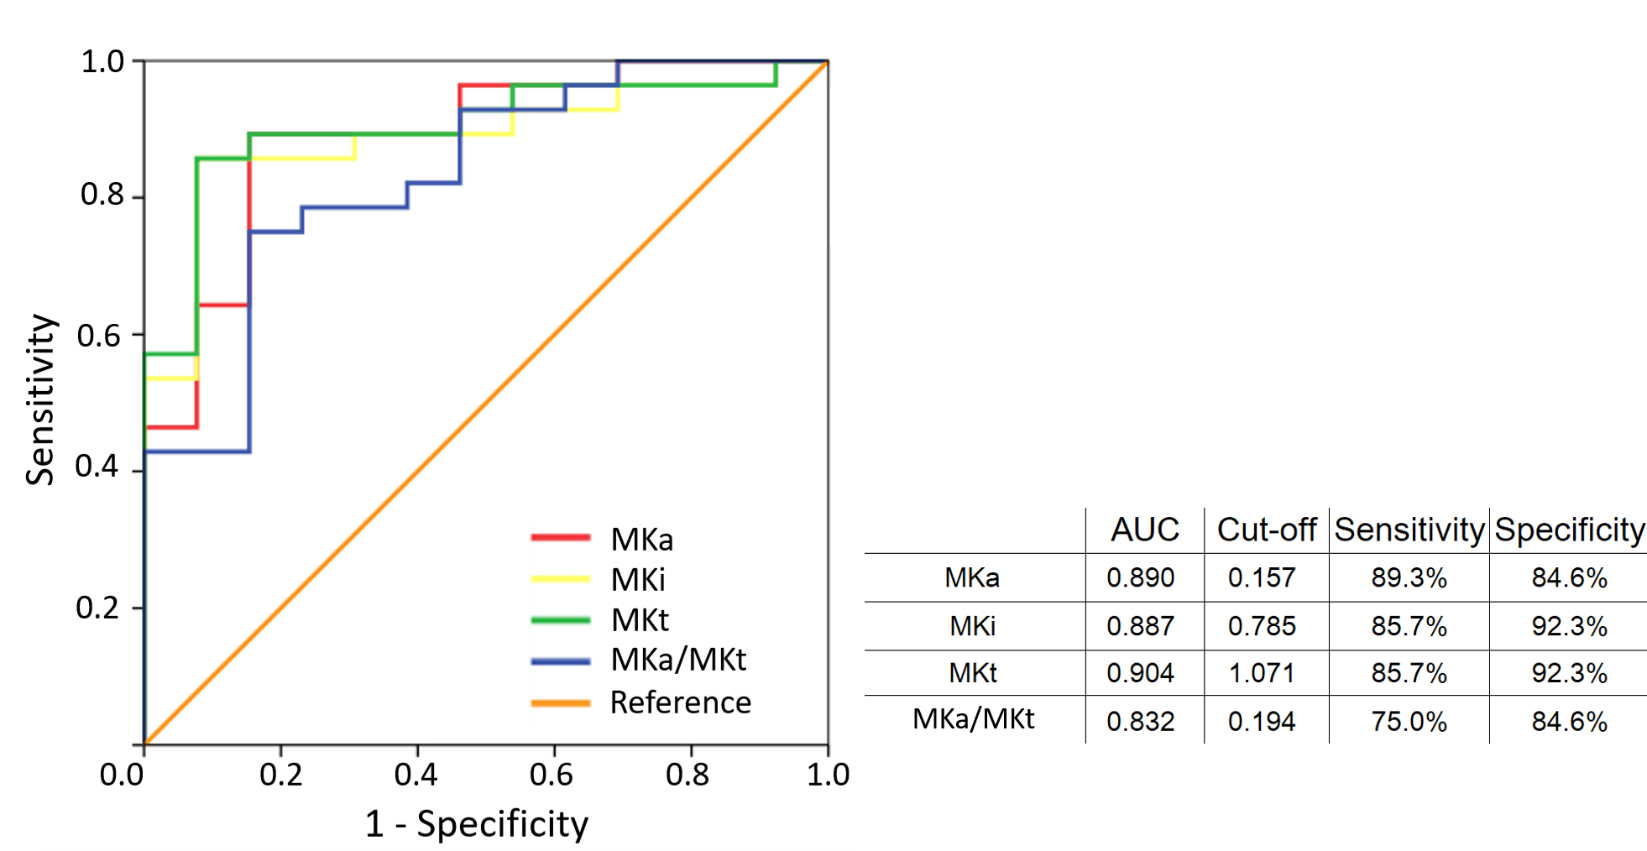
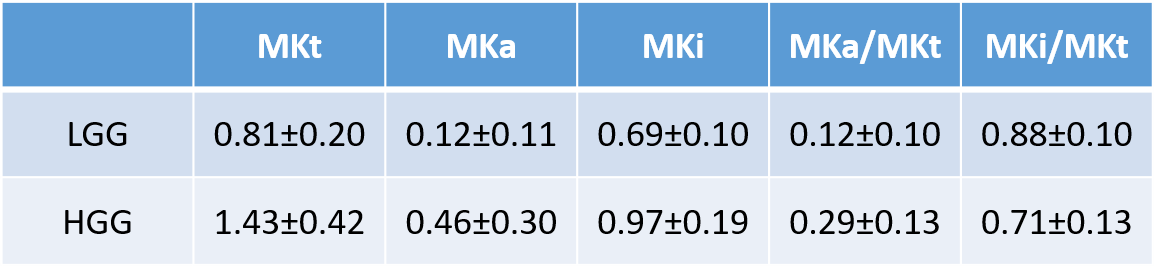
Fig. 2 shows parameter maps of a grade IV tumor. While high values of MKi (1.70 ± 0.14) in the tumor correspond to high intra-voxel heterogeneity in cell density, likely related to cell proliferation, the low but finite values of MKa (0.38 ± 0.11) indicate that the cells are more elongated in the tumor than in its surroundings. The fundamentally different microstructural information from MKa and MKi are combined in the MKt parameter (2.09 ± 0.19). DKD metrics of the tumors are summarized in Table 1 and Fig. 3. While MKa, MKi, and MKt are all significantly higher in HGG than in LGG (p < 0.001, p < 0.001, p < 0.001 respectively), MKi is larger than MKa in both LGG (p = 0.001) and HGG (p < 0.001) by Wilcoxon signed-rank test. The ratio MKa/MKt is significantly higher in HGG than in LGG (p < 0.001). Correspondingly, MKi/MKt is significantly lower in HGG than in LGG (p < 0.001). ROC curves for MKa, MKi, and MKt are shown in Fig. 4, with AUC 0.89, 0.89, and 0.90, respectively. The optimal cutoff values for classification are 1.07, 0.16, and 0.79, respectively.Conclusions
We have used a clinically feasible 5-min acquisition to non-invasively study cell shape and density heterogeneity represented by the parameters MKa and MKi in order to determine glioma grade (LGG versus HGG). Higher MKa and MKi were observed in HGG than in LGG. Cell density heterogeneity, captured by MKi, is the dominant contribution to the total mean kurtosis MKt especially in the LGG. The ratio MKi/MKt could therefore provide an important index to distinguish HGG and LGG. The novel metrics unveiled valuable microstructural information about gliomas, thereby providing exciting new opportunities for non-invasive glioma grading.Acknowledgements
Data collection was approved by the Wuhan hospital ethics committee and with written informed consent from all participants. This work was financially supported by the national key research and development plan of China (2017YFC0108803), the Swedish Foundation for Strategic Research (AM13-0090, ITM17-0267) and the Swedish Research Council (2018-03697). Daniel Topgaard owns shares in Random Walk Imaging (RWI) AB (Lund, Sweden, http://www.rwi.se/), holding patents related to the described methods. Markus Nilsson and Filip Szczepankiewicz are gratefully acknowledged for generously sharing know-how on pulse sequence setup acquired during their RWI-funded research and employment.References
- Van Cauter S, Veraart J, Sijbers J, Peeters RR, Himmelreich U, De Keyzer F, Van Gool SW, Van Calenbergh F, De Vleeschouwer S, Van Hecke W, Sunaert S. Gliomas: Diffusion kurtosis MR imaging in grading. Radiology 2012;263:492-501.
- Lasič S, Szczepankiewicz F, Eriksson S, Nilsson M and Topgaard D. Microanisotropy imaging: quantification of microscopic diffusion anisotropy and orientational order parameter by diffusion MRI with magic-angle spinning of the q-vector. Frontiers in Physics. 2014;2:1-13.
- Szczepankiewicz F, Lasič S, van Westen D, Sundgren PC, Englund E, Westin CF, Stahlberg F, Latt J, Topgaard D and Nilsson M. Quantification of microscopic diffusion anisotropy disentangles effects of orientation dispersion from microstructure: applications in healthy volunteers and in brain tumors. Neuroimage. 2015;104:241-52.
- Szczepankiewicz F, van Westen D, Englund E, Westin CF, Ståhlberg F, Lätt J, et al. The link between diffusion MRI and tumor heterogeneity: Mapping cell eccentricity and density by diffusional variance decomposition (DIVIDE). Neuroimage 2016; 142: 522–532.
- Topgaard D. Multidimensional diffusion MRI. J Magn Reson. 2017;275:98-113.
- Jensen JH, Helpern JA, Ramani A, Lu H, Kaczynski K. Diffusional kurtosis imaging: The quantification of non-Gaussian water diffusion by means of magnetic resonance imaging. Magn Reson Med 2005;53:1432-1440.
- Basser PJ, Pierpaoli C. Microstructural and physiological features of tissues elucidated by quantitative-diffusion-tensor MRI. J Magn Reson B 1996;111:209-219.
- Mori S, van Zijl PCM. Diffusion weighting by the trace of the diffusion tensor within a single scan. Magn Reson Med 1995;33:41-52.
- Sjölund J, Szczepankiewicz F, Nilsson M, Topgaard D, Westin C-F, Knutsson H. Constrained optimization of gradient waveforms for generalized diffusion encoding. J Magn Reson 2015;261:157-168.
- Szczepankiewicz F, Westin CF, Nilsson M. Maxwell-compensated design of asymmetric gradient waveforms for tensor-valued diffusion encoding. Magn Reson Med 2019;82:1424-1437.
- Tian Q, Wintermark M, Jeffrey Elias W, Ghanouni P, Halpern CH, Henderson JM, Huss DS, Goubran M, Thaler C, Airan R, Zeineh M, Pauly KB, McNab JA. Diffusion MRI tractography for improved transcranial MRI-guided focused ultrasound thalamotomy targeting for essential tremor. Neuroimage Clin 2018;19:572-580.
Figures
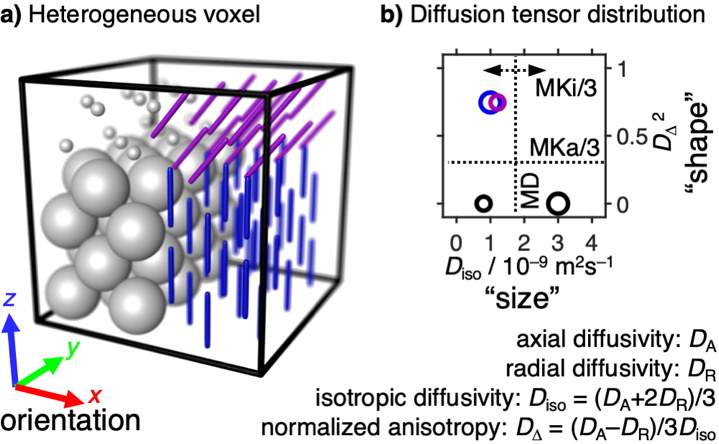
Figure 1: Illustration of the relation between tissue heterogeneity and the DKD metrics MKi and MKa. a) Schematic voxel (box) with multiple environments having distinct diffusion properties (tensor glyphs) given by tissue properties such as cell density, shape, orientation, and membrane permeability. b) Diffusion tensor distribution shown as a 2D “size”-“shape” scatter plot with color-coded orientations. The mean diffusivity (MD) is given by the average “size” while the DKD parameters MKi and MKa correspond to, respectively, the spread of “sizes” and average “shape”.5