1730
Differential diagnosis of solitary fibrous tumor/hemangiopericytoma and angiomatous meningioma using 3D-MRI texture feature model1First Affiliated Hospital of Dalian Medical University, Dalian,116011,China, Dalian, China, 2Department of Radiology, First Affiliated Hospital of Dalian Medical University, Dalian,116011,China, Dalian, China, 3Beijing Tiantan hospital, Beijing, China, 4Life science, Shenyang, China
Synopsis
Intracranial solitary fibrous tumor(SFT)/hemangiopericytoma (HPC) is a rare malignant tumor originating from the intracranial vasculature, while Angiomatous meningioma (AM) is also a rare benign one as a histological subtype of meningioma with World Health Origination (WHO) grade I. The two tumors have similar location and conventional MRI features, but the treatment and prognosis are quite different. Texture analysis can get more information that can't be seen in conventional MRI images. It is very necessary to establish the differentiation model of texture analysis between the two kinds of tumors.
Purpose
The purpose of this study is to use the texture parameters of conventional MRI sequences to build models through machine learning and to further improve the diagnostic ability of SFT/HPC and AM.Material and Method
The preoperative MRI were performed on 95 patients with AM (47 males and 50 females; mean age: 51.54±11.54 years) and 97 with SFT/HPC (47 males and 50 females; mean age: 42.97±14.35 years) at the first affiliated hospital of Dalian Medical University and Beijing Tiantan Hospital from May 2012 to March 2019. The imaging protocol included unenhanced axial and sagittal T1-weighted sequences, axial and coronal T2-weighted sequences, and contrast-enhanced axial, sagittal, and coronal T1-weighted sequences. The ITK-SNAP software was used to manually delineate the region of interest (ROI) of whole tumor in the edema range on T1WI, T2WI, and contrasted T1WI images without knowing the grouping(Fig.1). Then, the 3D ROI texture features (listed as Fig. 2) were extracted and analyzed using AK (Artificial intelligence kit) software.The texture feature Modeling was done using the language R (RStudio Version 1.0.143–© 2009-2016 RStudio, Inc.). Each group were classified into the train set (70%) to establish the model and the test set (30%) to verify the accuracy of the established model. Confusion matrix was used to analyze the accuracy of the model. ROC curve was constructed to assess the grading ability of logistic regression model.Result
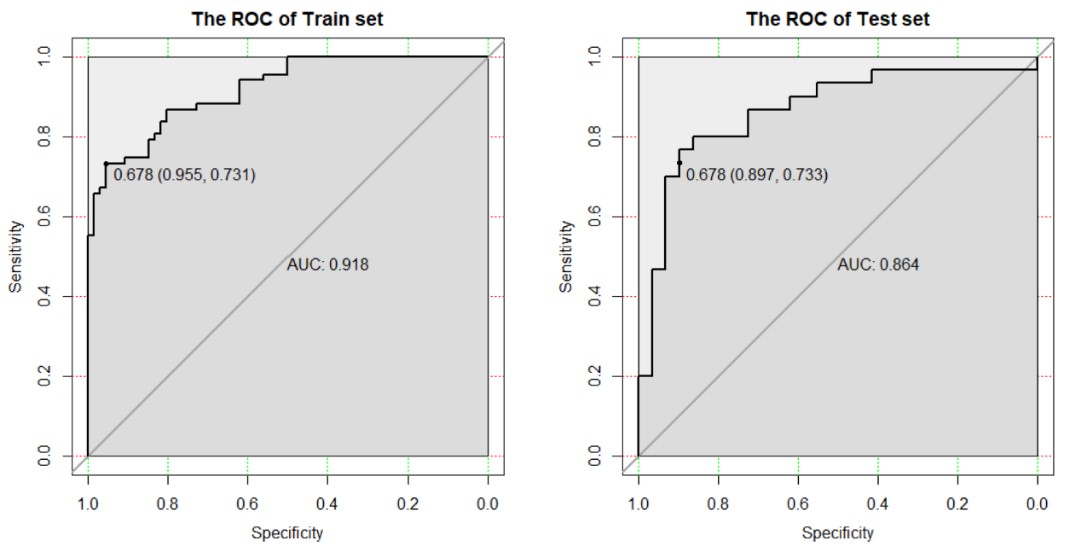
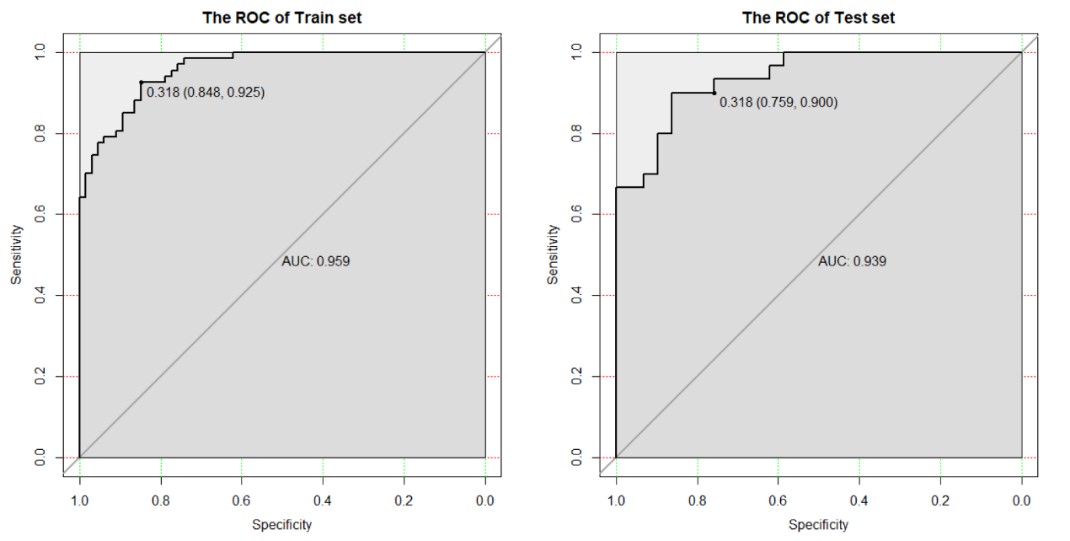
After Lasso dimension reduction, T1WI, T2WI and contrasted T1WI extracted 5, 9 and 7 texture features respectively, and the combined sequence extracted 8 texture features for modeling. The ROC analyses on four model resulted in an area under the curve (AUC) of 0.885 (sensitivity 76.1%, specificity 87.9%) for T1WI model, 0.918 (73.1%, 95.5%) for T2WI model, 0.815 (55.2%, 93.9%) for contrasted T1WI model, and 0.959 (92.5%, 84.8%) for the combined sequence model(Fig. 3-6), and correctly discriminated between the two groups in 71.2%, 81.4%, 69.5%, and 83.1% of cases in test set, respectively.Discussion and Conclusion
In this study, radiomics method was used to construct four models to identify the 3D-texture features of SFT/HPC and AM based on conventional MRI sequence images. As a non-invasive predictive method, all four models can provide reference information for preoperative treatment planning and patient prognosis. To the best of our knowledge, this was the first study to establish an MRI radiological model to differentiate SFT/HPC from AM. Texture features are important markers of intratumoural homogeneity. Of the twenty-three texture features that were involved in building four models in our study, Eight were histogram based features, twelve were matrix based features, including five GLCM features, and one Haralick feature. There are six GLRM features, and the remaining three GLZSM features. Histogram-based features are first-order statistics that rely primarily on statistics on intensity information (or brightness information) within and around the tumor, and then investigate the overall distribution of intensity information within and around the tumor. Matrix-based features were second-order statistics that can be used to describe the complexity within the tumor and around the tumor, the changes in the hierarchy, and the thickness of the texture. LRLGLE measures the joint distribution of longer run lengths with lower grey-level values. SRE is a measure of short lengths, with larger values representing shorter lengths and finer textures. GLZSM is particularly efficient to characterize the texture homogeneity, nonperiodicity or speckle like texture. Our texture analysis results also form the basis for further radiomics analyses, which extract innumerable quantitative features from various kinds of digital images, and are a rapidly expanding research area[1,2].Acknowledgements
No acknowledgement found.References
[1] I H, A K, As B, et al. Radiomic Texture Analysis Mapping Predicts Areas of True Functional MRI Activity[J]. Scientific reports, 2016, 6(undefined): 25295.
[2] Hj A. The Potential of Radiomic-Based Phenotyping in Precision Medicine: A Review[J]. JAMA oncology, 2016, 2(12): 1636-1642.
Figures