1729
Prediction of high-grade glioma prognosis based on radiomics features of tumor and peritumoral edema areas from magnetic resonance imaging1Chongqing University Cancer Hospital & Chongqing Cancer Institute & Chongqing Cancer Hospital, ChongQing, China, 2Philips Healthcare, Shanghai, China
Synopsis
To build a radiomics signature from MR images to predict high grade glioma (HGG, WHO grade III and IV) patients with different prognosis. Then, to explore the predictive value based on the edge of the tumor area and PBZ, respectively.
Background
Glioma is the most common and aggressive tumor originating in the brain. It comprises about 33 percent of all brain tumors. Previous studies show that more than 70% gliomas are high grade glioma (HGG, WHO grade III and IV) [1]. Most patients with HGG still face grimly prognosis despite gross total resection followed by radio-chemotherapy as therapy of choice. Although the same treatment is chosen, a small percentage of HGG patients have a longer survival period [2]. Five-year survival rates are 5.6% to 51.6% for HGG [1]. This is due to the heterogeneity of tumor that determines the survival of patients with HGG [3]. Prognosis prediction for HGG patients is critical to making treatment decisions. For example, early postoperative radiotherapy and chemotherapy is beneficial to delay the survival of patients [4, 5]. Some previous studies [6-8] have focused on identifying factors impacting the prognosis of HGG, Such as the grade of World Health Organization (WHO), the subject’s age, Karnofsky Performance Status (KPS) and molecular profiling.Materials and methods
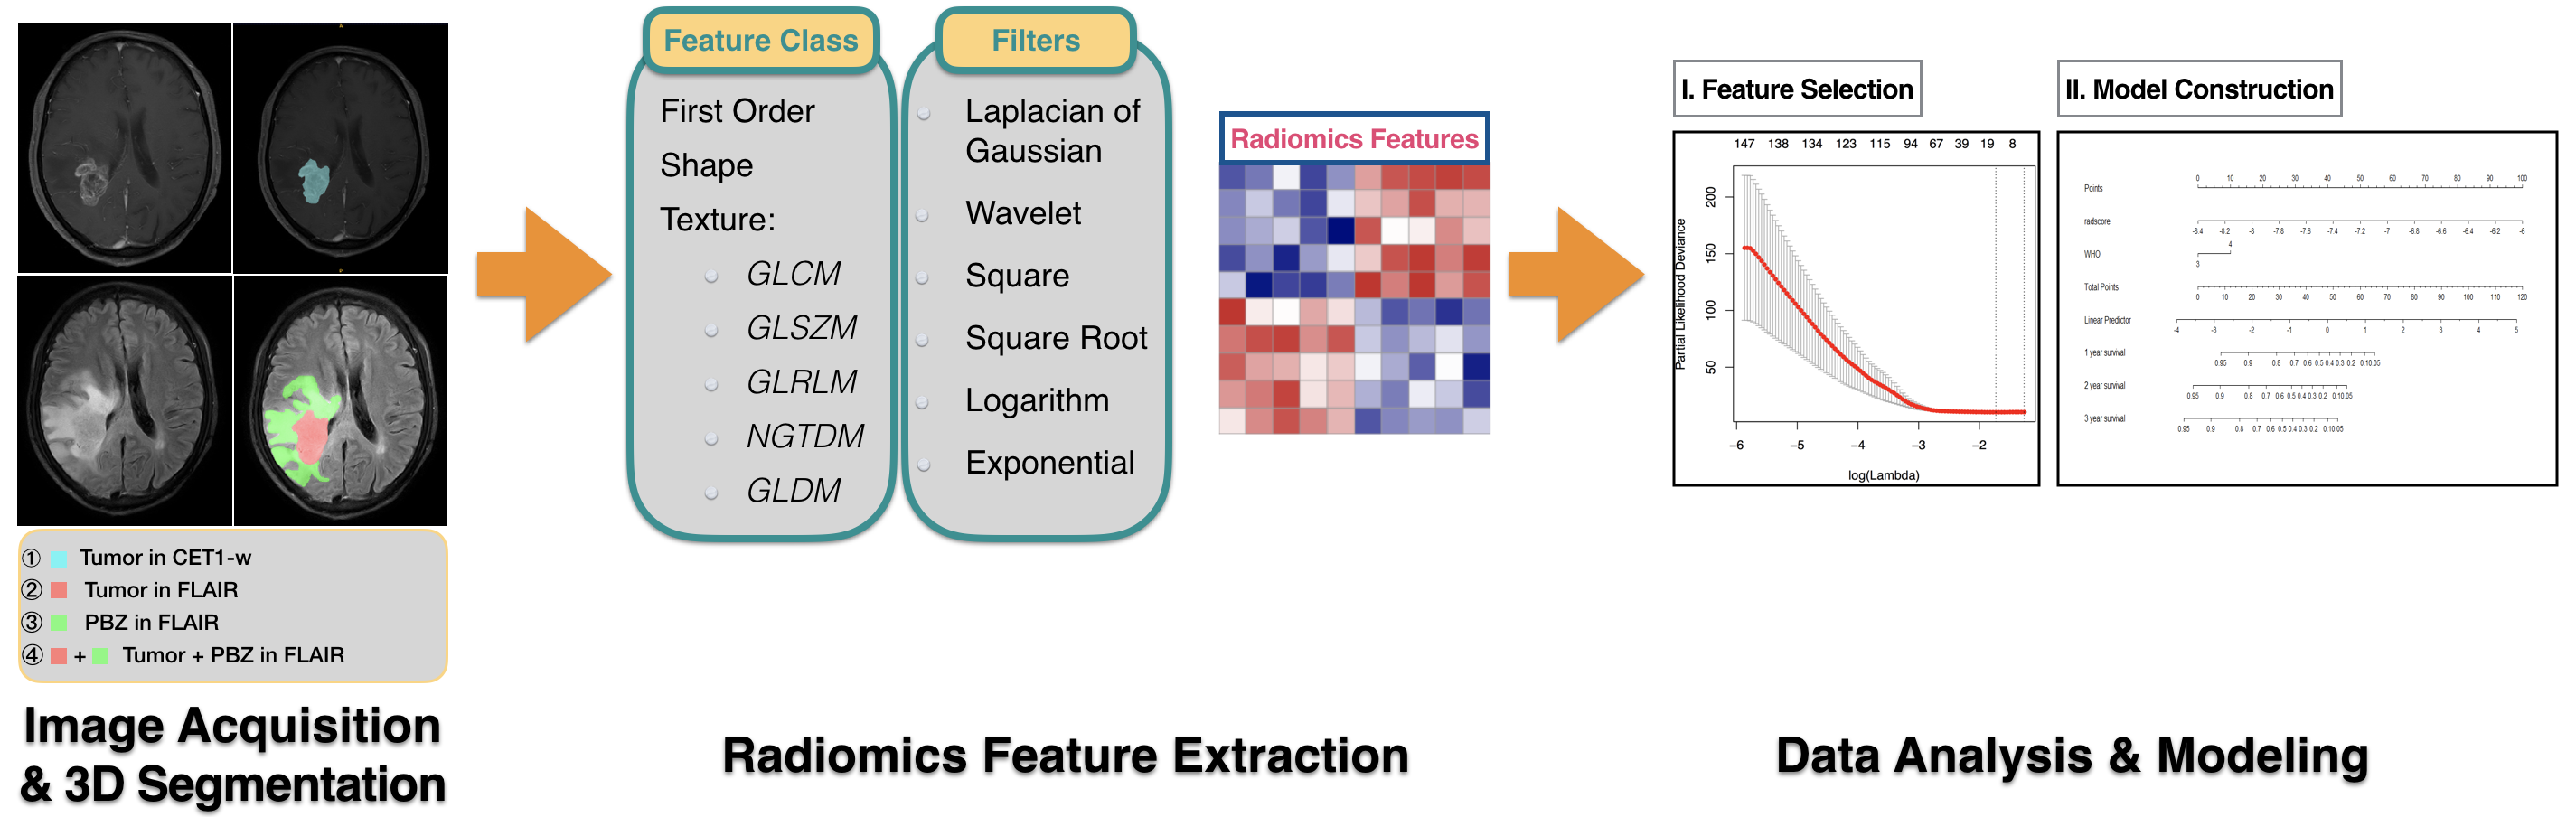
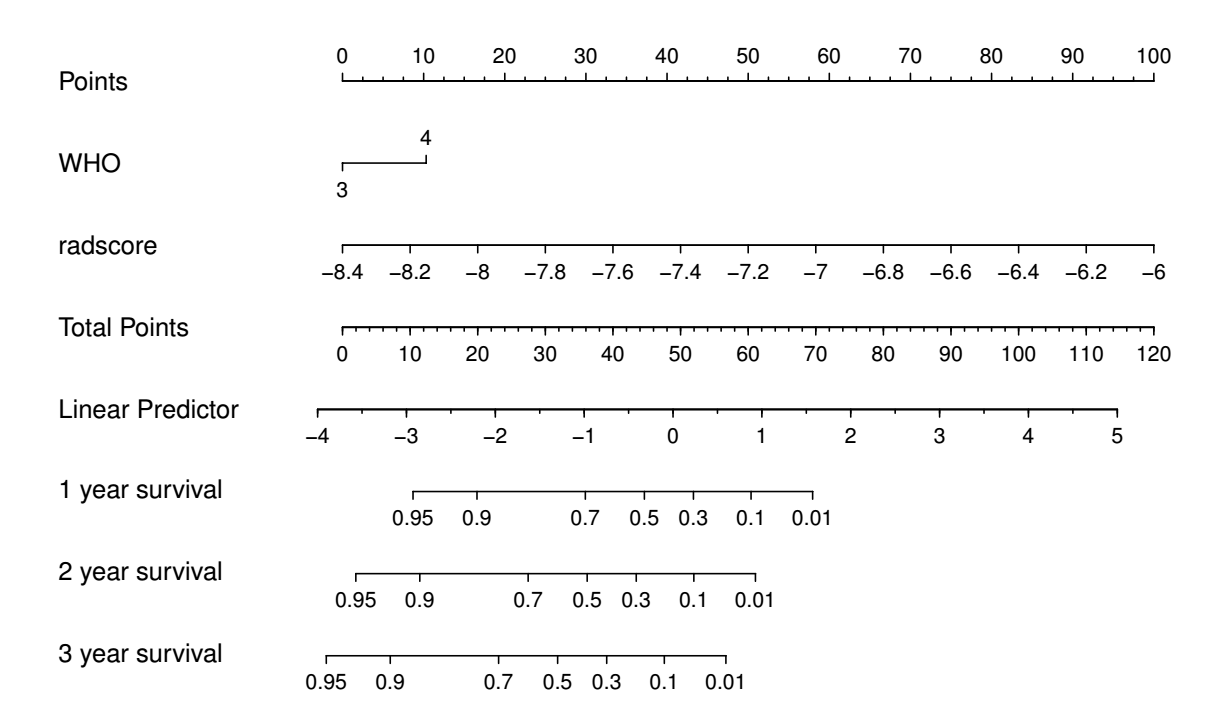
A total of 134 HGG patients (48 WHO grade III, 86 WHO grade IV) are selected from Nanfang Hospital. These patients were further devided in to a training cohort (n=93) and a validation cohort (n=41). A total of 6768 radiomics features are extracted from multiple regions of HGG using multiparametric MRI, including tumor, hydrocephalus, tumor plus hydrocephalus regions in FLAIR and tumor region in contrast-enhanced T1-weighted image (CET1-w). In the training cohort, a radiomics signature was constructed using the selected features by least absolute shrinkage and selection operator (LASSO) and Cox regression. A synthetic radiomics nomogram was constructed combining with selected clinical features and traditional MR images features. The performance of this nomogram was further evaluated in the validation cohort. Then, compared the prognostic value of different regions, include tumor regions and peritumoral brain parenchymal zone (PBZ) regions.Results
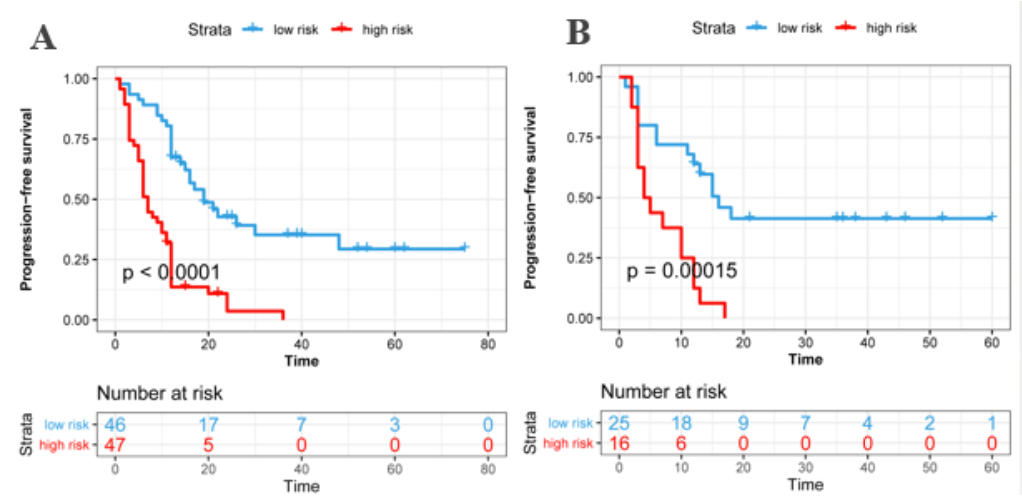
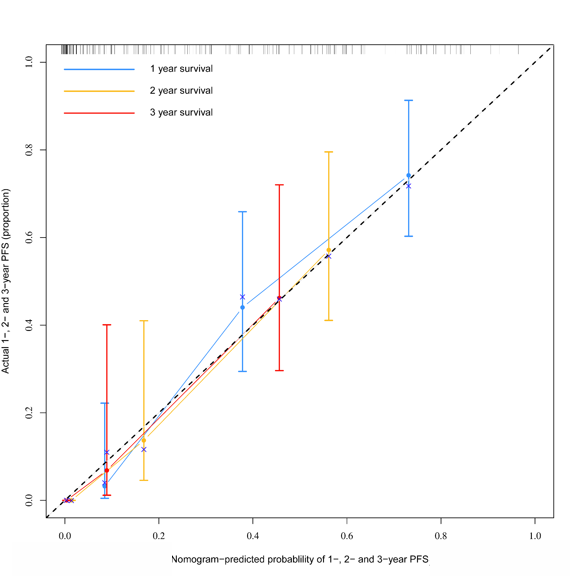
A radiomics signature constructed with 14 selected features from four regions in FLAIR and CET1-w images was found to have a better performance than clinical factors in survival prediction of HGG patients. When combining radiomics signature and clinical factors, a synthetic radiomics nomogram exhibited better discrimination in training (C-index = 0.776) and validation (C-index = 0.719) cohorts. Calibration curves showed good agreement. Findings were confirmed in the validation cohort. The C-index of the following four regions: (1) tumor1, (2) tumor2, (3) PBZ and (4) tumor 2+PBZ in the training cohorts are 0.671, 0.666, 0.672 and 0.673, respectively. The C-index of the four regions in the validation cohorts are 0.631, 0.637, 0.652 and 0.635, respectively.Conclusion
The multiparametric MRI-based radiomics nomogram provided improved prognostic ability in HGG. In addition, the PBZ of patients with HGG have important prognostic value.Limitation
First, because of the limited number of samples in this study, there is no exploration of intra-group heterogeneity in grade 3 and grade 4 gliomas. In future studies, the sample size should be expanded to confirm our findings. Second, the current study did not include functional sequences. Third, the manual segmentation adopted by segmentation is greatly influenced by subjective factors. In future research, an automatic or semi-automatic segmentation algorithm should be developed.Acknowledgements
No acknowledgement found.References
1. Ostrom QT, Gittleman H, Truitt G, Boscia A, Kruchko C, Barnholtz-Sloan JS. CBTRUS Statistical Report: Primary Brain and Other Central Nervous System Tumors Diagnosed in the United States in 2011-2015. Neuro Oncol. 2018;20(suppl_4):iv1-iv86.
2. McLendon RE, Halperin EC. Is the long-term survival of patients with intracranial glioblastoma multiforme overstated? Cancer. 2003;98(8):1745-8.
3. Inda MM, Bonavia R, Mukasa A, Narita Y, Sah DW, Vandenberg S, et al. Tumor heterogeneity is an active process maintained by a mutant EGFR-induced cytokine circuit in glioblastoma. Genes Dev. 2010;24(16):1731-45.
4. Sun MZ, Oh T, Ivan ME, Clark AJ, Safaee M, Sayegh ET, et al. Survival impact of time to initiation of chemoradiotherapy after resection of newly diagnosed glioblastoma. J Neurosurg. 2015;122(5):1144-50.
5. Katsigiannis S, Krischek B, Barleanu S, Grau S, Galldiks N, Timmer M, et al. Impact of time to initiation of radiotherapy on survival after resection of newly diagnosed glioblastoma. Radiat Oncol. 2019;14(1):73.
6. Preusser M, de Ribaupierre S, Wohrer A, Erridge SC, Hegi M, Weller M, et al. Current concepts and management of glioblastoma. Ann Neurol. 2011;70(1):9-21.
7. Laws ER, Parney IF, Huang W, Anderson F, Morris AM, Asher A, et al. Survival following surgery and prognostic factors for recently diagnosed malignant glioma: data from the Glioma Outcomes Project. J Neurosurg. 2003;99(3):467-73.
8. Gately L, McLachlan SA, Philip J, Ruben J, Dowling A. Long-term survivors of glioblastoma: a closer look. J Neurooncol. 2018;136(1):155-62.
Figures