1727
Addition of peritumoral area improves T1-weighted texture-based prediction of glioblastoma multiforme progression1Radiology, Stony Brook University, Stony Brook, NY, United States, 2Stony Brook University, Stony Brook, NY, United States
Synopsis
Texture features obtained from peritumoral area of diagnostic MR image of Glioblastoma Multiforme were used to improve texture based prediction of tumor progression. The peritumoral area was drawn and examined then derived texture features were added to conventional model to improve performance.
Introduction
The most aggressive malignant brain tumor, Glioblastoma Multiform, carries almost inevitable recurrence. [1] MR derived features of glioblastoma have previously shown an ability to predict patient survival and progression. [2] The goal of this study was to investigate whether MRI-based texture features derived from the peritumoral area can improve the prediction of tumor progression when added to current MR based texture models in newly diagnosed Glioblastoma Multiforme patients. This study defines the peritumoral area as five millimeters from the enhancing edge of the tumor. This area is often not removed during primary tumor resection and has been shown to contain cancer cells. [3] Under a T1 weighted MR image these cells should enhance and alter their appearance on a T1 scan which will be picked up via texture analysis.Methods
Patient data were obtained from the TCGA-GBM dataset from the National Cancer Institute.[5] The MR images were obtained through the Cancer Imaging Achieve. Both are HIPAA compliant public access datasets. Progression was defined by the TCGA-GBM dataset as new tumor event. Each patient had a histology confirmed Glioblastoma Multiforme diagnosis. This study used the provided segmentations from Spyridon et al.[6] to identify the enhancing tumor, non-enhancing tumor, and edema regions of each patient. The peritumoral area was generated by merging the enhancing tumor and non-enhancing tumor regions, then generating a five-millimeter ring around the merged region. (Figure 1) Texture features from each region were extracted using LIFEx v5.10 texture protocol. A total of 168 features were extracted per scan including histogram, shape, and first order features. Least absolute shrinkage and selection operator (LASSO) was used to determine the most relevant features. Relevant features were then used to create a logistic regression prediction 7-month progression in patients. Models were evaluated using receiver operating characteristic curve and Kaplan Meier analysis. All statistics conducted in R version 3.6.1.Results
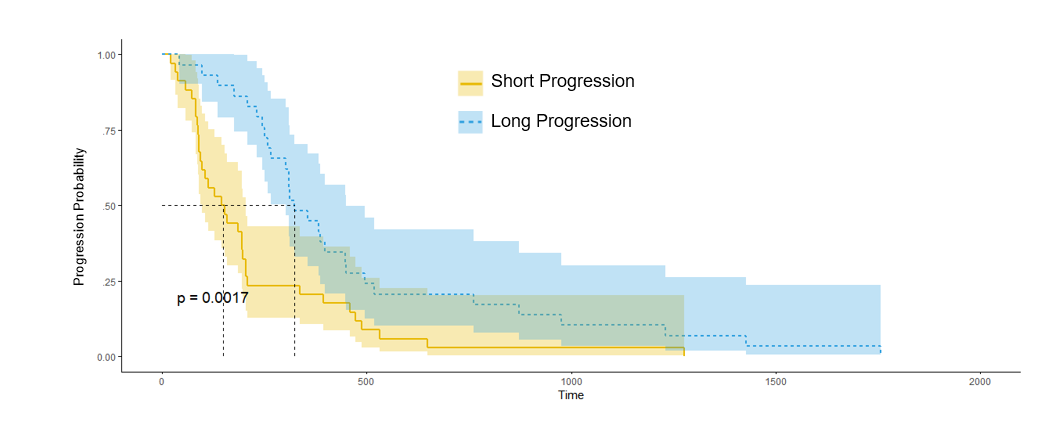
The LASSO selected features represented all regions of the tumor. The set containing radiomic features that included the peritumoral area produced an area under curve (AUC) of 0.83 while the set without peritumoral features returned an AUC of 0.73. (Figure 2) A larger AUC indicates a more accurate predictor where an AUC of 0.5 would be equivalent to random selection. The Kaplan-Meier analysis showed that there is a significant difference between the greater than seven month progression and the less than seven month prediction groups.Discussion
Radiomic prediction is a valuable tool in the clinical setting as it can provide information about patient outcomes form the onset. The peritumoral region needs to be considered when evaluating glioblastoma multiforme tumors as cancer cells are almost always present outside of the tumor [4]. These cells will not be removed during resection and therefore offer predictive power towards progression. The inclusion of this region in this study showed an increase in AUC from 0.76 to 0.83. This may be further improved by examining the peritumoral area in different MR modalities such as T2 or Flair.Conclusion
Radiomic features can be extracted from the peritumoral area of glioblastoma multiforme tumors. These features have the ability aid the prediction of time to progression from these images when combined with features from other tumor regions. Predictions made form data that included the peritumoral area of the tumor were more accurate than predictions made from data that did not include this region.Acknowledgements
No acknowledgement found.References
1. C.B.T.R. of the United States, et al., Cbtrus statistical report: primary brain and central nervous system tumors diagnosed in the United States, 2004–2006, february 2010, Hinsdale, IL: central Brain Tumor Registry of the United States, http://www. cbtrus.org/2010
2. Jain, R. et al. Outcome prediction in patients with glioblastoma by using imaging, clinical, and genomic biomarkers: focus on the nonenhancing component of the tumor. Radiology 272, 484–493 (2014).
3. Kim, Jung Youn, et al. "Radiomics in peritumoral non-enhancing regions: fractional anisotropy and cerebral blood volume improve prediction of local progression and overall survival in patients with glioblastoma." Neuroradiology (2019): 1-12.
4. Silbergeld, Daniel L., and Michael R. Chicoine. "Isolation and characterization of human malignant glioma cells from histologically normal brain." Journal of neurosurgery 86.3 (1997): 525-531.
5. Scarpace, L., Mikkelsen, T., Cha, soonmee, Rao, S., Tekchandani, S., Gutman, D., … Pierce, L. J. (2016). Radiology Data from The Cancer Genome Atlas Glioblastoma Multiforme [TCGA-GBM] collection. The Cancer Imaging Archive. http://doi.org/10.7937/K9/TCIA.2016.RNYFUYE9
6. Spyridon Bakas, Hamed Akbari, Aristeidis Sotiras, Michel Bilello, Martin Rozycki, Justin Kirby, John Freymann, Keyvan Farahani, and Christos Davatzikos. (2017) Segmentation Labels and Radiomic Features for the Pre-operative Scans of the TCGA-GBM collection. The Cancer Imaging Archive. https://doi.org/10.7937/K9/TCIA.2017.KLXWJJ1Q
Figures