1719
Comparison of radiomics-based and deep learning techniques for predicting nuclei density in brain cancer patients from MRI1Biophysics, Medical College of Wisconsin, Wauwatosa, WI, United States, 2Radiology, Medical College of Wisconsin, Wauwatosa, WI, United States, 3Biomedical Engineering, Medical College of Wisconsin, Wauwatosa, WI, United States, 4Neurology, Medical College of Wisconsin, Wauwatosa, WI, United States, 5Pathology, Medical College of Wisconsin, Wauwatosa, WI, United States, 6Biostatistics, Medical College of Wisconsin, Wauwatosa, WI, United States
Synopsis
This study sought to compare localized predictions of cellular density via radiomics-based and neural network-based modeling, using co-registered autopsy tissue samples from 16 brain cancer patients as ground truth. We found that radiomics models tended to slightly outperform the neural networks, despite evidence of overfitting in all radiomics-based models and an Alexnet-based transfer learning model. These results suggest that radiomics models tend to perform at least as well as neural network when applied to this dataset, but the propensity of these models for overfitting highlights further needs to be addressed with modelling on larger data sets.
Introduction
An essential step towards improving the prognosis of glioblastoma (GBM) and other brain cancers is providing better in-vivo localization of infiltrative tumor regions. Current clinical imaging has shown substantial utility in its ability to address this concern, particularly with studies of diffusion imaging showing some utility for localizing regions of cellular density as an indicator for infiltrative tumor [1–3]. Predictive modeling in terms of pre-defined radiomic features [4–6] and image-based deep learning techniques [7–9]have demonstrated substantial prognostic utility across several factors. However, robust predictions of local cellular density remain beyond the current grasp of clinical imaging models, with a lack of ground truth beyond biopsy limiting most studies.This study used autopsy tissue samples from brain cancer patients in order to provide a ground truth for more robust predictions of cellular density. We assessed the utility and predictive ability of radiomics and deep learning models with regards to their ability to predict localized cellular density in order to contrast their utility towards addressing a pressing problem in brain cancer research.
Methods
Sixteen patients with a pathologically confirmed brain cancer were enrolled in this study (Table 1). A schematic representation of the data processing steps prior to analyses is provided in Figure 2.Forty-five tissue samples were collected at autopsy, and clinical imaging was collected from the last session prior to death including a T1-weighted image (T1), T1 with injection of gadolinium contrast agent (T1+C), a T2-weighted fluid attenuated inversion recovery image (FLAIR), and an apparent diffusion coefficient image (ADC) calculated from diffusion weighted imaging. Samples were acquired using 3-D printed slicing jigs based on the clinical imaging in order to slice the brain in line with the slices of the MRI. Following hematoxylin and eosin (HE) tissue staining, full slides from the samples were then digitized at 10X magnification using a sliding stage microscope.
In-house custom software was used to coregister the histology to the FLAIR image. Regions of interest (ROIs) were defined based on quality assessment for both the MRI and the histology across each slide, with tile masks generated across the ROIs using a 10 voxel by 10 voxel frame with single voxel stride. Cellular density was calculated using an automated segmentation algorithm and summed across each tile as the continuous label for regression-based predictions.
Radiomic features were calculated across each tile mask for the intensity normalized T1, T1+C, FLAIR, and ADC image using Pyradiomics v2.1.0. Features were extracted on each normalized image, as well as the eight images generated from a 3-D wavelet decomposition (3DWD) of each image. The final radiomics dataset consisted of 837 features for each MRI, for a total of XX radiomics features for ensemble models of cellular density. Three bagged ensembles were fit for cellularity prediction using the first order features across all images (ENS1, 648 features), the principal components that explained 95% of the total radiomic feature variance (ENS2, 325 features), and the whole radiomic feature set (ENS3, 3348 features). In addition, a resized 3D input using the T1 subtraction maps (calculated as the T1C minus the T1 scan), FLAIR, and ADC images was used as an input for a deep transfer learning model using AlexNet (AlexNet).
Results
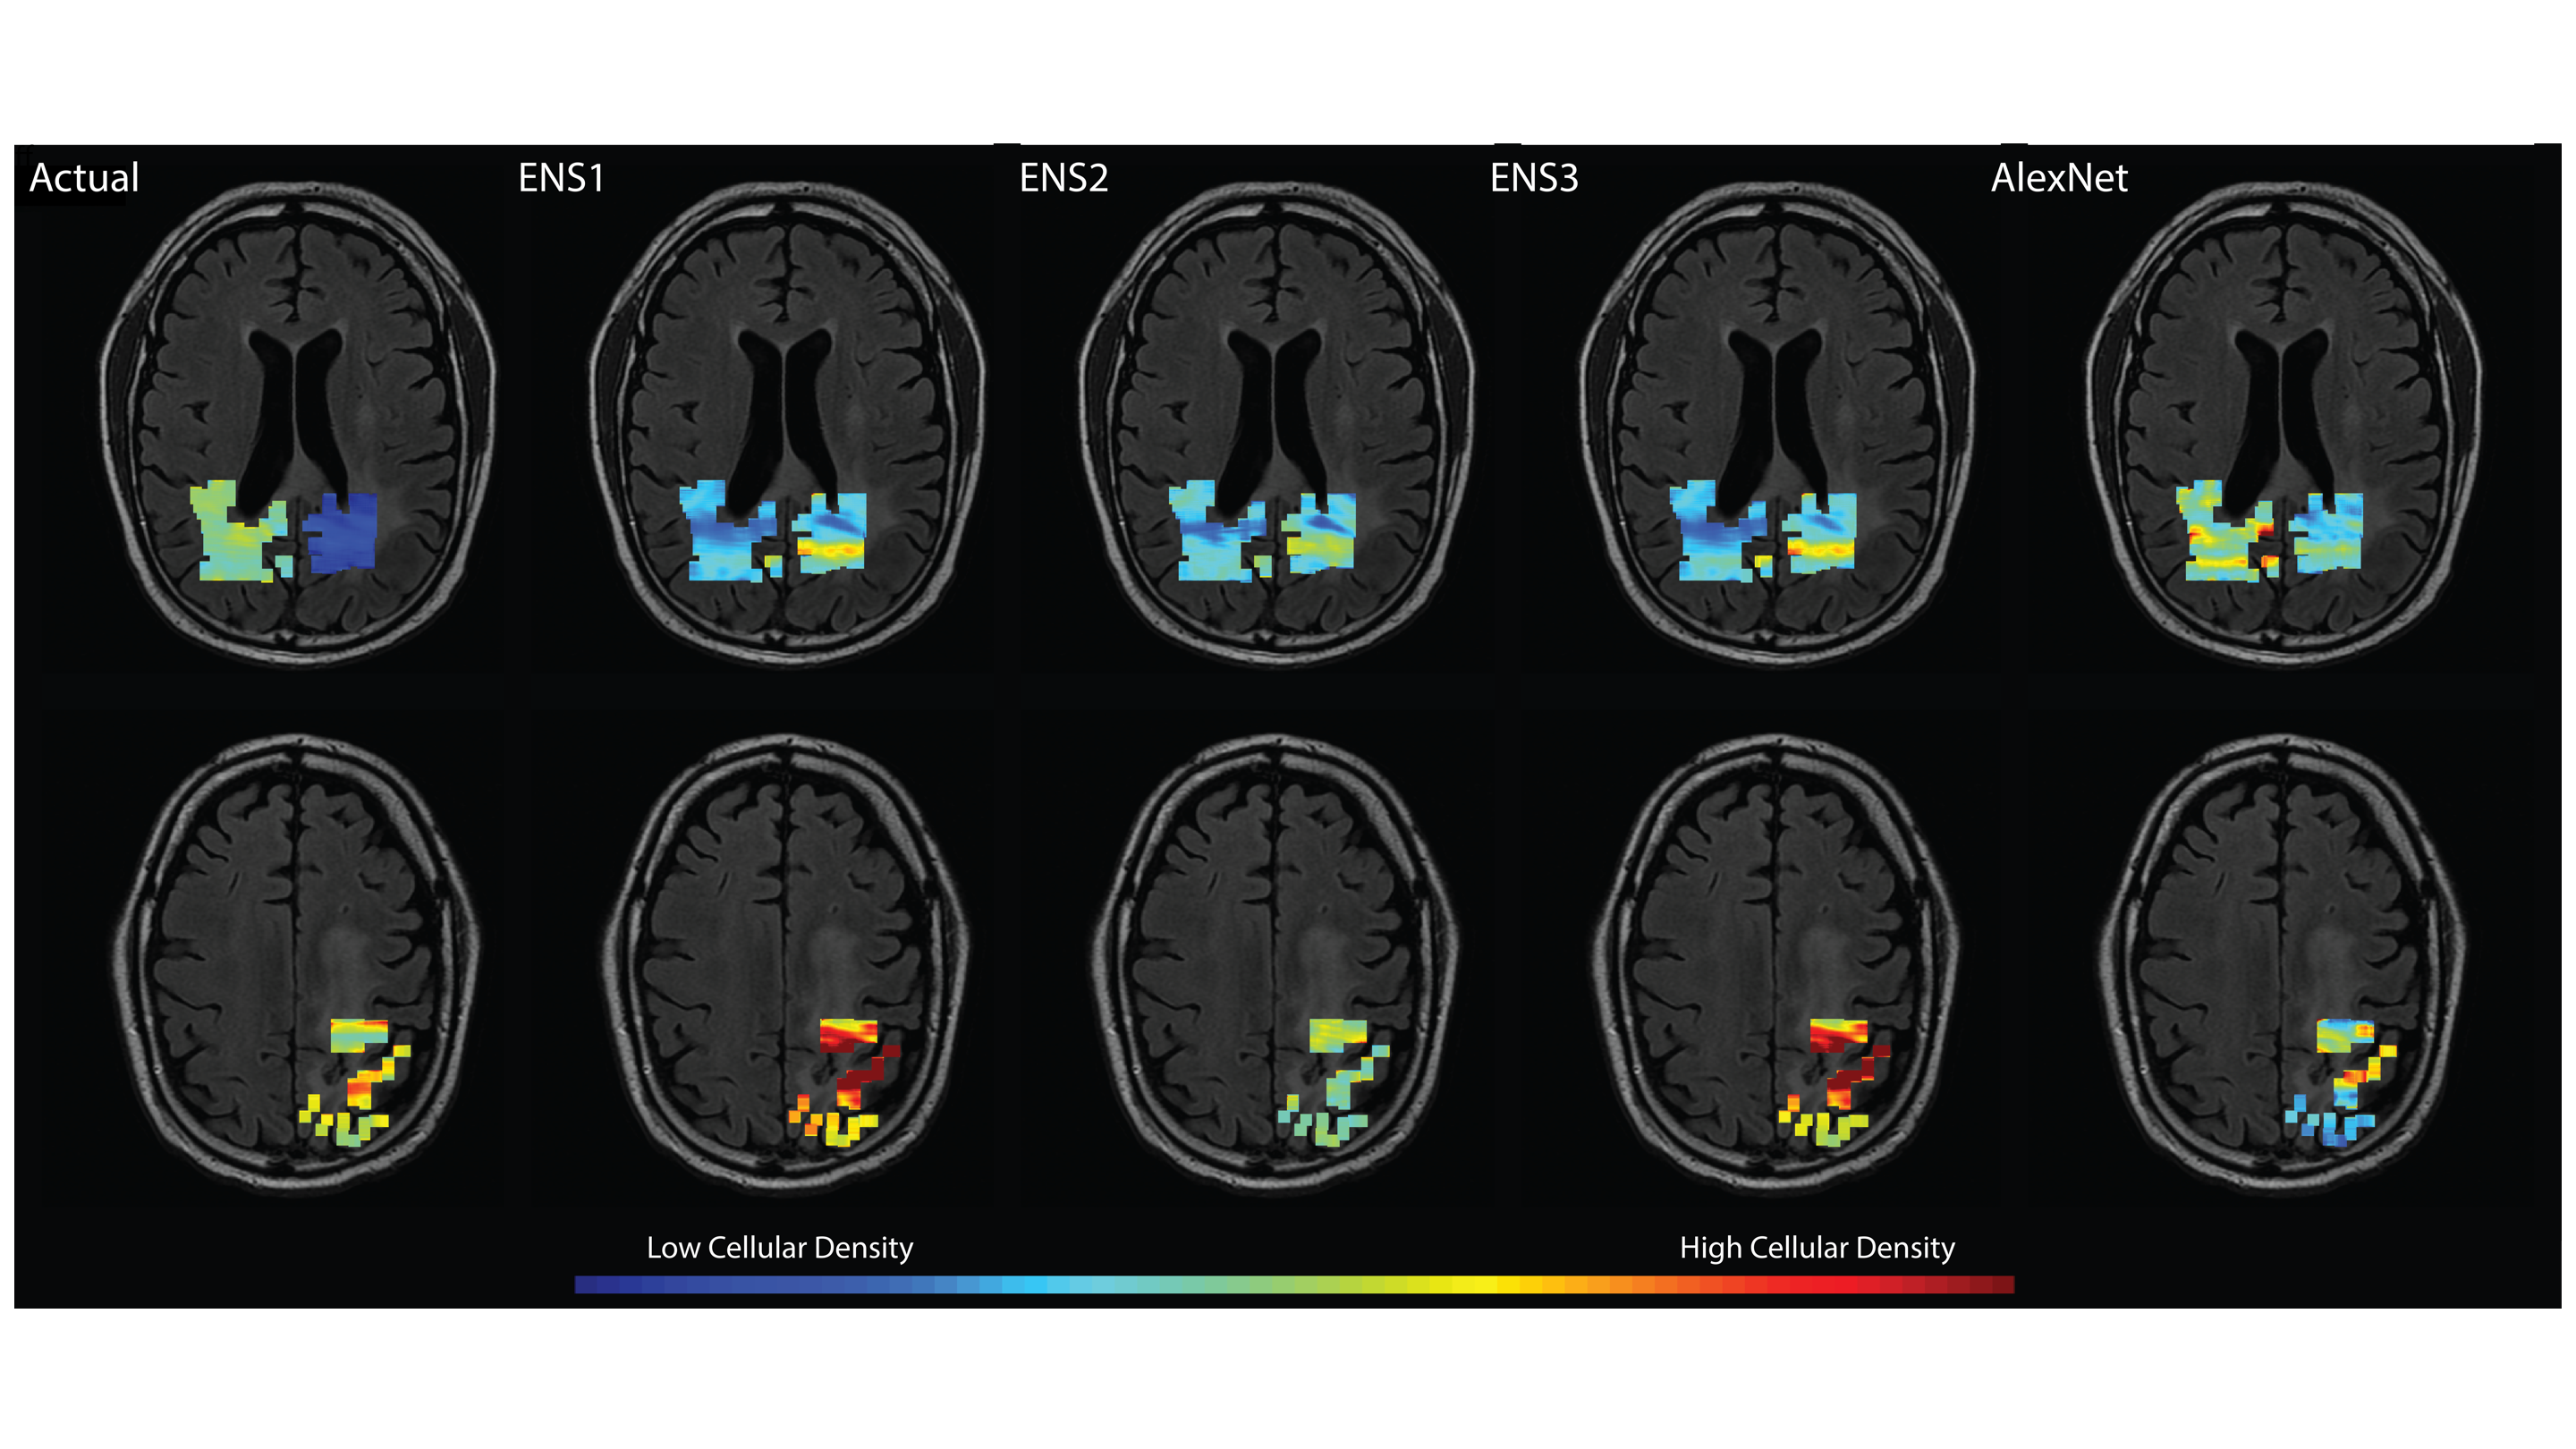
A structural summary of the five assessed cellularity prediction models is provided in Figure 3. Models were assessed in terms of root mean squared error, which was calculated on both training (n=12) and test (n=4) sets to highlight overfitting issues (Figure 4). The ensemble models tended to substantially overfit to the training data set, despite providing the best test set RMSE values. AlexNet tended to overfit less than the other models but had the worst predictive performance. Overall, ENS2 provided the best test set accuracy. Predicted values plotted over the FLAIR image of an example test set subject are shown in Figure 5.Discussion
This study provides a preliminary assessment of how radiomics and deep learning models compare in predictions of localized cellular density. Though radiomics models offered slightly better test set predictions, the models tended to overfit to the training data, potentially limiting the usefulness of radiomics-based predictions in larger data sets. Furthermore, the Alexnet-based network also tended to overfit the training data while performing the poorest on the test set across all models. Test set predictions plotted on an example subject revealed a heterogeneity of model strengths, with the ensemble methods performing better at distinguishing low from high values, whereas the AlexNet model tended to perform better within the low-to-middle value range despite failure to identify higher values.Despite the differences in technique and model performance provided here, the differences between RMSE values for the models were fairly minor, and no model was able to obtain more than a modest validation accuracy. Therefore, studies of larger data sets will be essential to assessing the optimal technique for delineating the relationship between MRI and cellular density.
Conclusion
This study suggests that MR radiomics-based modeling can provide similar to superior estimates of cellular density when compared to neural networks in this data set, at the expense of increased risk of overfitting, and provides a proof-of-concept for localized pathological predictions using MRI techniques.Acknowledgements
We would like to thank our patients for their participation in this study and our funding sources: American Brain Tumor Association DG14004, R01CA218144, R01CA218144-02S1, and R21CA23189201.References
1 Chen S-D, Hou P-F, Lou L, et al. The correlation between MR diffusion-weighted imaging and pathological grades on glioma. Eur Rev Med Pharmacol Sci 2014;18:1904–9.
2 Chang PD, Malone HR, Bowden SG, et al. A Multiparametric Model for Mapping Cellularity in Glioblastoma Using Radiographically Localized Biopsies. AJNR Am J Neuroradiol 2017;38:890–8. doi:10.3174/ajnr.A5112
3 Eidel O, Neumann J-O, Burth S, et al. Automatic Analysis of Cellularity in Glioblastoma and Correlation with ADC Using Trajectory Analysis and Automatic Nuclei Counting. PLoS One 2016;11:e0160250. doi:10.1371/journal.pone.0160250
4 Kickingereder P, Neuberger U, Bonekamp D, et al. Radiomic subtyping improves disease stratification beyond key molecular, clinical, and standard imaging characteristics in patients with glioblastoma. Neuro Oncol 2018;20:848–57. doi:10.1093/neuonc/nox188
5 Sanghani P, Ang BT, King NKK, et al. Overall survival prediction in glioblastoma multiforme patients from volumetric, shape and texture features using machine learning. Surg Oncol 2018;27:709–14. doi:10.1016/j.suronc.2018.09.002
6 Lu C-F, Hsu F-T, Hsieh KL-C, et al. Machine Learning–Based Radiomics for Molecular Subtyping of Gliomas. Clin Cancer Res 2018;24:4429–36.
7 Pereira S, Pinto A, Alves V, et al. Brain Tumor Segmentation Using Convolutional Neural Networks in MRI Images. IEEE Trans Med Imaging 2016;35:1240–51. doi:10.1109/TMI.2016.2538465
8 Dong H, Yang G, Liu F, et al. Automatic Brain Tumor Detection and Segmentation Using U-Net Based Fully Convolutional Networks. In: Valdés Hernández M, González-Castro V, eds. Medical Image Understanding and Analysis. Cham: : Springer International Publishing 2017. 506–17.
9 Yang Y, Yan L-F, Zhang X, et al. Glioma Grading on Conventional MR Images: A Deep Learning Study With Transfer Learning. Front Neurosci 2018;12. doi:10.3389/fnins.2018.00804
Figures