1718
MRI signatures associated with pathologically relevant histological features of brain cancer at autopsy1Biophysics, Medical College of Wisconsin, Wauwatosa, WI, United States, 2Radiology, Medical College of Wisconsin, Wauwatosa, WI, United States, 3Biomedical Engineering, Medical College of Wisconsin, Wauwatosa, WI, United States, 4Neurology, Medical College of Wisconsin, Wauwatosa, WI, United States, 5Pathology, Medical College of Wisconsin, Wauwatosa, WI, United States, 6Biostatistics, Medical College of Wisconsin, Wauwatosa, WI, United States
Synopsis
This study sought to assess the ability for voxel-wise MRI intensity values to distinguish between co-registered pathological annotations of autopsy tissue samples from brain cancer patients. Though single image and pairwise image assessments did not reveal separable intensity distributions for the pathological annotation classes, ensemble-based predictive modelling using multiparametric MRI intensities proved able to predict pathological annotations with modest accuracy. These results suggest a complex relationship between MRI values and pathological features that are most accurately assessed in terms of multiple MR imaging modalities.
Introduction
Clinical MR imaging has been crucial for monitoring the treatment and progression of glioblastoma (GBM) and other brain cancers. T1-weighted imaging pre and post gadolinium contrast administration highlights regions of blood brain barrier disruption caused by the brain tumor, whereas FLAIR hyperintensities represent a combination of non-enhancing tumor and edemic areas and regions. Diffusion imaging derived apparent diffusion coefficient (ADC) has been shown to be inversely correlated with tumor cellularity [1–4]. However, without pathological validation in both tumor and non-tumor tissue, these interpretations may be missing important information regarding the location and content of the tumor, especially in the presence of treatment effects. Furthermore, discerning between regions of non-active tumor (i.e. necrotic regions, treatment-affected regions, normal tissue) from regions of infiltrative tumor using MRI has yet to be demonstrated.This study sought to further explore the separability of several pathologically relevant categories in terms of MRI intensity values using autopsy tissue samples from brain cancer patients. Specifically, we tested the hypothesis that multiparametric MRI intensity values were able to distinguish between pathologically annotated regions of the co-registered post-mortem tissue.
Methods
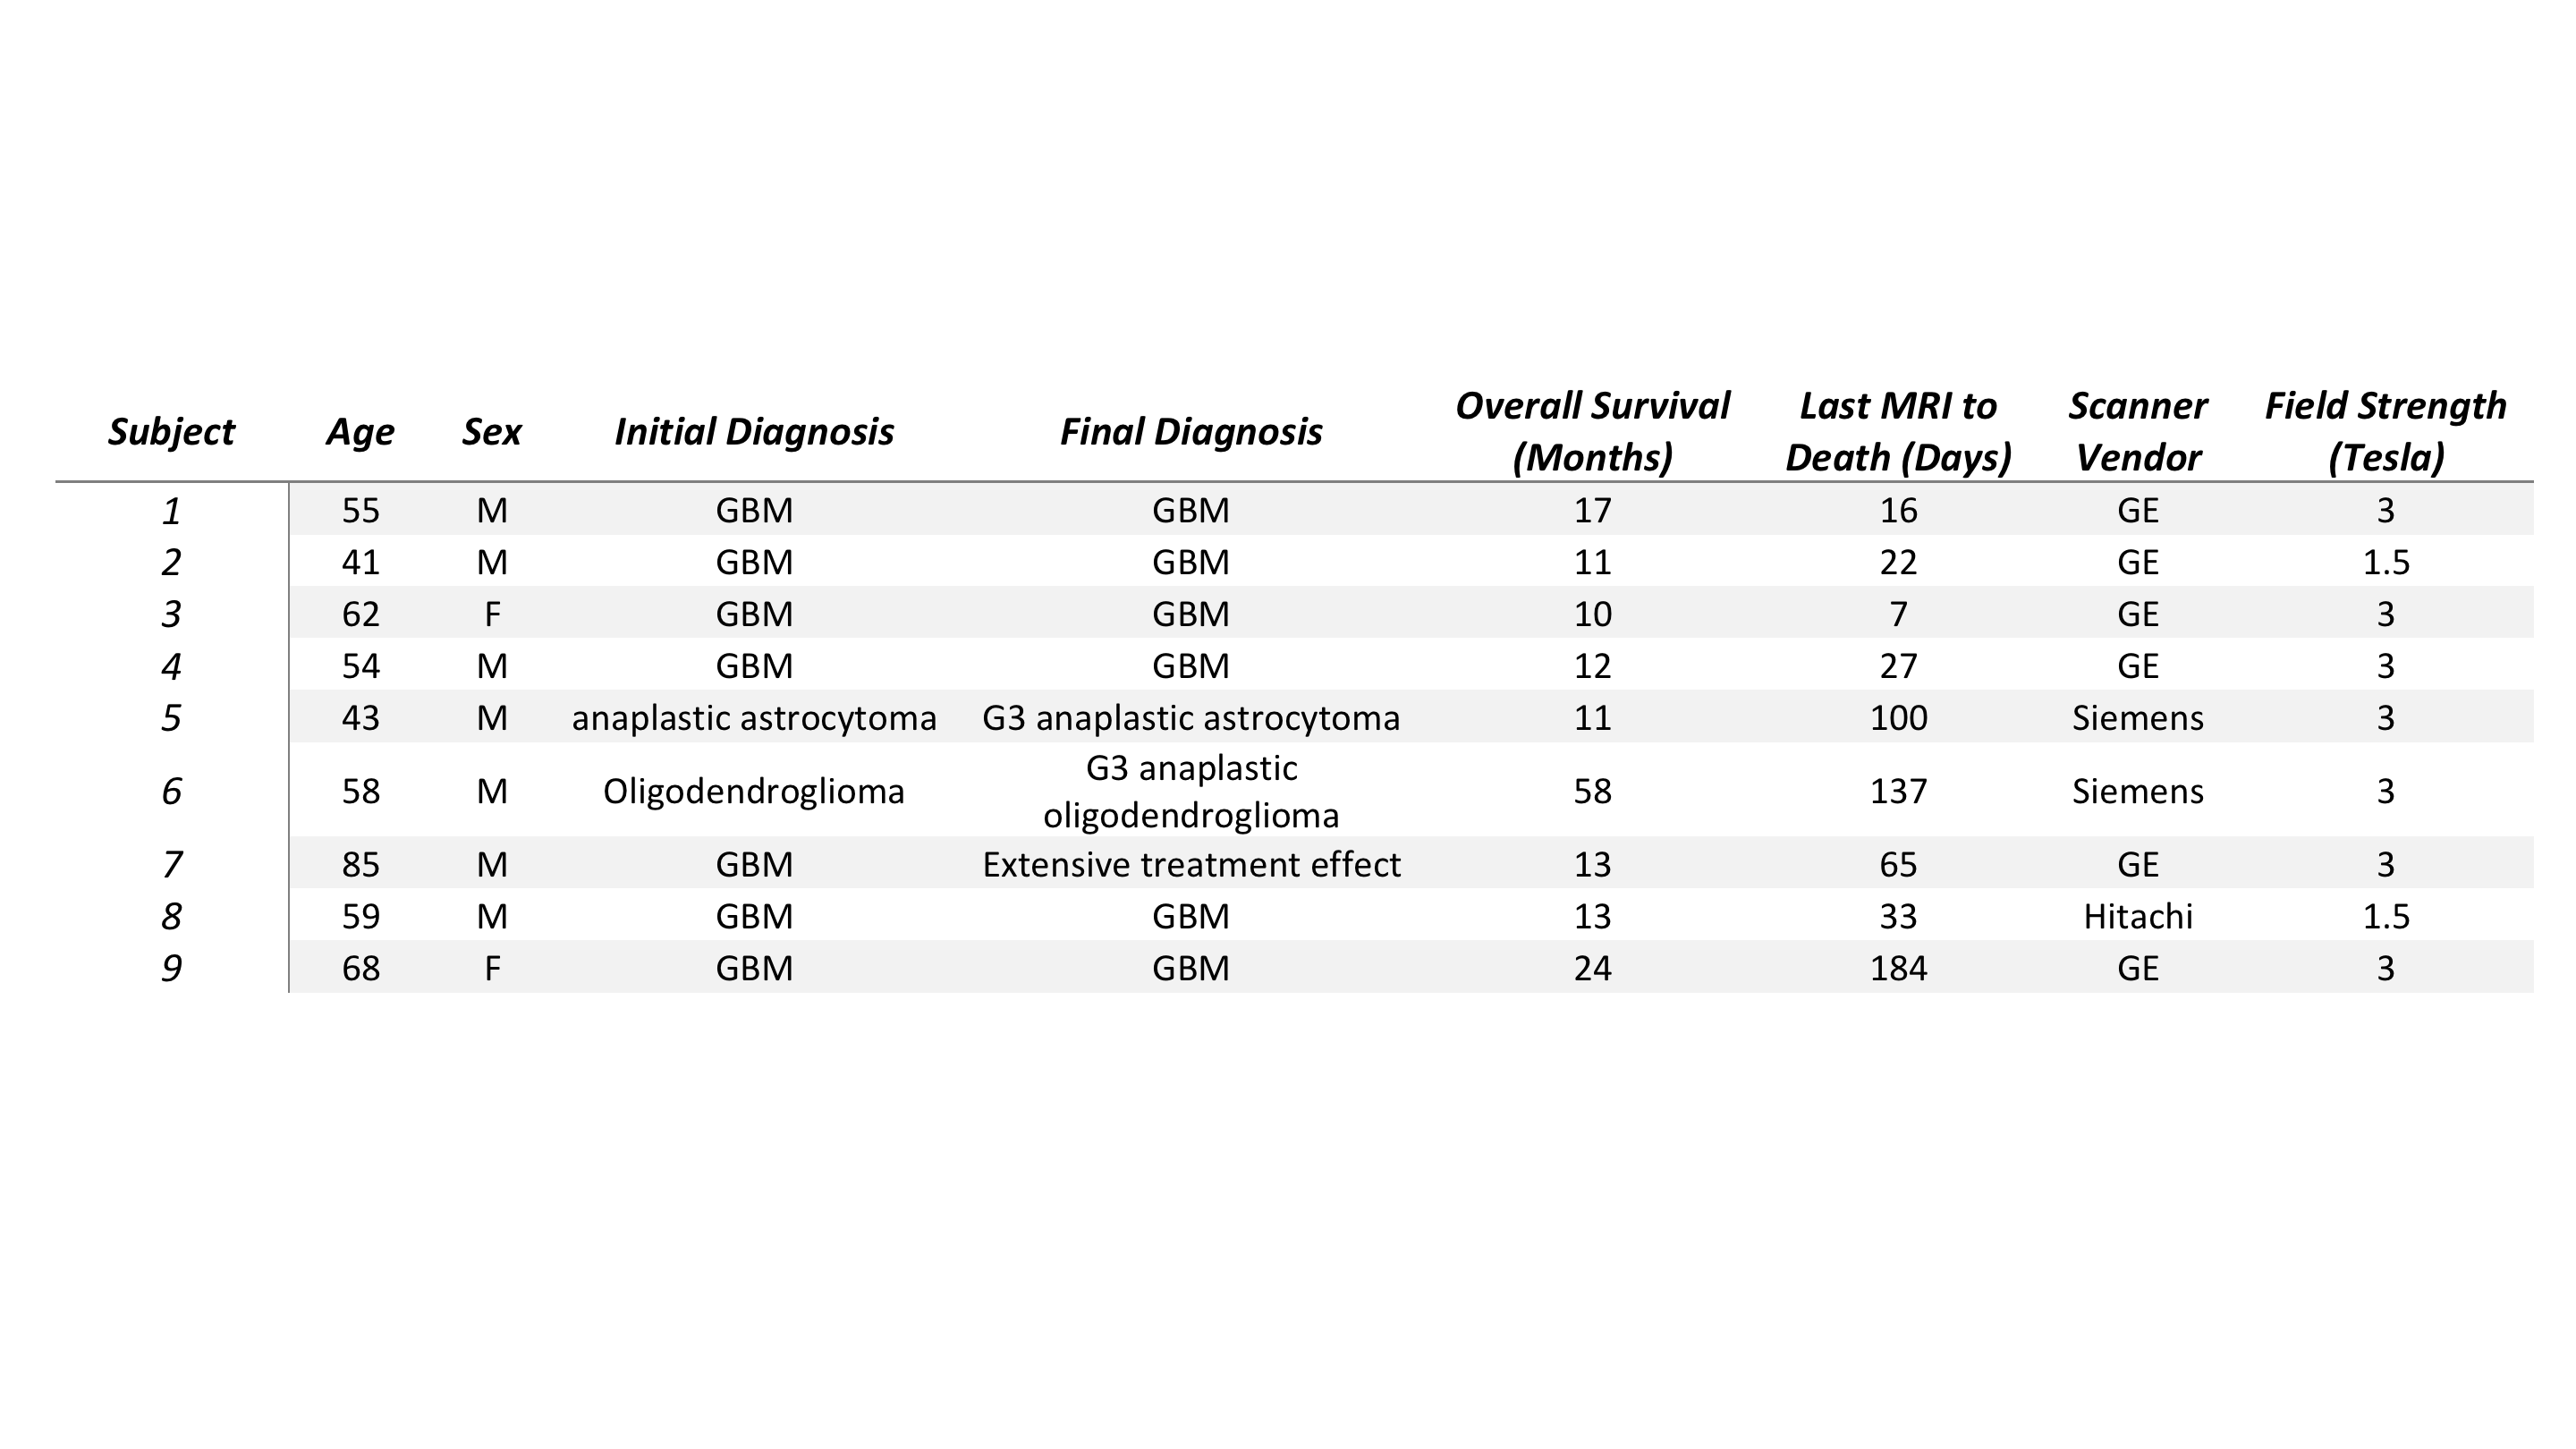
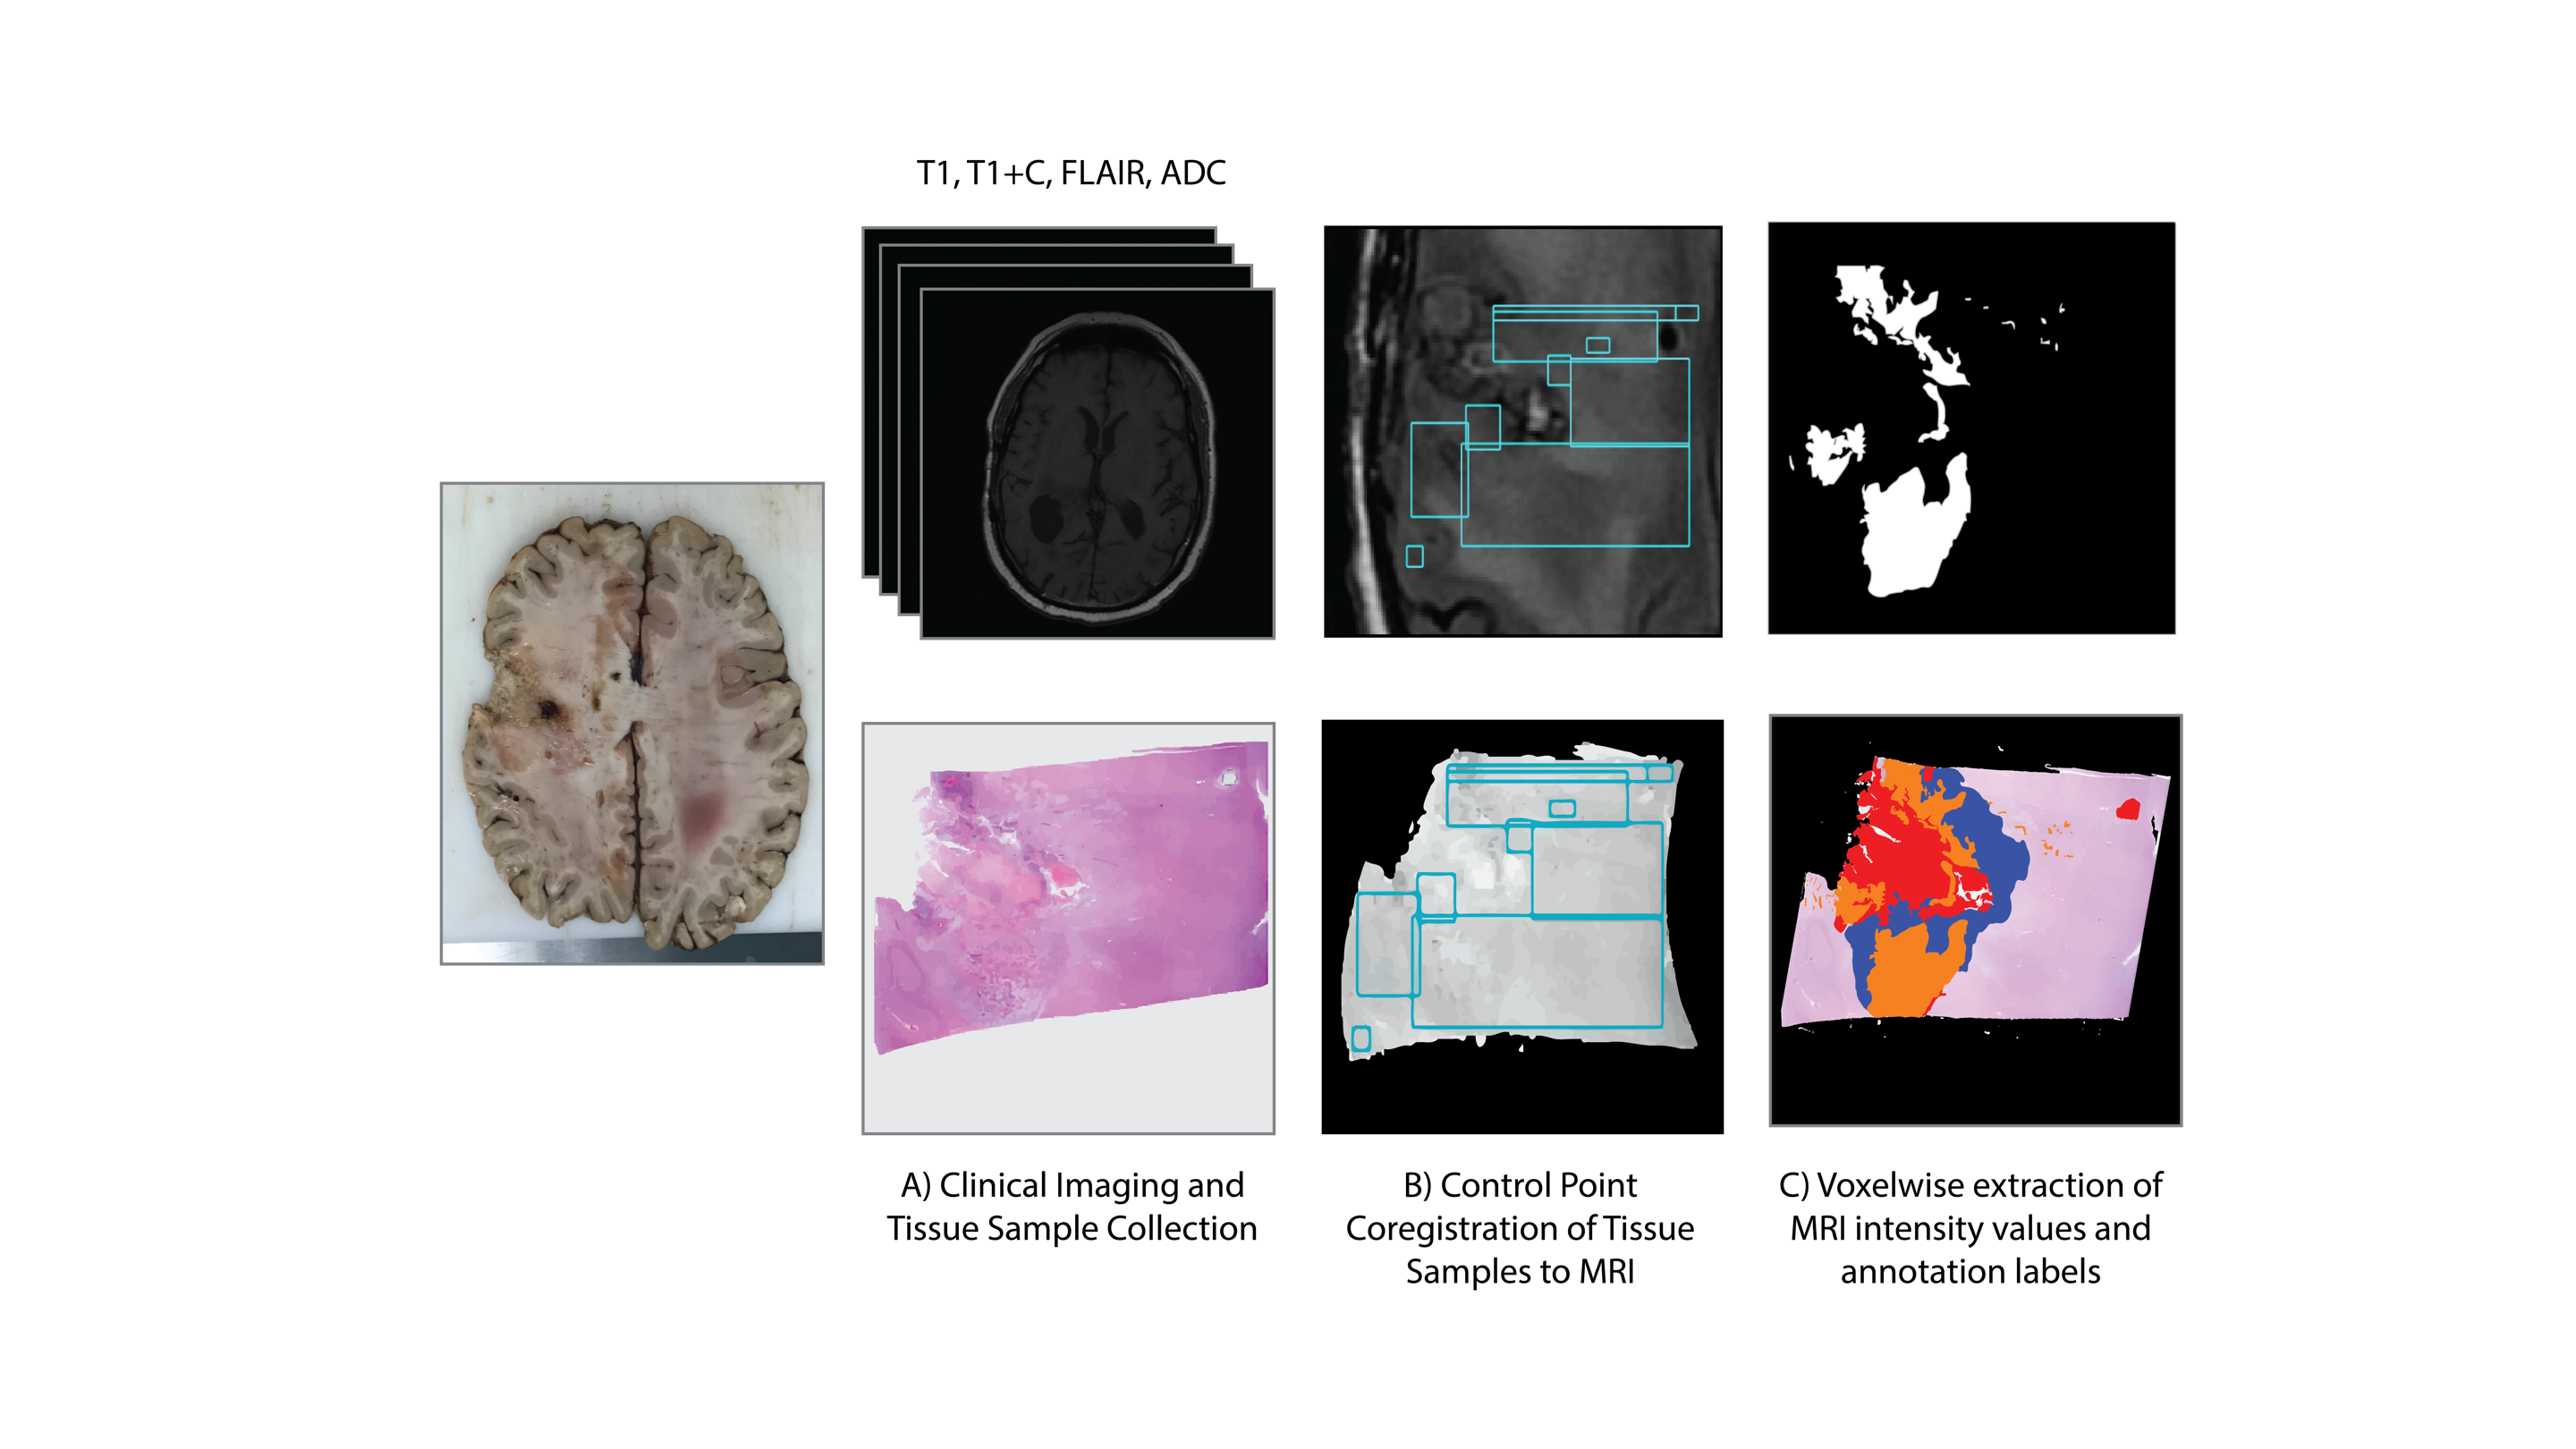
Nine patients with a pathologically confirmed brain cancer were enrolled in this study, whose clinical characteristics are summarized in Table 1. A schematic representation of the data collection process is provided in Figure 2. Twenty tissue samples (representing the nine patients) were collected at autopsy. For comparison, the final clinical imaging session acquired prior to death was used. T1-weighted images pre (T1) and post gadolinium contrast administration (T1C), fluid attenuated inversion recovery (FLAIR) images, and ADC images calculated from diffusion weighted imaging were intensity normalized and included in these analyses. Autopsy samples were stained for hematoxylin and eosin (HE), digitized, and annotated for areas of treatment effect (TE), hypercellularity (HC), and hypercellular regions of pseudopalisading necrosis (PN), with unlabeled regions abbreviated as UL. The histology images and annotations were then co-registered to the MRI by using a custom in-house software to perform nonlinear warping of the sample to the FLAIR image using manually defined control points.Voxel-wise histological labels and MRI intensity values for each image were then extracted over regions of interest based on the quality assessments of the histology and MRI. Single image descriptions, pairwise descriptions, and a full data assessment were used to delineate the relationship between the MRI intensity values and pathological annotations at several parametric scales. Intensity distributions for each label were plotted for each image in order to assess the distinguishability of each annotation with regards to each MRI. Pairwise confidence distributions were assessed using the posterior probabilities from error-corrected output coding (ECOC) models in order to observe the distinguishability of the annotations in terms of each pair of MR images. Lastly, a multi-class ensemble learner was fit using all four MRI values to model for the annotation class, with accuracy assessed using a five-fold cross validation split.Results
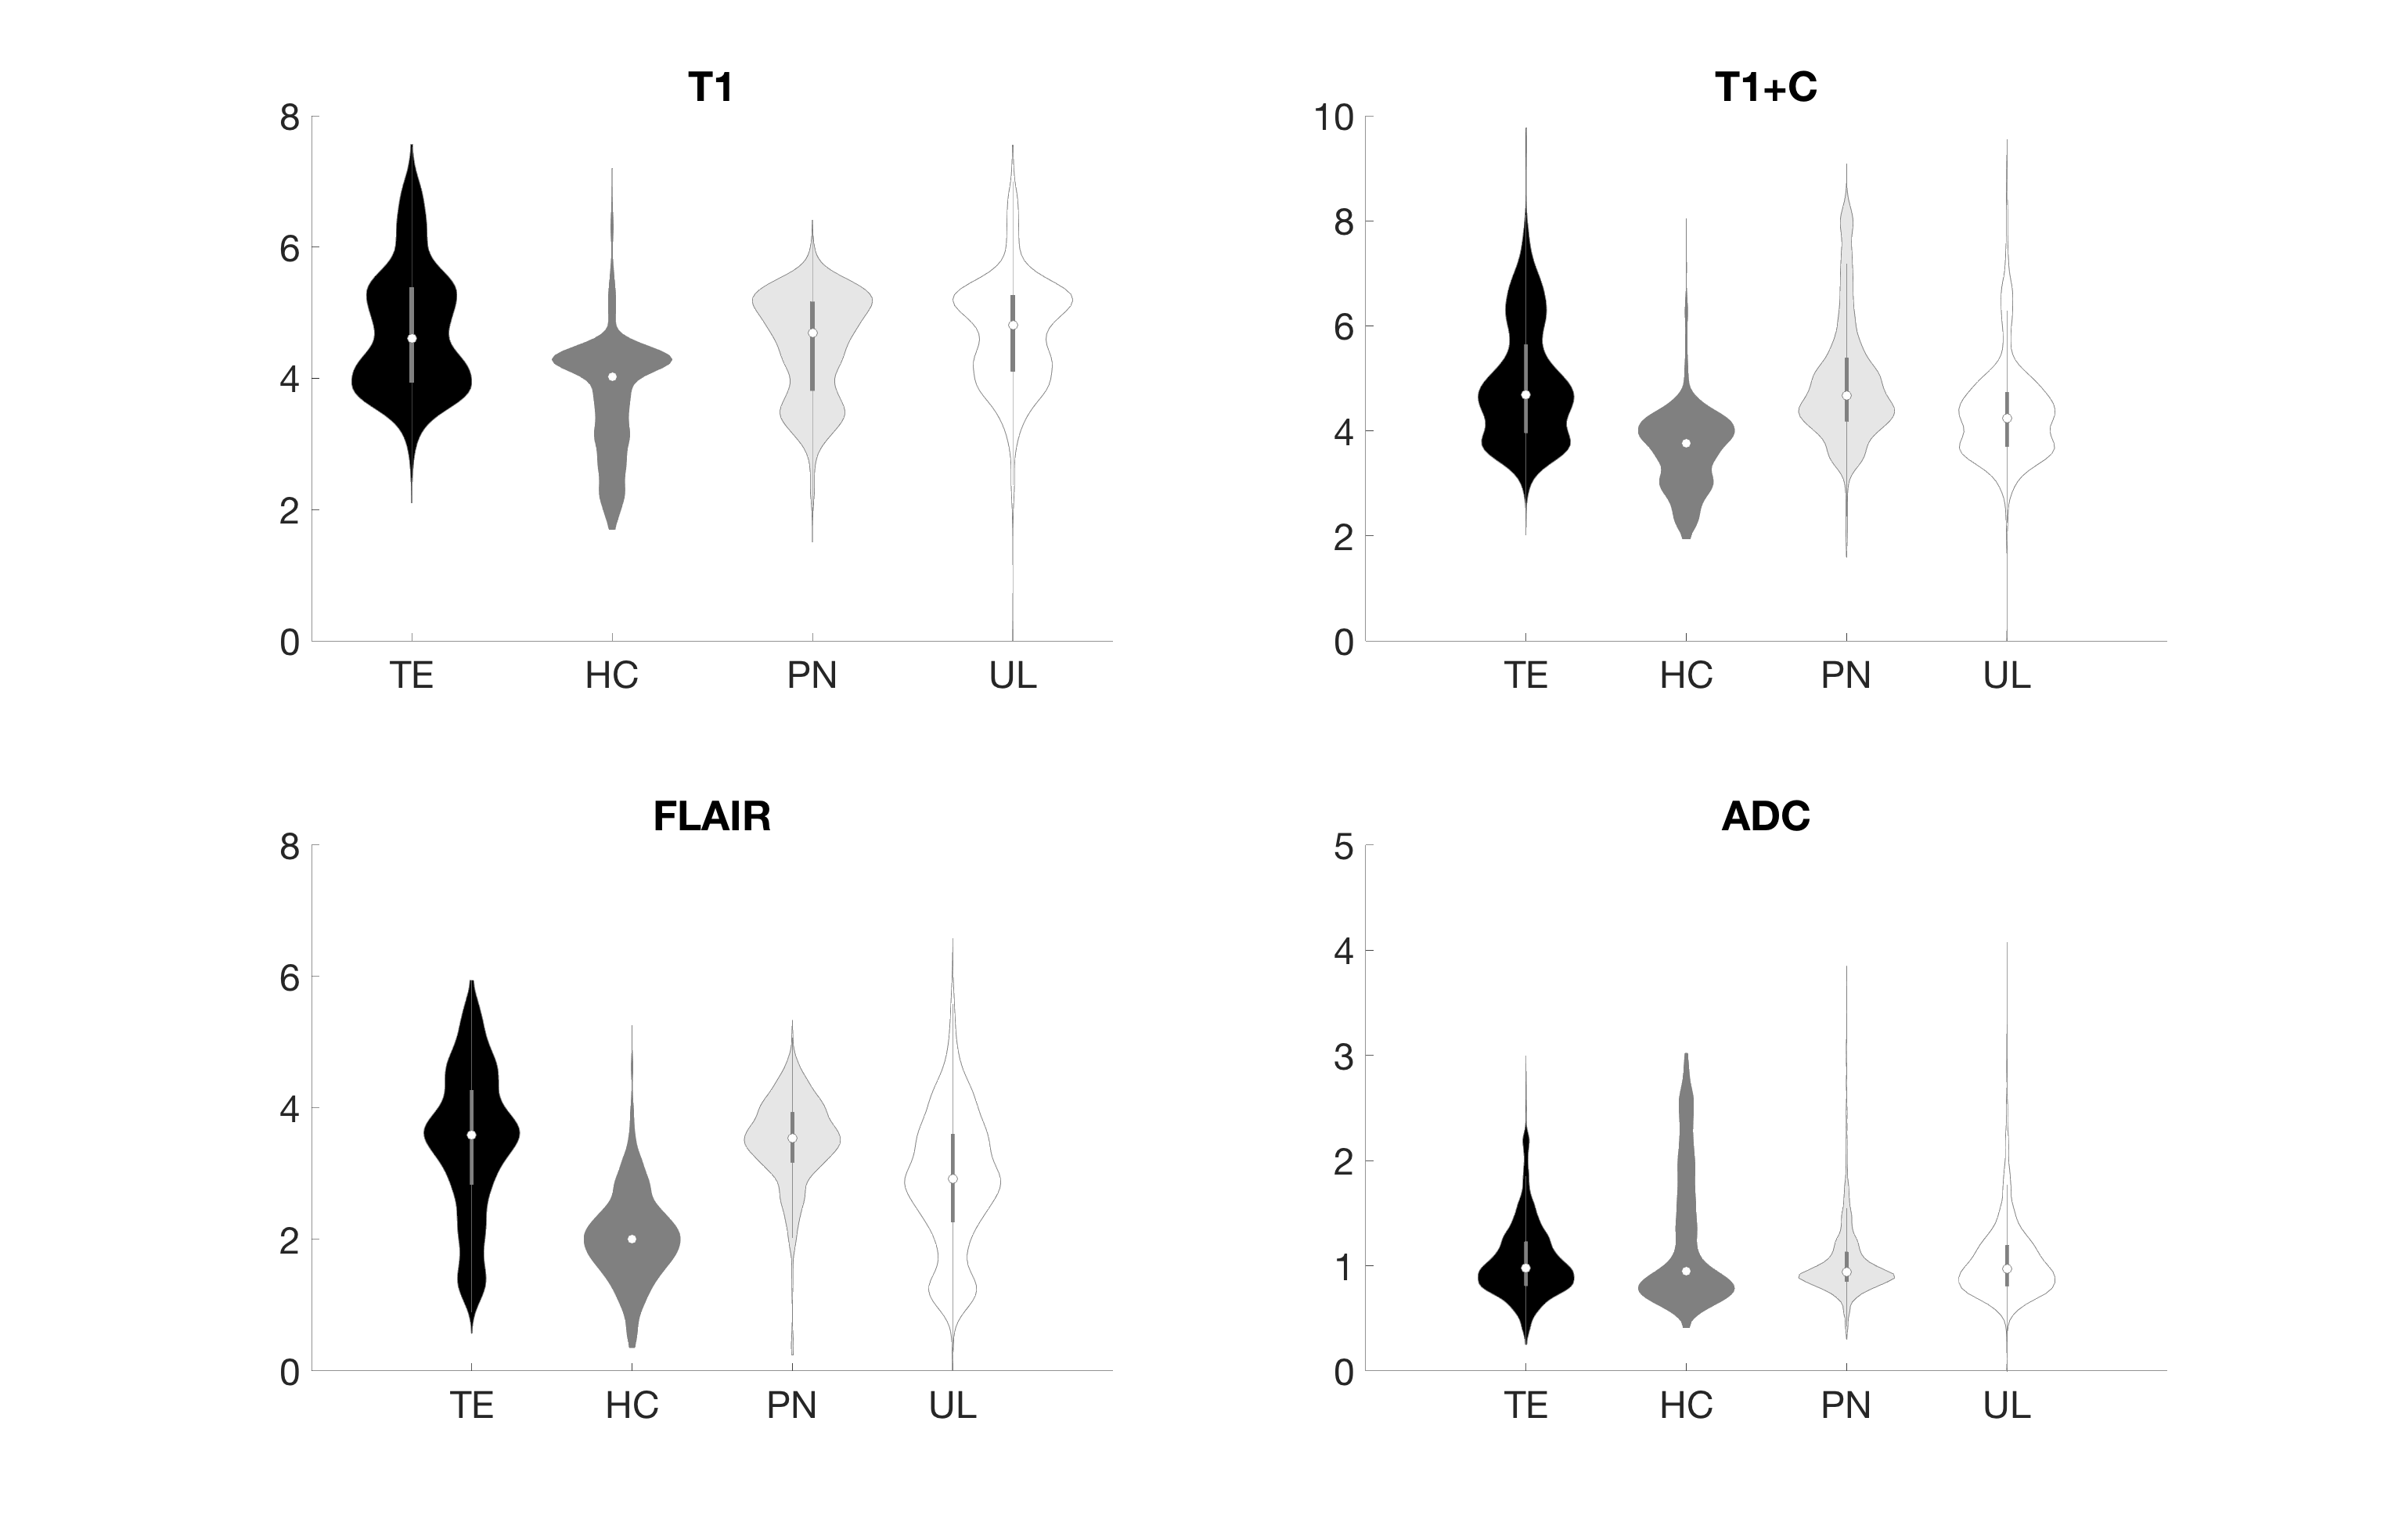
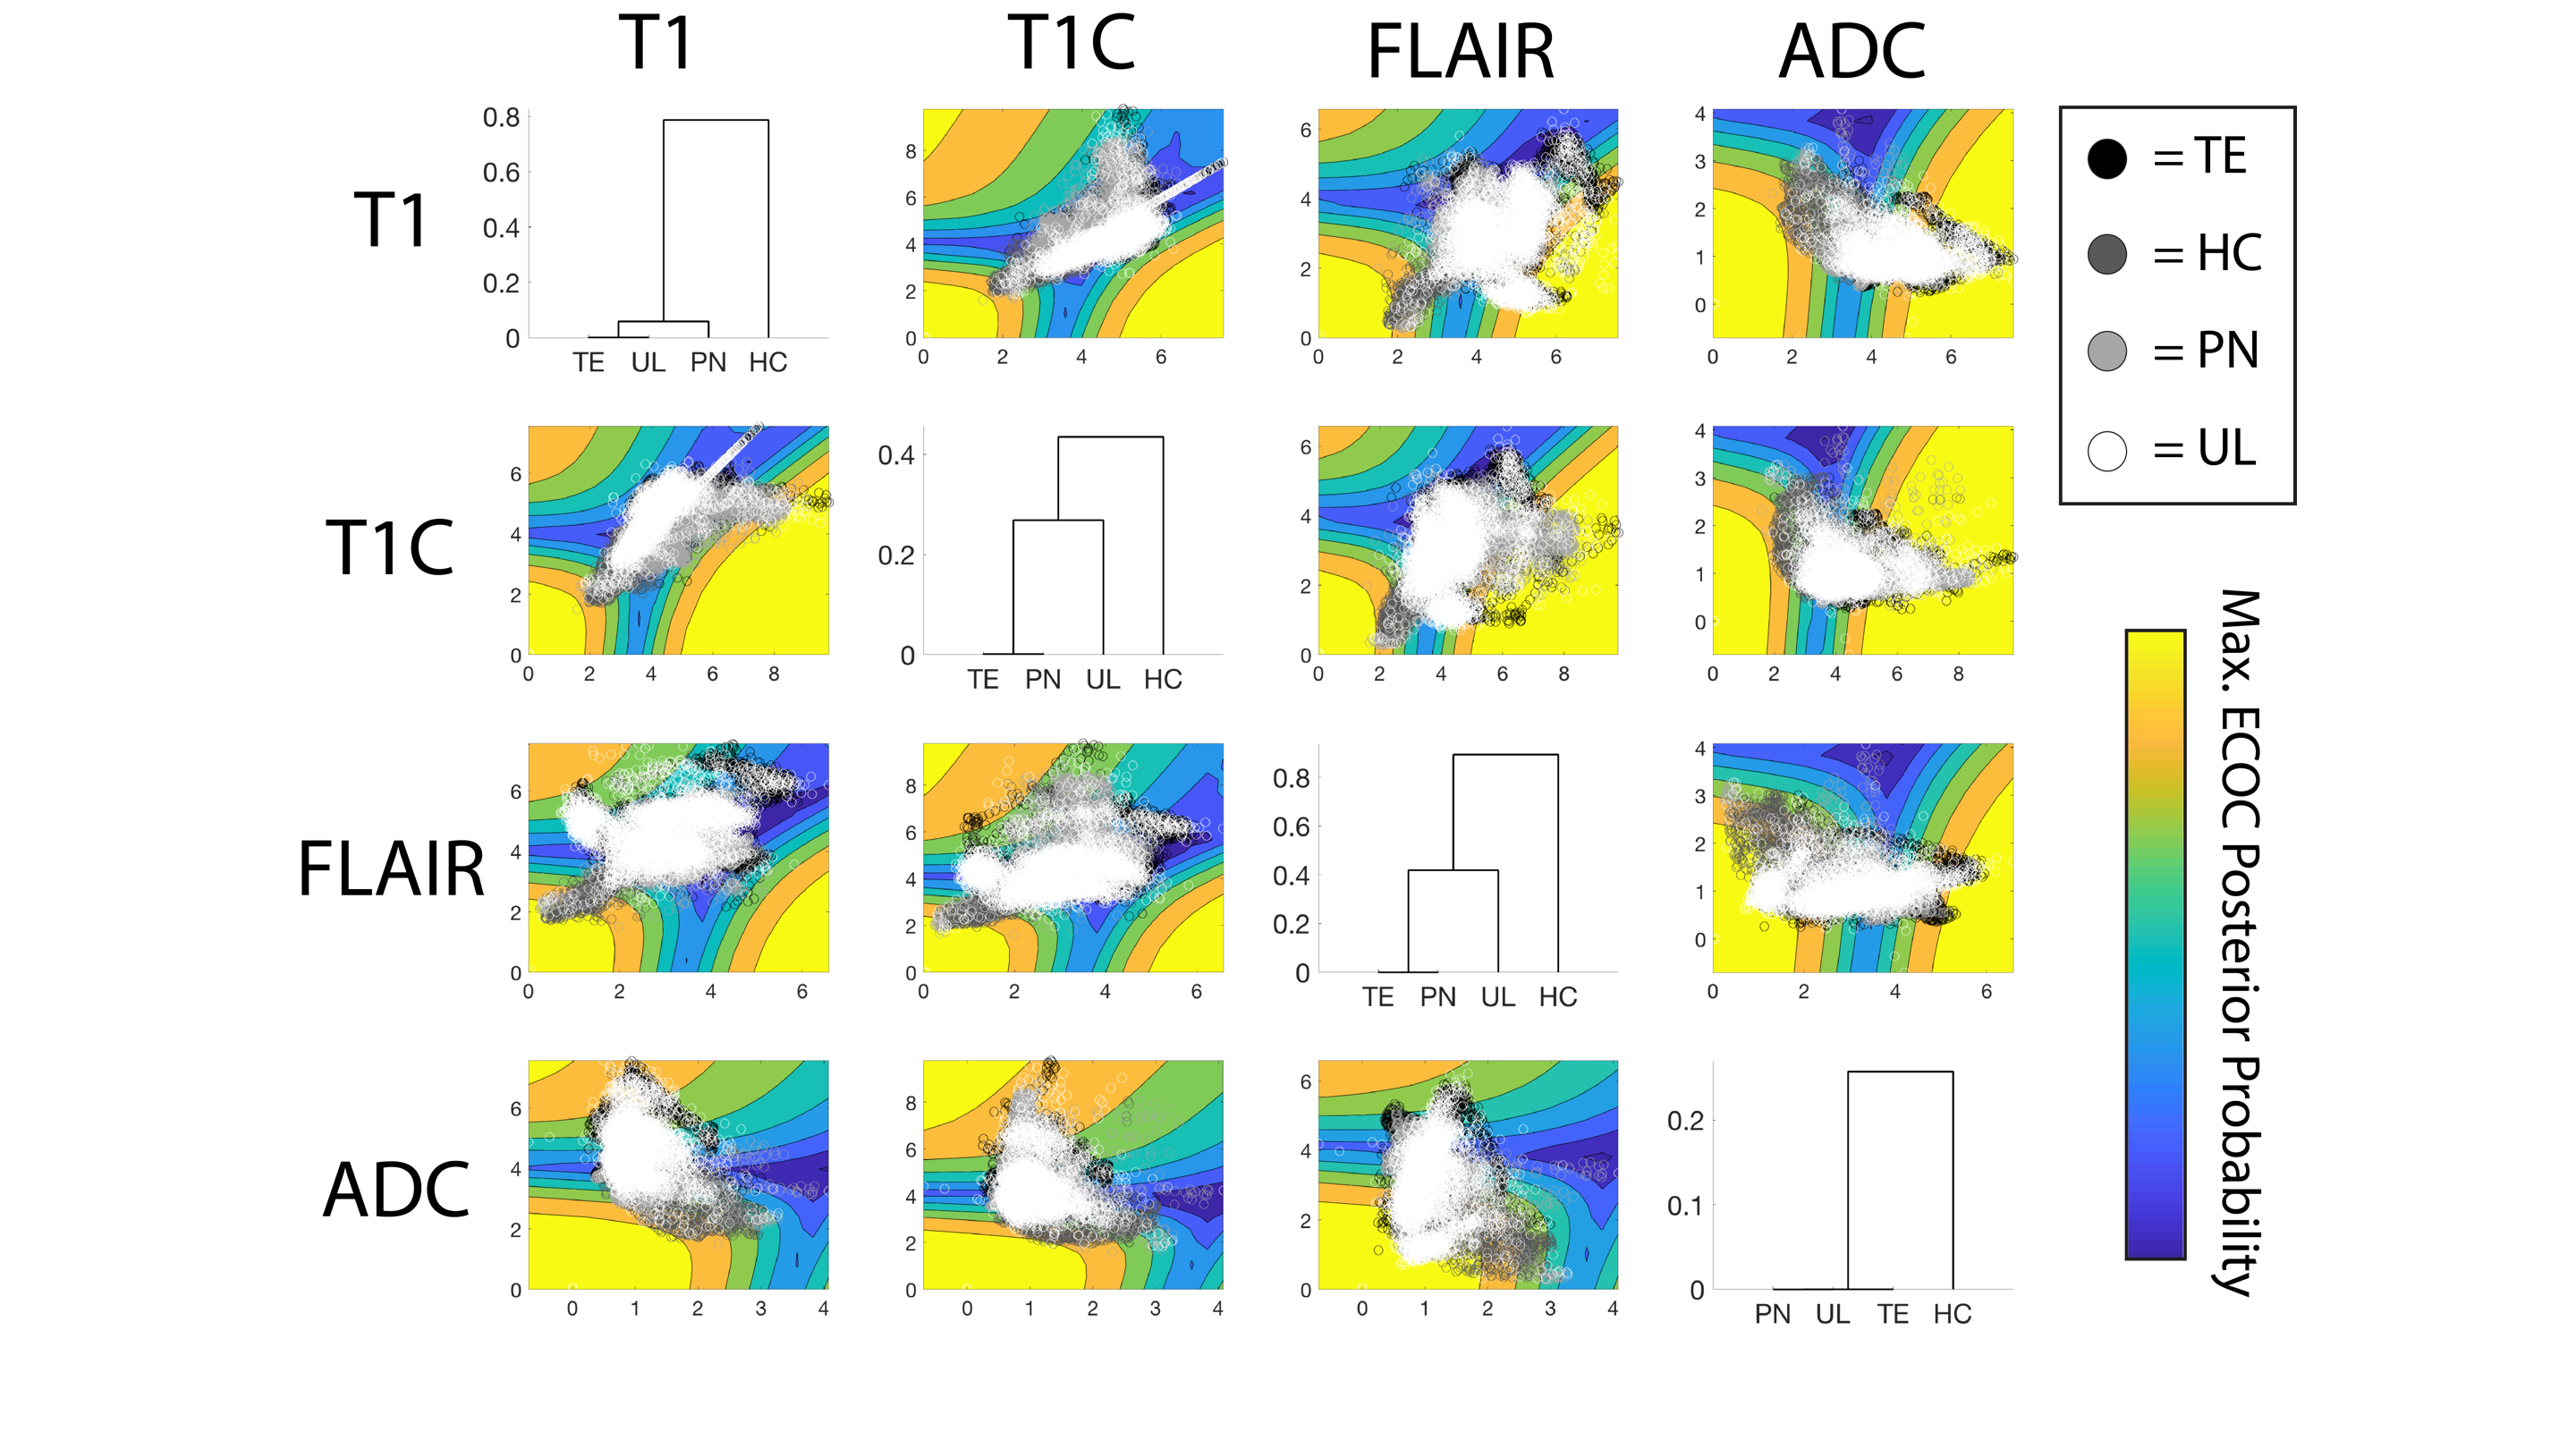
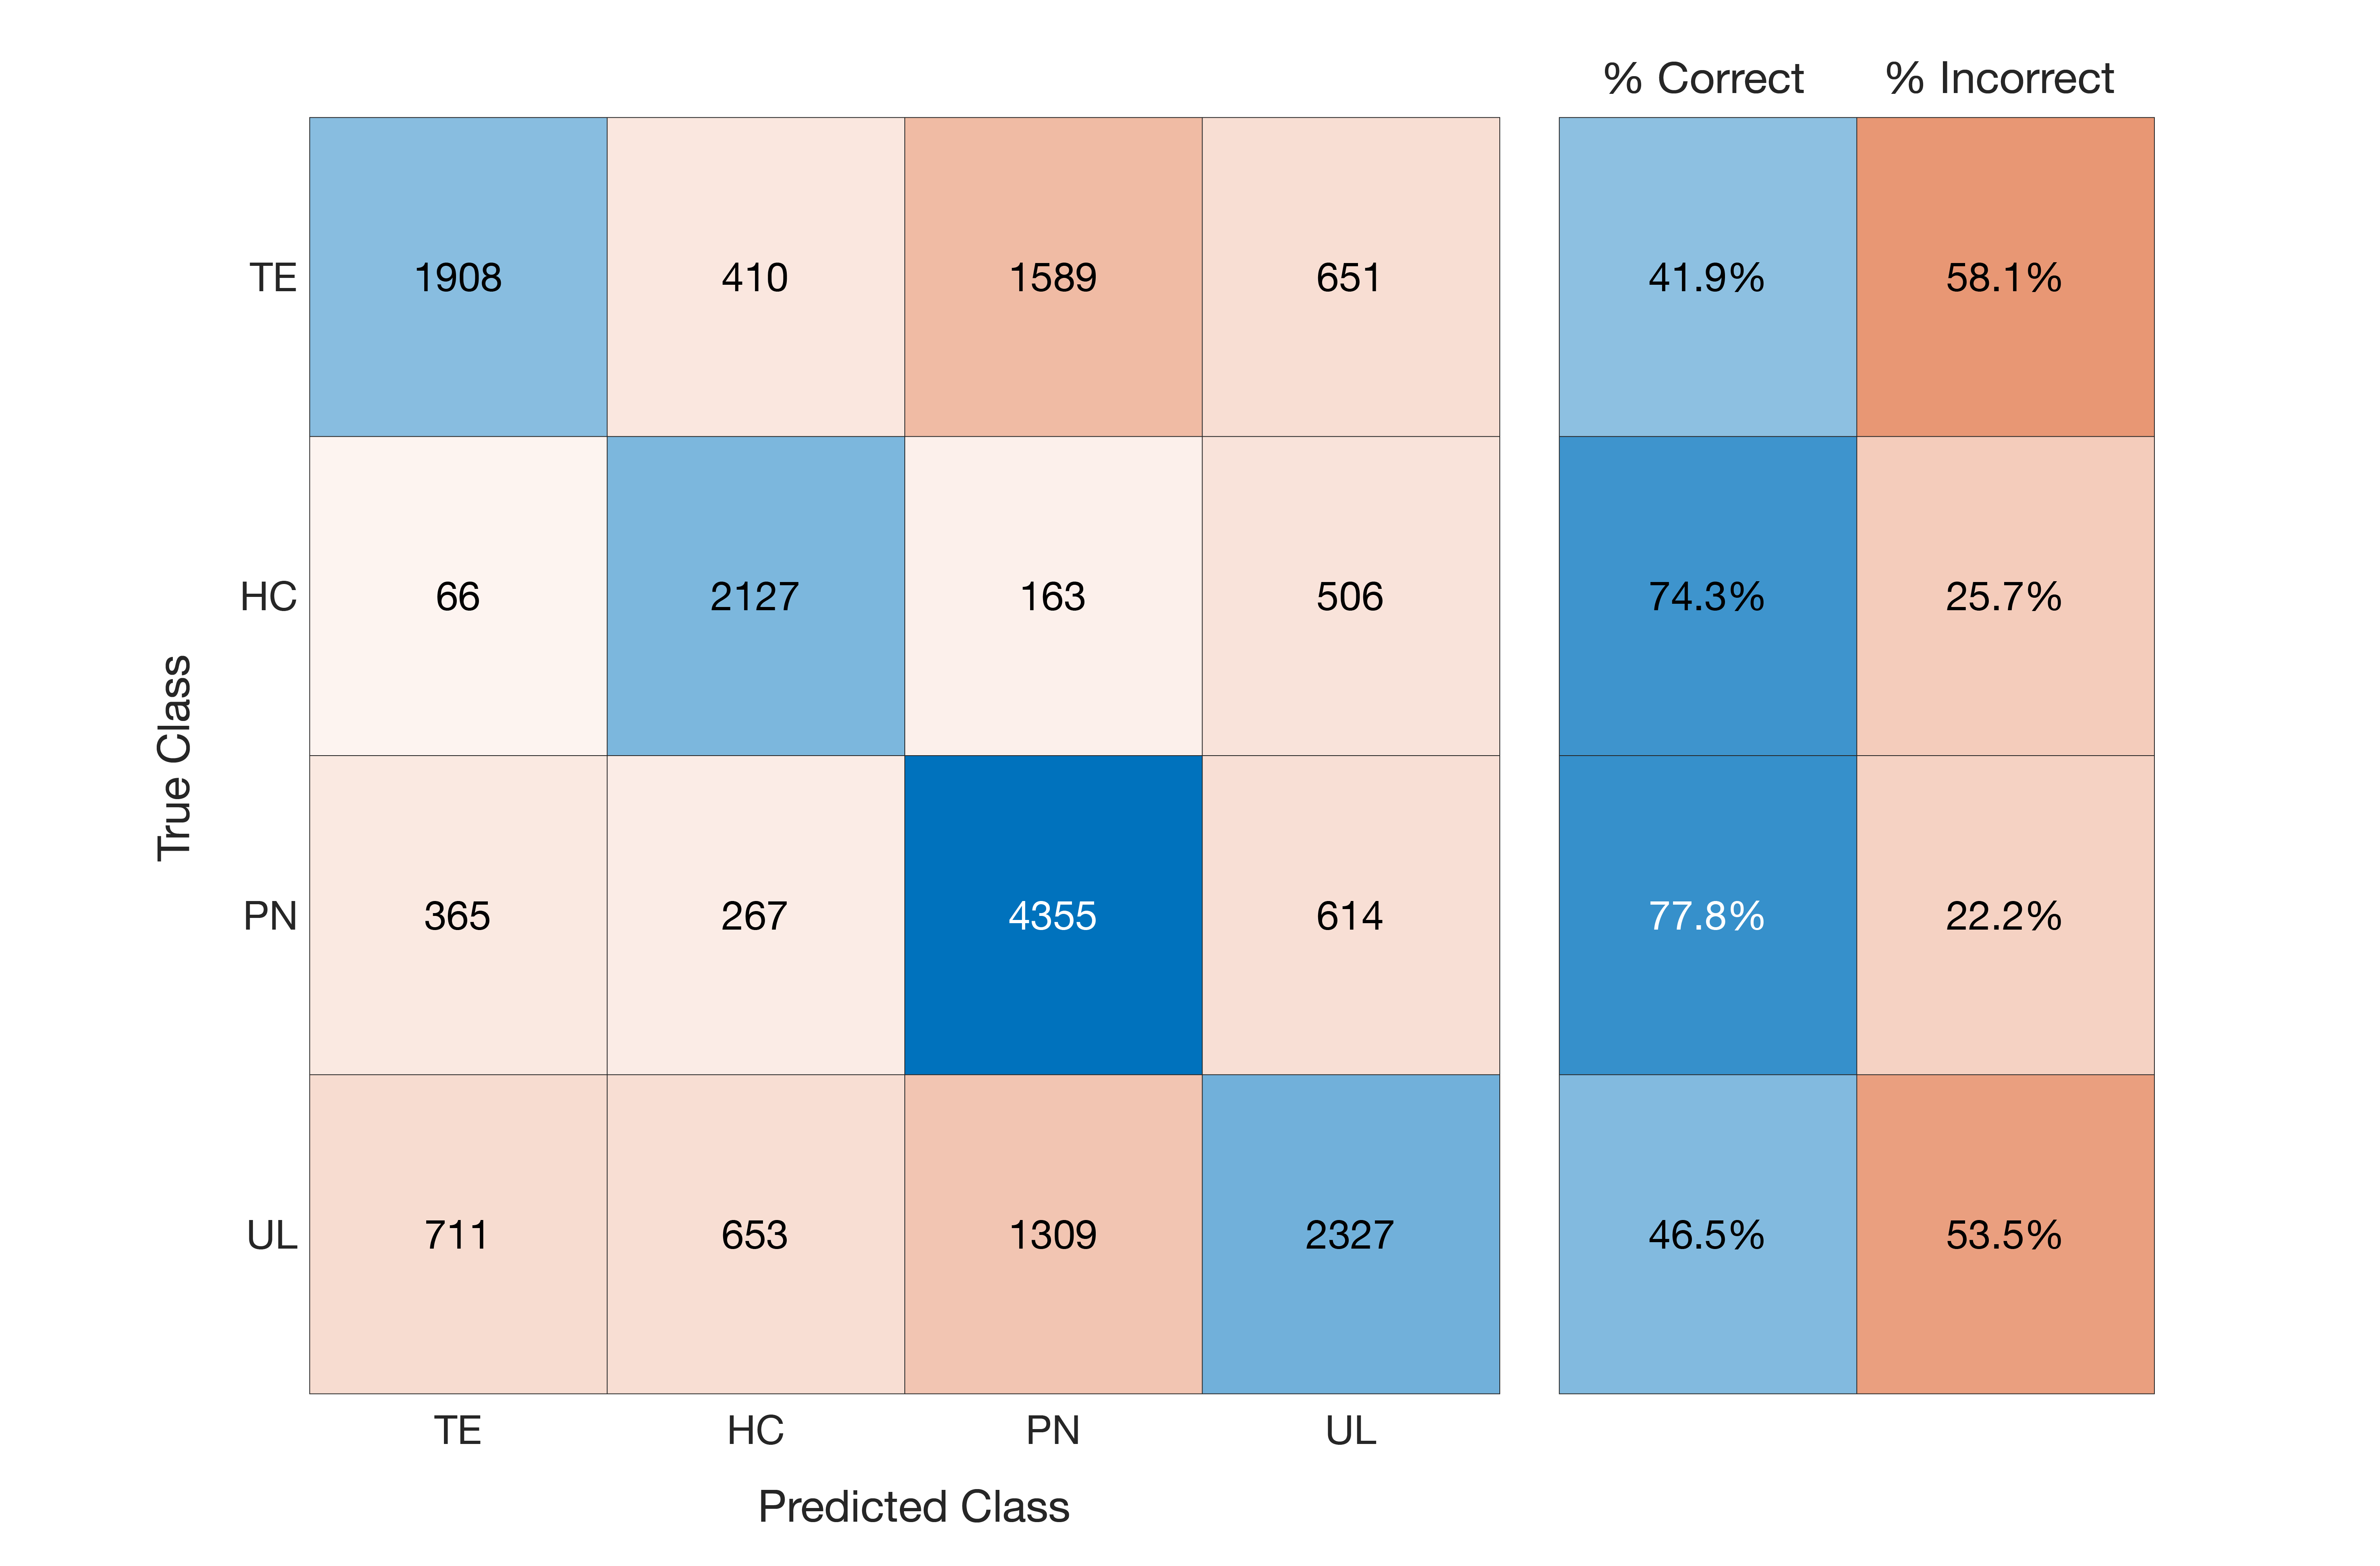
Single image intensity distributions are presented in Figure 3. Despite slight differences in distributions, single-image intensity values failed to offer annotation class separability in this sample. Although pairwise intensity distributions for each annotation seen in Figure 4 seem to reflect more distinct patterns of annotation density than in the single image characterization, these assessments still fail to distinctly separate the annotation classes. Overall classification error for the ensemble learner was 40%, with two of the four classes (HC and PN) predicted accurately in a majority of cases. A confusion matrix for the ensemble classifier is presented in Figure 5.Discussion
These results address the complexity of the relationship between MRI intensity values and pathologically defined regions. Surprisingly, the ADC pairing provided the least distinct intensity distribution for the HC class, suggesting that areas of restricted diffusion may not be as selective for regions of hypercellularity after the course of treatment and warranting future research. Furthermore, the pairwise assessment of class separability in terms of the T1 and T1C [LP1] values did not reveal substantial class distinctions, despite demonstrating increased separability compared to the single image models in line with prior literature on T1 subtraction maps and ADC-FLAIR mismatch [5,6]. The single and pairwise image findings suggest a need for caution in interpretation of individual MR images with regards to pathological features of brain cancer.Despite the poor class separation of annotations seen in single image intensity and in pairwise intensities, ensemble-based modeling based on all four images provided meaningful separation between annotation classes. This suggests that a multiparametric relationship between MRI values and pathologically relevant characteristics does exist, albeit a relationship dependent on complex modeling for precise assessment. We were able to achieve modest class distinguishability given our small sample size, and future studies of larger data sets should be able to expound on this relationship and potentially provide tools for clinical assessment using MR-predicted pathological annotation labels. [LP1]OUCH! Suggest that treatment may change things and that future research is necessary. Also cite my 2014 paper, which combined ADC and FLAIR to find hypercellularity.
Conclusion
Though pathological annotations do not demonstrate distinguishability in individual and pairwise assessments of MRI intensity values, predictive models using multiparametric imaging are able to predict post-mortem pathological annotations with modest accuracy.Acknowledgements
We would like to thank our patients for their participation in this study and our funding sources: American Brain Tumor Association DG14004, R01CA218144, R01CA218144-02S1, and R21CA23189201.References
1 Chen S-D, Hou P-F, Lou L, et al. The correlation between MR diffusion-weighted imaging and pathological grades on glioma. Eur Rev Med Pharmacol Sci 2014;18:1904–9.
2 Durand-Munoz C, Flores-Alvarez E, Moreno-Jimenez S, et al. Pre-operative apparent diffusion coefficient values and tumour region volumes as prognostic biomarkers in glioblastoma: correlation and progression-free survival analyses. Insights Imaging 2019;10:36. doi:10.1186/s13244-019-0724-8
3 Eidel O, Neumann J-O, Burth S, et al. Automatic Analysis of Cellularity in Glioblastoma and Correlation with ADC Using Trajectory Analysis and Automatic Nuclei Counting. PLoS One 2016;11:e0160250. doi:10.1371/journal.pone.0160250
4 Surov A, Meyer HJ, Wienke A. Correlation between apparent diffusion coefficient (ADC) and cellularity is different in several tumors: a meta-analysis. Oncotarget 2017;8:59492–9. doi:10.18632/oncotarget.17752
5 LaViolette PS, Mickevicius NJ, Cochran EJ, et al. Precise ex vivo histological validation of heightened cellularity and diffusion-restricted necrosis in regions of dark apparent diffusion coefficient in 7 cases of high-grade glioma. Neuro Oncol 2014;16:1599–606. doi:10.1093/neuonc/nou142
6 Ellingson BM, Aftab DT, Schwab GM, et al. Volumetric response quantified using T1 subtraction predicts long-term survival benefit from cabozantinib monotherapy in recurrent glioblastoma. Neuro Oncol 2018;20:1411–8. doi:10.1093/neuonc/noy054
Figures