1716
Histogram-based CBF quantification allows prediction of histopathologic grade and molecular markers in de novo brain gliomas1Department of Radiology, Johns Hopkins University School of Medicine, Baltimore, MD, United States, 2Department of Neurosurgery, Johns Hopkins University School of Medicine, Baltimore, MD, United States
Synopsis
We developed a histogram-based CBF analysis method for the prediction of tumor histopathologic grade and molecular marker (including IDH1 mutation, ATRX loss, p53 mutation, MGMT methylation, and 1p/19q co-deletion) in a group of de novo brain glioma patients. ASL MRI may be a non-invasive and cost-effective approach to assist in brain tumor diagnosis and prognosis.
Introduction
Perfusion MRI has the potential to play an important role in the diagnosis and management of brain tumors since the formation of new blood vessels (i.e. angiogenesis) is an essential component for glioma survival, growth, and malignancy[1]. ASL MRI is a noninvasive quantitative technique for perfusion assessment. Despite substantial efforts in prior literature to use ASL to predict the diagnosis and prognosis of brain tumor patients, ASL remains relatively under-utilized in clinical practice [2]. An important feature that was insufficiently accounted for in previous work is that gliomas tend to be highly heterogeneous spatially, thus an averaging-over-ROI approach will unsurprisingly encounter difficulties in terms of its predictive value. Here we sought to take advantage of these heterogeneities (rather than being limited by them) and develop a series of histogram-based CBF indices and evaluated their association with histopathologic grade in de novo brain tumor patients. Furthermore, given the increasing importance of molecular markers in glioma classification and prognosis [3], the associations between these advanced CBF indices and molecular markers, including IDH1 mutation, ATRX loss, p53 mutation, MGMT methylation, and 1p/19q co-deletion, were also investigated.Methods:
Patients: Sixteen de novo brain tumor patients (age 21-81y, 11M/5F) were scanned on 3T (Philips), after IRB-approved informed consent was obtained. Twelve patients have since undergone surgical intervention and histopathologic tumor grades were obtained.Imaging parameters: The MRI procedures included a pseudo-continuous arterial-spin-labeling (pCASL), a T2-FLAIR, and a T1-MPRAGE scan, among other sequences. Post-contrast T1 was not performed in all patients, this was not used in tumor characterization. For pCASL, labeling duration=1800ms, a relatively long post-labeling delay of 2200ms was used to ensure that the labeled spins have reached a tissue in the presence of tortuous vessels in the tumor, segmented 3DGRASE acquisition with background-suppression, FOV=204*204*124mm3, resolution=3.2*3.2*3.2mm3, 6 control/label pairs. Markers relevant to molecular classification of brain tumors were obtained from standard clinical procedures and included IDH1, ATRX, p53 mutation, MGMT methylation, and 1p/19q co-deletion [4,5].
Data processing: PCASL data were processed by using ASL-MRICloud [6] and both absolute and relative CBF maps were obtained. Previous literature has suggested that, for focal brain lesions, relative CBF (rCBF) is more sensitive to characterize pathology because it factors out global hemodynamic influences such as caffeine and arterial CO2 level. Thus our analysis focused on rCBF. The rCBF maps and FLAIR images were co-registered to MPRAGE images and subsequently normalized to MNI standard space. Regions-of-interest (ROI) of brain tumors were manually delineated on FLAIR images. The ROIs were drawn somewhat liberally to include all T2-FLAIR-hyperintense regions to delineate the full extent of the tumor and peritumoral edema. The ROIs were then applied to the rCBF maps to obtain a histogram of CBFwithin the tumor region.
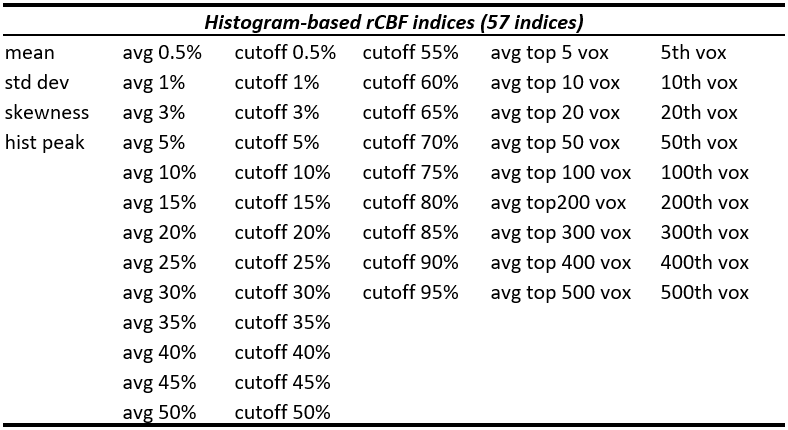
A total of 57 CBF indices were derived from the histogram (see Table 1). We included standard indices such as mean rCBF value in the ROI, standard deviation across voxels, skewness of the distribution, and peak value in the histogram,but also examined rank based indices such as the average of top m% voxels and the average of top n voxels, as well as cutoff rCBF values in the top percentile voxels. An illustration of these indices on the histogram is shown in Figure 1.
Statistical analysis: Using multi-linear regression, the histogram-based rCBF indices were compared with histopathologic tumor grade and various molecular markers to determine any significant associations, with age as a covariate.
Results
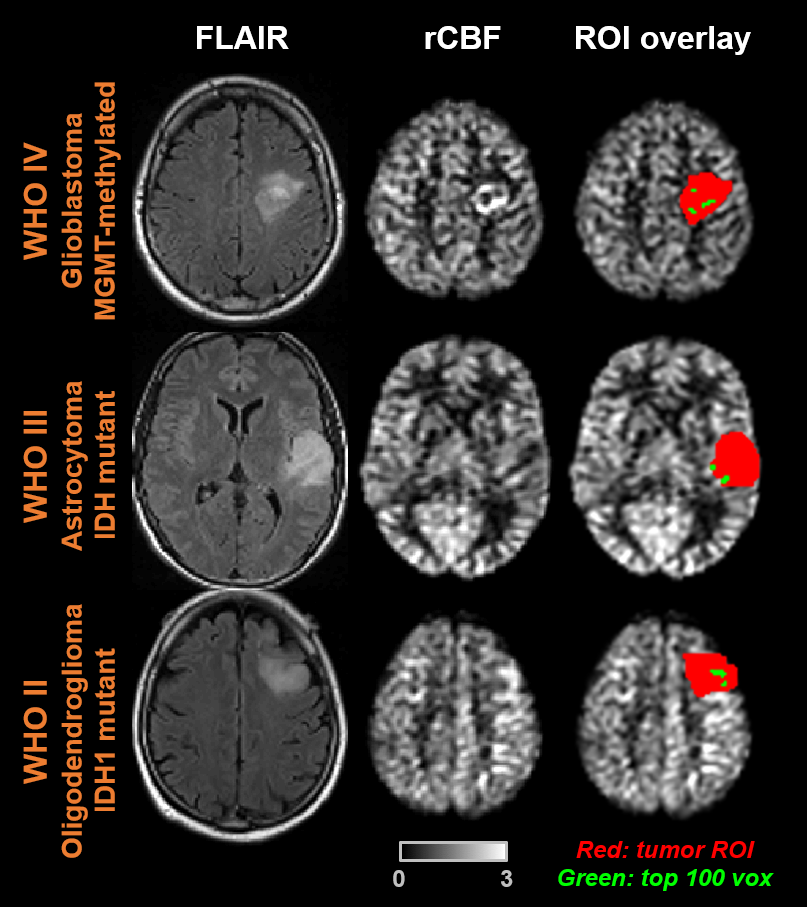
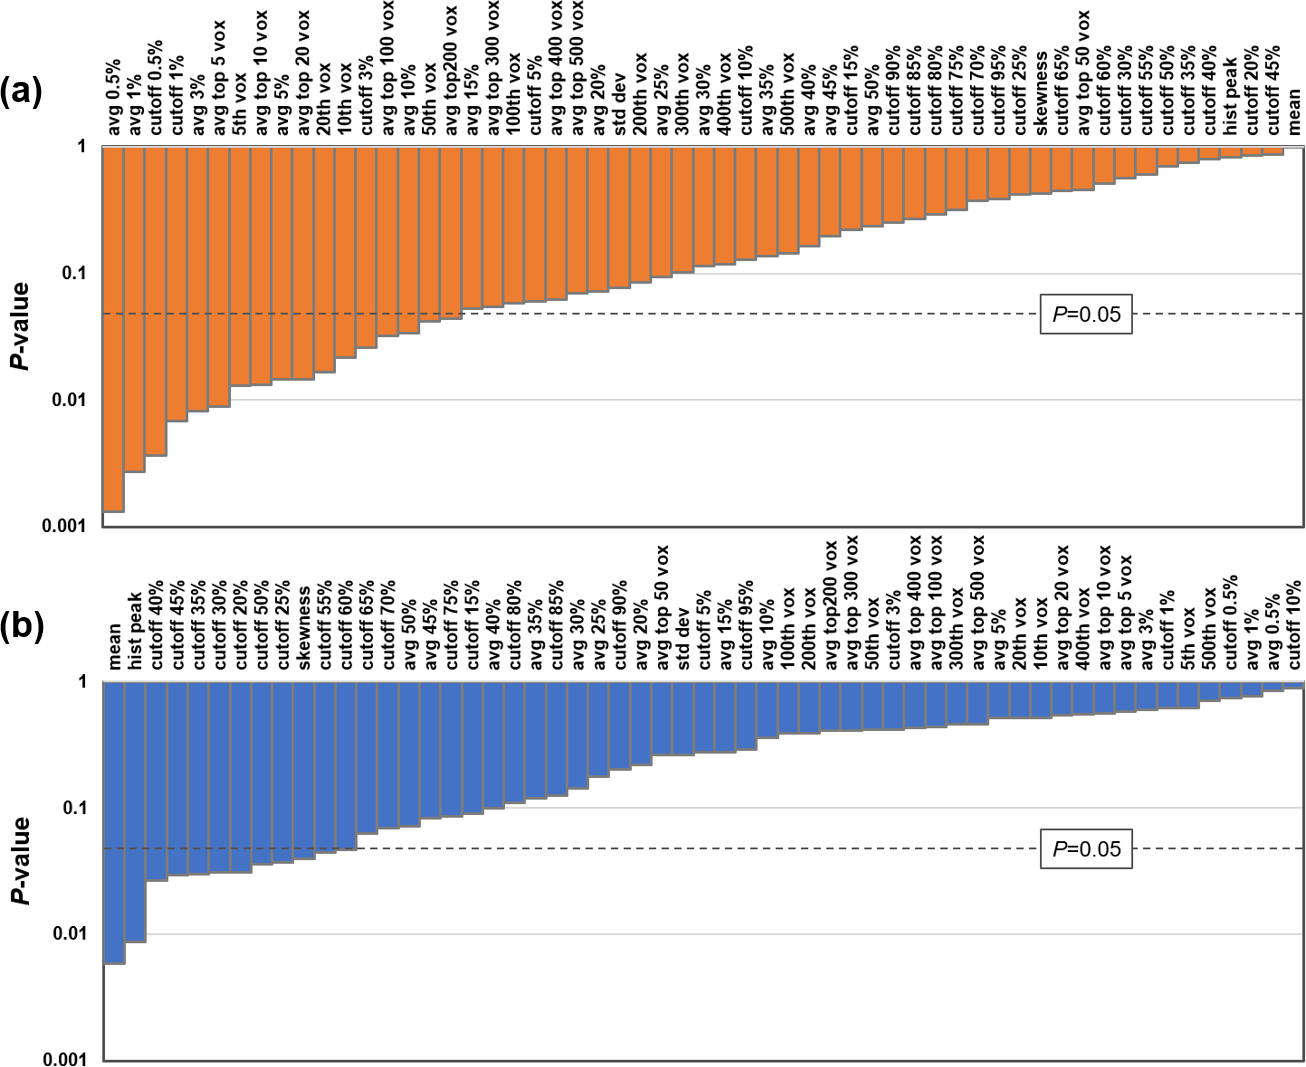
Table 2 lists the demographics and characteristics of all patients enrolled. Figure 2 shows FLAIR and rCBF maps from three representative glioma patients. The overlay of manually delineated tumor ROI on the rCBF images is also shown (red). As an illustration of one of the histogram-based CBF indices, the voxels that have CBF values corresponding to the top 100 voxels in the ROI are highlighted in green. It can be seen that, in the WHO IV tumor, green voxels are located in the hyperperfused periphery of the tumor.Figure 3a shows the associations between rCBF indices and tumor grade, ranked by the level of statistical significance. Most of the significant CBF indices are based on the top CBF voxels in the ROI, either through percentile or through a fixed number of top CBF voxels, suggesting that tumor grade is best predicted by the highest perfused voxels in the tumor. For all indices, a higher WHO tumor grade was associated with higher CBF values. Interestingly, simple average CBF values in the ROI yielded minimal (p=0.99) predictive power for tumor grade.
When studying the associations between rCBF indices and molecular markers, no correlations were observed for IDH1,p53 mutation, MGMT methylation, and 1p/19q co-deletion with any of the rCBF indices. On the other hand, a number of rCBF indices were found to be associated with ATRX loss (Figure 3b). Examination of the significant rCBF indices suggests that they are mostly related to mean or median CBF values of all the voxels in the ROI, rather than rCBF values in the highest or lowest voxels.
Conclusion
We developed a histogram-based CBF analysis method for the prediction of tumor WHO histopathologic grade and molecular markers in a group of de novo brain glioma patients.Acknowledgements
No acknowledgement found.References
1. Covarrubias, D.J., B.R. Rosen, and M.H. Lev, Dynamic magnetic resonance perfusion imaging of brain tumors.Oncologist, 2004. 9(5): p. 528-37.
2. Dangouloff-Ros, V., et al., Arterial Spin Labeling to Predict Brain Tumor Grading in Children: Correlations between histopathologic Vascular Density and Perfusion MR Imaging. Radiology, 2016. 281(2): p. 553-566.
3. van den Bent, M.J., et al., A clinical perspective on the 2016 WHO brain tumor classification and routine molecular diagnostics. Neuro Oncol, 2017. 19(5): p. 614-624.
4. Yan, H., et al., IDH1 and IDH2 mutations in gliomas. N Engl J Med, 2009. 360(8): p. 765-73.
5. Nandakumar, P., A. Mansouri, and S. Das, The Role of ATRX in Glioma Biology. Front Oncol, 2017. 7: p. 236.
6. Li, Y., et al., ASL-MRICloud: An online tool for the processing of ASL MRI data. NMR Biomed, 2019. 32(2): p.e4051.
Figures