1715
Value of quantitative dynamic contrast-enhanced MR imaging in analyzing microvascular permeability1Radiology, The second affiliated hospital of Anhui Medical University, Hefei, China, 2GE Healthcare, Shanghai, China
Synopsis
DCE-MRI was used to conduct quantitative analysis of microvascular permeability in three different areas of meningioma: Lesion, Edge and Normal. 37 patients with pathologically confirmed meningioma were enrolled, while quantitative parameters were measured. The parameters of ktrans, TTP, MAX. Conc, iAUC in Lesion group and Edge group were statistically significant, and the parameters of Ktrans, kep, Ve, TTP, Max.Conc as well as AUC in Lesion group and Normal group, were statistically significance. The ktrans parameter has the highest AUC value, which means the better performance for permeability study of WHO with different grades of meningiomas and invasive meningiomas.
Purpose
To explore the value of DCE-MRI quantitatively parameters in analyzing microvessels of different tissue areas in meningioma.Methods
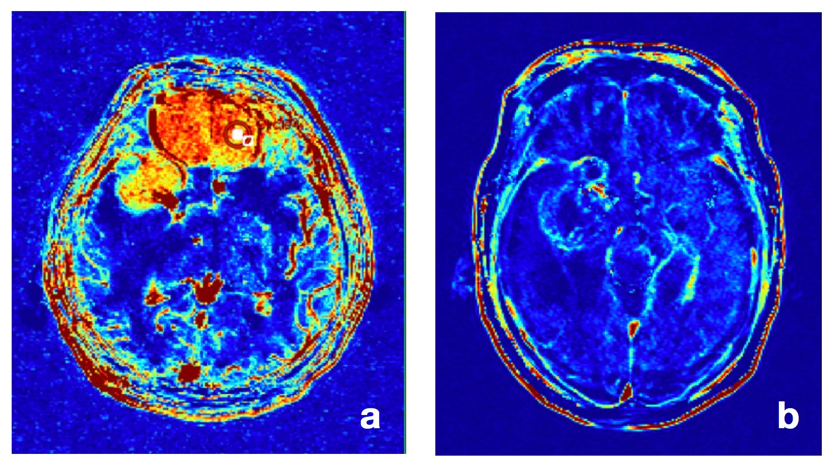
37 patients with meningioma from April 2016 to January 2019 in the second affiliated hospital of Anhui medical university were retrospectively analyzed in this study.Brain DCE-MRI scan(3.0T MRI) was performed on all the patients. Scan parameters: 3D Vibe, TR/TE (ms):3.89/1.37, Base resolution/Phase resolution:258/85%, Slice Thickness/Slice resolution:3/63%, Flip Angle :3,10,15, Perfusion Flip :15, Bandwidth:520Hz/Px.Contrast agent: gadolinium diamine injection (OMNISCAN,Gd-DTPA-BMA), injection rate: 0.1mmol/kg, 2ml/s.Normal saline: 20ml, injection rate 2ml/s. DCE with 70 phases were performed, and contrast agent injection was started in the 4th phase. DCE-MR quantitative processing model adopted Extended Tofts-Kety two-compartment model. Omni-kinetics (OK,GE healthcare) software was used for image post-processing. ROI was defined in three different tissues of meningioma, tumor parenchyma enhancement area(lesion), tumor peripheral area within 1cm (edge)and normal brain tissue area on the contralateral side(normal). Quantitative parameters were measured as: Ktrans, kep, Ve, vp, TTP, MAX.Conc, AUC, MAXSlope,etc(Figure 1). SPSS was used to the statistical data. By ANOVA analysis, Bonferroni correction test validity α=0.05 was used for pairwise comparison, while P <0.05 was considered statistically significant.Results
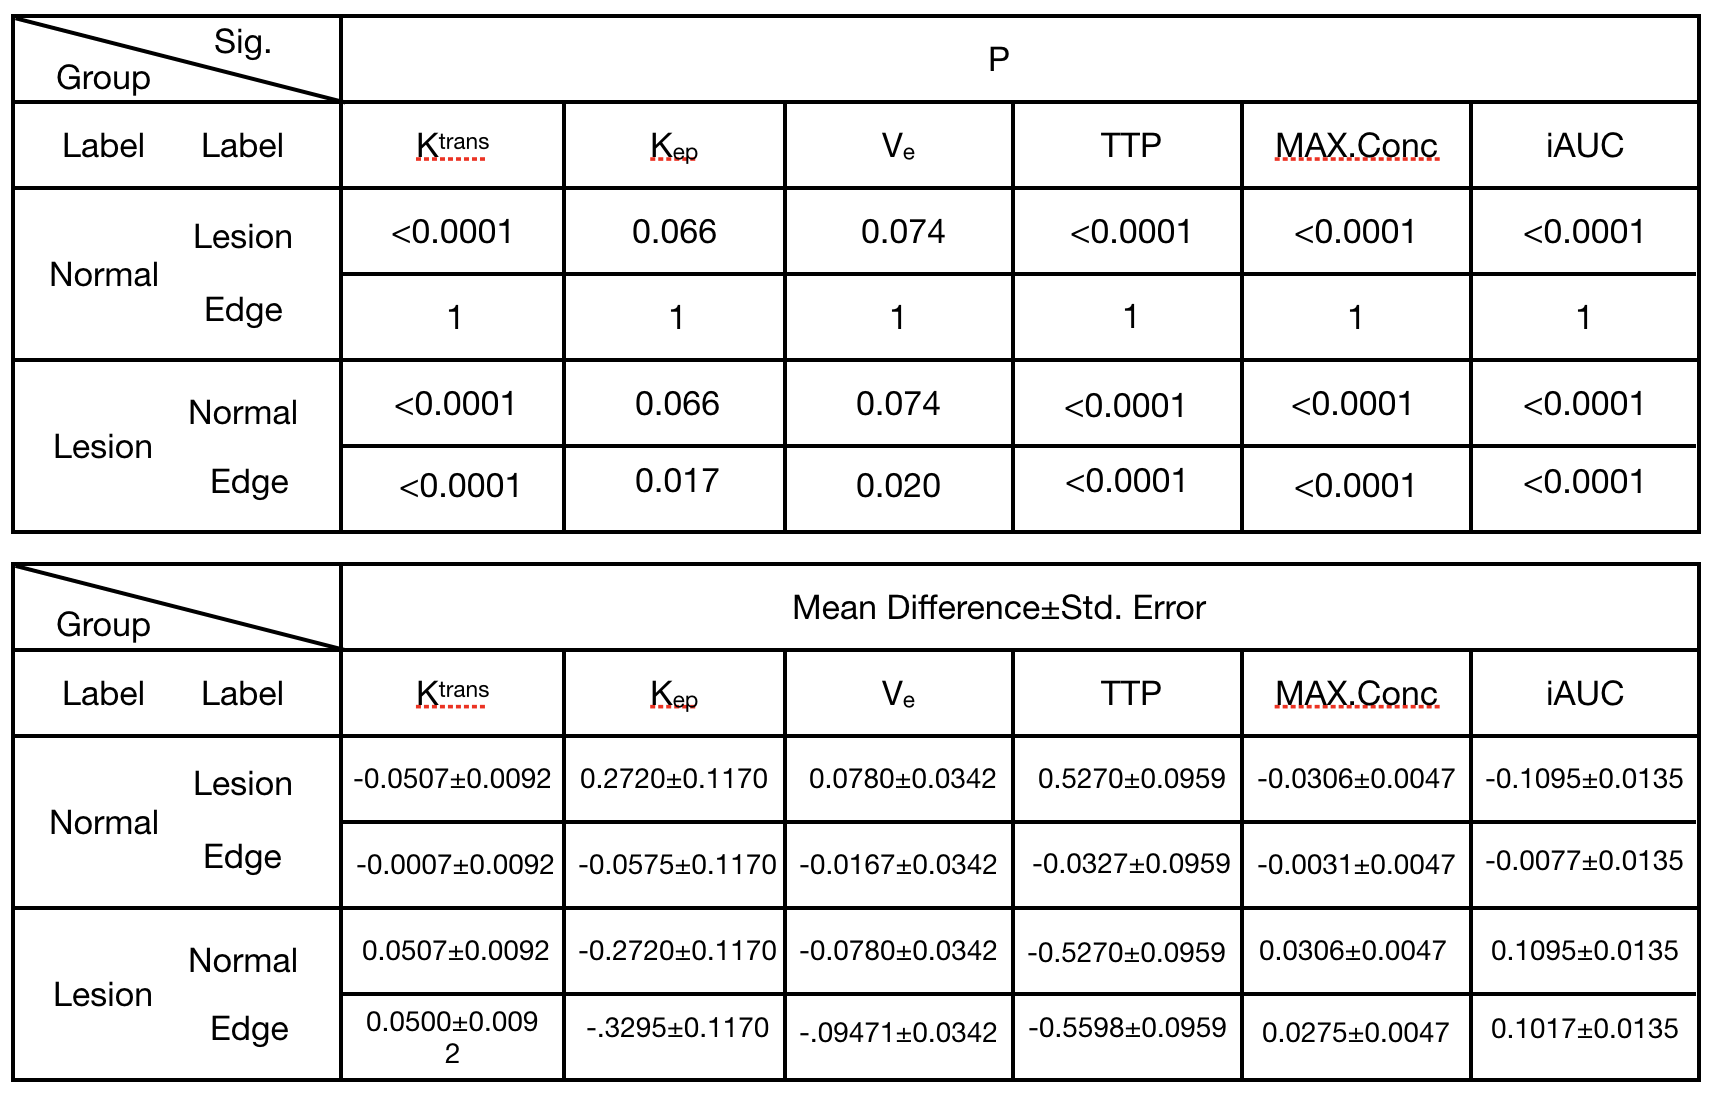
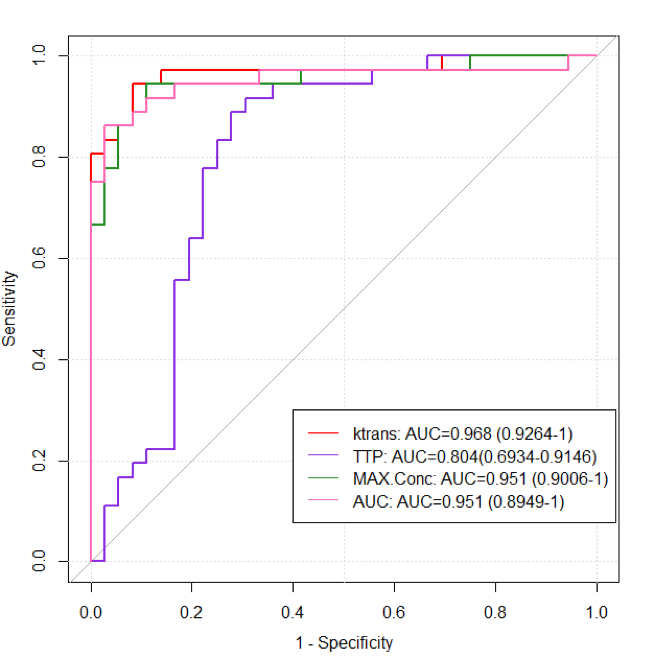
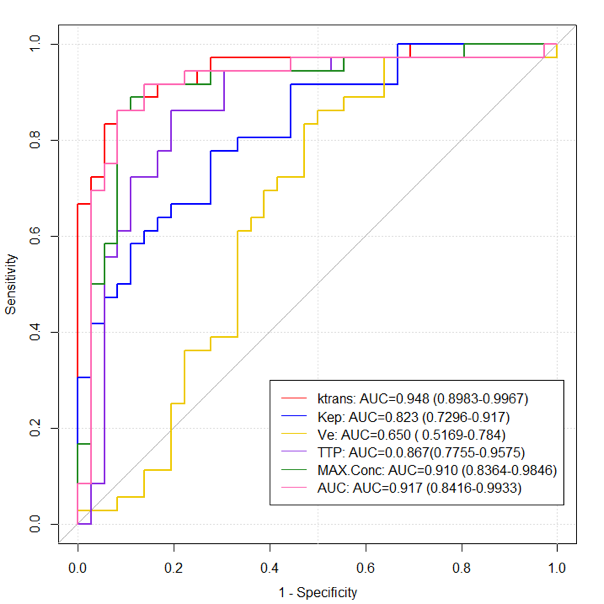
Among the 37 patients with meningioma, 22 were female and 15 were male.Patients ranged in age from 40 to 76 years old.In the comparison between normal group and lesion group, Ktrans, TTP, max-conc and iAUC were significantly different (p<0.05). Comparison between lesion group and edge group, Ktrans, kep, Ve, TTP, Max. Conc and iAUC had significant difference (p < 0.05). Comparison between normal group and edge group, all parameters have no significant difference(Table 1). ROC analyze were applied to the significant parameters and AUC value were calculated. It was show that Ktrans parameter had the highest discrimination efficiency. Comparison between the lesion group and the normal group, and between lesion group and edge group, AUC value reached 0.968 and 0.948 respectively; AUC values of iAUC in the two groups were 0.951 and 0.917, respectively; AUC values of TTP in the two groups were 0.804 and 0.867, respectively(Figure 2.3).Discussion and Conclusion
Some Clinically meningiomas are invasive and recurrent. Because of excessive vascular hyperplasia, meningiomas are also highly permeable1. Some malignant meningiomas are easy to destroy the cerebrovascular barrier and form tumor angiogenesis to the surrounding areas2. Conventional MRI is limited in analyzing cerebrovascular permeability of meningioma, while DCE-MRI can determine whether there is neovascularization in the peripheral area of tumor by obtaining the main vascular permeability parameters of tumor and its surrounding area3.Among these parameters of DCE-MR, ktrans, kep, TTP, MAX.Conc and AUC had significant differences. In addition, it has a good identification performance, which can be used to evaluate the permeability of the blood vessels of meningioma and provide help for the differential diagnosis of atypical meningioma.There were significant statistical differences between parenchyma area of meningioma and peripheral area of tumor, while there were no statistical differences between peripheral area of meningioma and contralateral normal brain tissue area, that may be related to the small sample size in this study. The pathological and immunohistochemical results of most subjects were meningiomas classified by WHO grade I, and the growth characteristics of meningiomas may be stable to some extent. Therefore, there was no significant difference between the vascular permeability of the tumor peripheral area and normal brain tissue. In subsequent studies, including atypical meningiomas, meningiomas of different WHO levels, and meningiomas with certain invasive or recurrent features, whether there is neovascularization in the surrounding area of their masses or there is changing in vascular permeability, are all issues that we want to address.Acknowledgements
This work was supported by Science research foundation of Anhui medical university, China, No. 2018xjk054References
1. Thomas AA, Arevalo-Perez J, Kaley T, et al. Dynamic contrast enhanced T1 MRI perfusion differentiates pseudoprogression from recurrent glioblastoma. Neurooncol. 2015,125(1): 183-190.
2. Chidambaram S, Pannullo SC, Roytman M, et al. Dynamic contrast-enhanced magnetic resonance imaging perfusion characteristics in meningiomas treated with resection and adjuvant radiosurgery. Neurosurg Focus. 2019,46(6): E10.
3. O'Neill AF, Qin L, Wen PY, et al. Demonstration of DCE-MRI as an early pharmacodynamic biomarker of response to VEGF Trap in glioblastoma. Neurooncol. 2016,130(3): 495-503.
Figures