1714
3D arterial spin labeling (3D-ASL) MR perfusion imaging application in differentiation primary CNS lymphoma from metastatic brain tumors1MR, Affiliated hospital of Jiangnan university, Wuxi, China, 2MR research, GE healthcare,MR research China, Beijing, China
Synopsis
CBF values of PCNSL are significant lower than those of MBT, and this is helpful to differentiate the two tumors by using 3D ASL MR perfusion imaging from quantitative parameters analyses.
Abstract
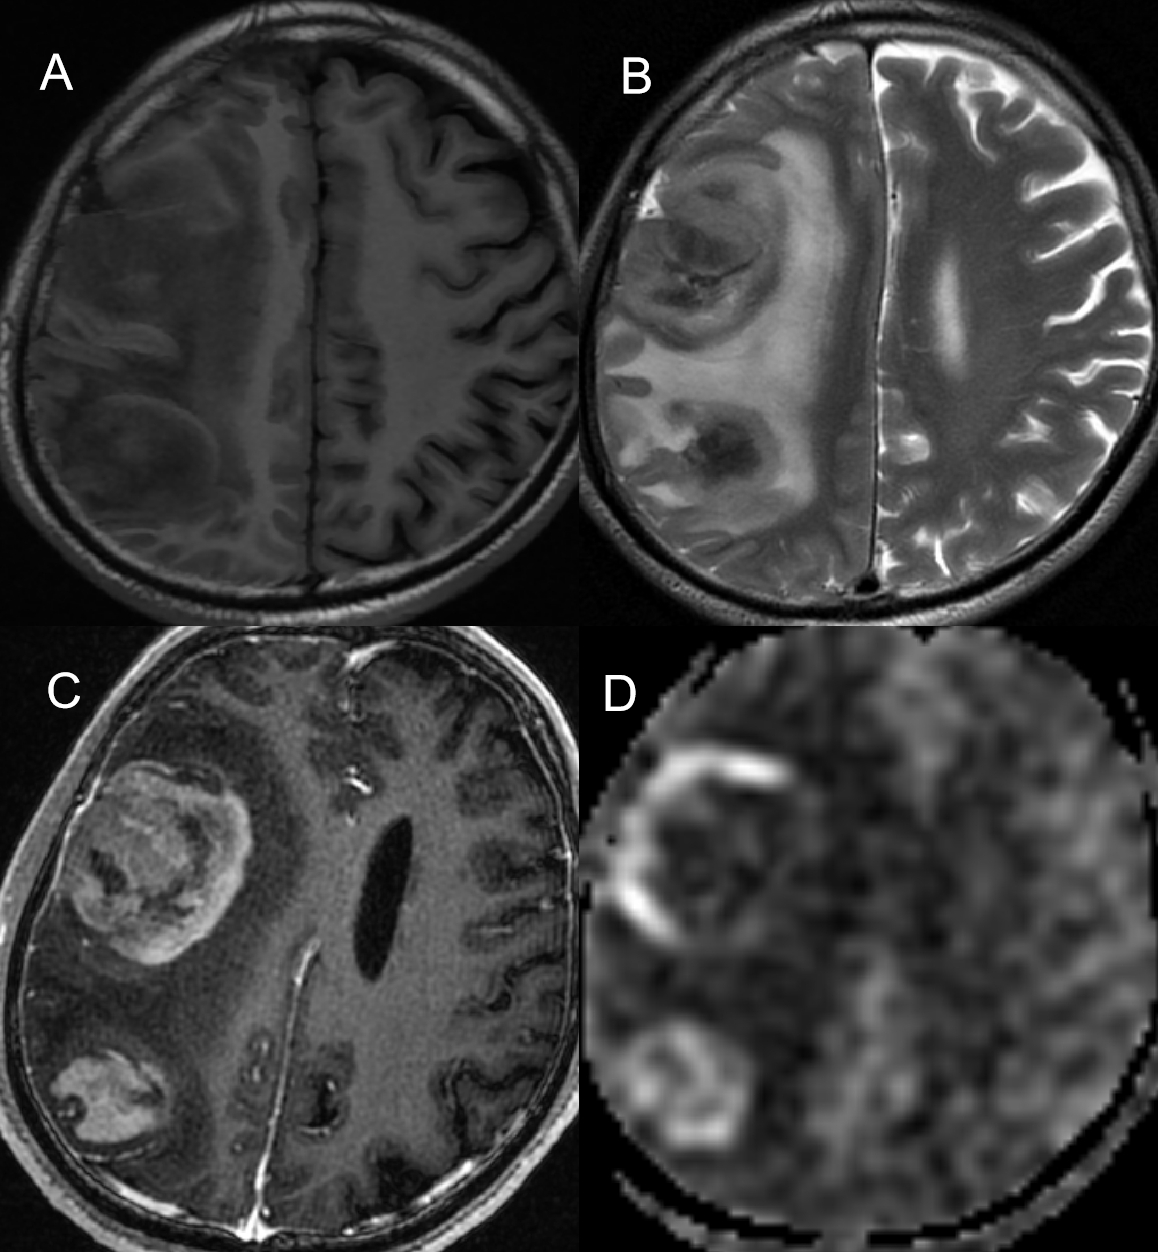
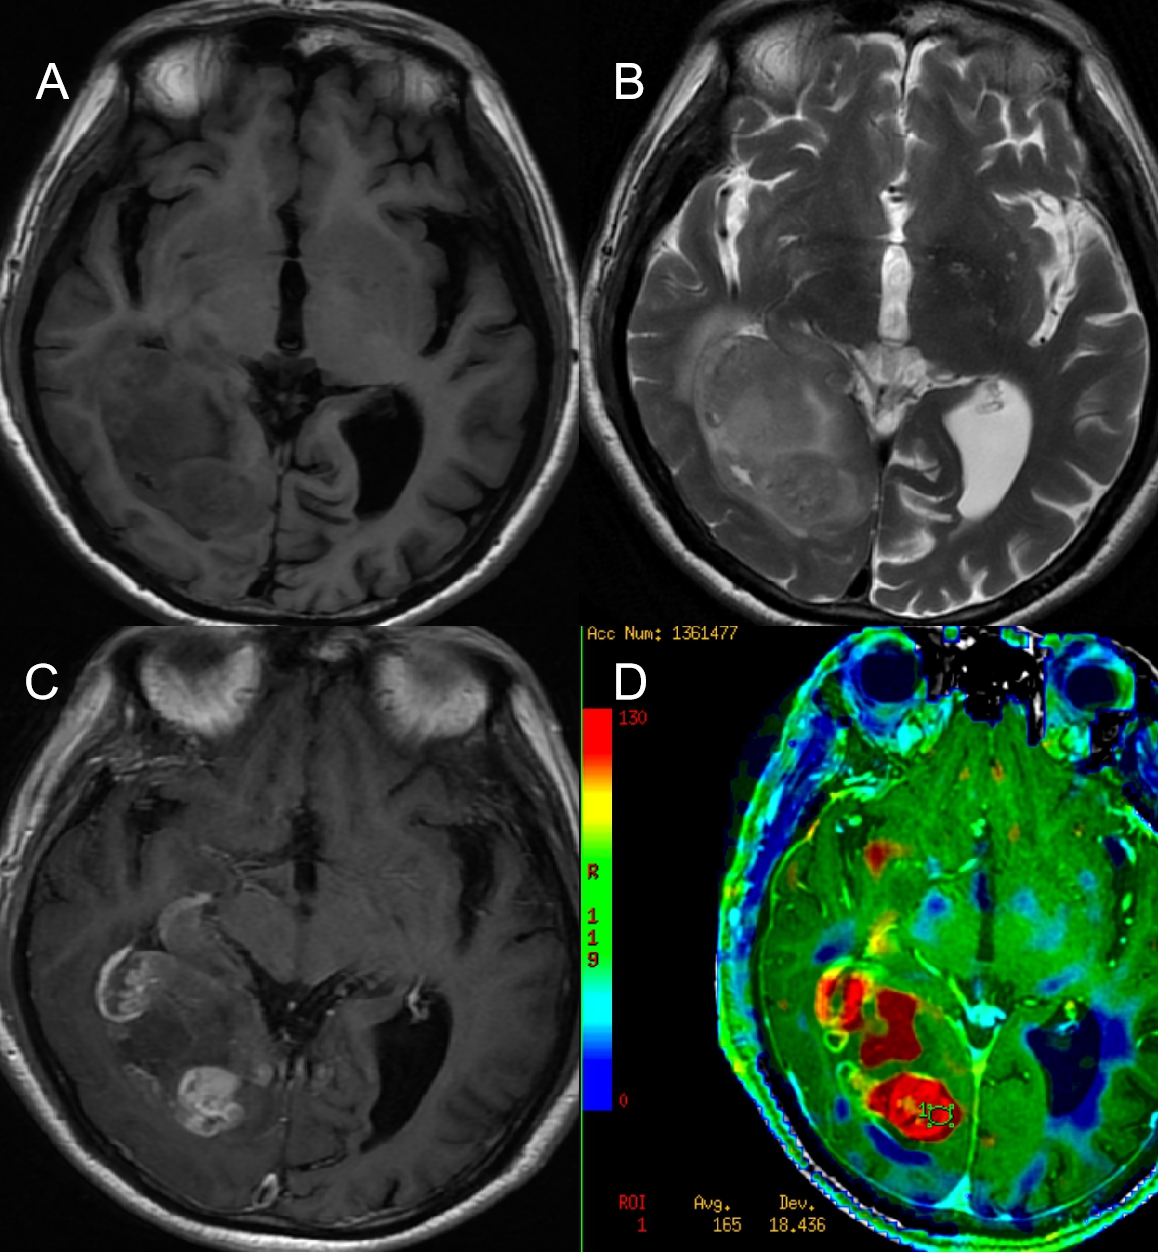
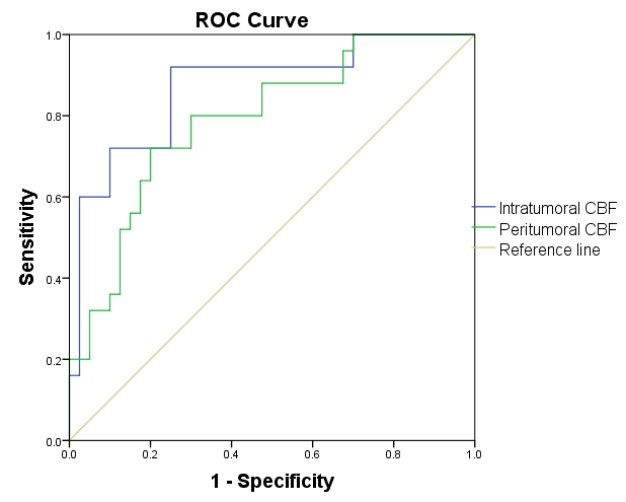
OBJECTIVES: To differentiate quantitatively primary CNS lymphoma (PCNSL) from metastatic brain tumors (MBT) by using 3D arterial spin labeling (3D-ASL) MR imaging with blood perfusion parameter.METHODS: The pathologically confirmed PCNSL (n = 25) and MBT (n = 40) patients performed 3D-ASL MR perfusion imaging examination. The parameter cerebral blood flow (CBF) of intra- and peritumoral regions and the contralateral hemisphere (control regions) were all measured on perfusion maps in two kinds of tumors. CBF values between intratumoral and peritumoral regions and the control regions in PCNSL were statistically compared by one-way analysis of variance (ANOVA); As well, CBF values between intratumoral and peritumoral regions and the control regions in MBT were statistically compared by one-way ANOVA; CBF values of intratumoral and peritumoral regions between PCNSL and MBT were statistically compared by two independent sample t-test. In addition, the area under the receiver-operating characteristic (ROC) curve was used to determine the diagnostic accuracy of ASL for differentiating PCNSL from MBT. Intraclass correlation coefficients (ICCs) were used to assess reliability between two readers.RESULTS: Interobserver agreements for intratumoral and peritumoral CBF measurements were both excellent (ICC = 0.938, 0.926; respectively). In quantitative analysis, CBF values of intratumoral and peritumoral regions in PCNSL were slightly higher than those of control regions ( 67.81 ± 0.14 vs. 64.77 ± 0.31; 65.78 ± 0.23 vs. 64.76 ± 0.45; p > 0.05, respectively). However, CBF values of intratumoral and peritumoral regions in MBT were significantly higher than those of control regions ( 165.79 ± 0.63 vs. 62.86 ± 0.82; 87.52 ± 0.47 vs. 62.12 ± 0.38; p < 0.01, respectively); There were significantly statistical differences in CBF values of intratumoral and peritumoral regions between PCNSL and MBT (p < 0.01, respectively). CBF values of intratumoral regions showed better diagnostic efficacy than those of peritumoral regions in differentiating the two tumors (area under the ROC curve: 0.871 vs. 0.790; p > 0.05).CONCLUSIONS: CBF values of PCNSL are significant lower than those of MBT, and this is helpful to differentiate the two tumors by using 3D ASL MR perfusion imaging from quantitative parameters analyses.Acknowledgements
We would like to acknowledge Professor weiqiang dou for his technical help.References
1. White CM, Pope WB, Zaw T, et al. Regional and voxel-wise comparisons of blood flow measurements between dynamic susceptibility contrast magnetic resonance imaging (DSC-MRI) and arterial spin labeling (ASL) in brain tumors. J Neuroimaging. 2014; 24: 23–30.
2. Ferreri AJ, Reni M. Primary central nervous system lymphoma. Crit Rev Oncol Hematol. 2007; 63:257–268.
3. Nakajima S, Okada T, Yamamoto A, et al. Differentiation between primary central nervous system lymphoma and glioblastoma: a comparative study of parameters derived from dynamic susceptibility contrast-enhanced perfusion-weighted MRI. Clin Radiol. 2015; 70:1393–1399.
4. Lu S, Gao Q, Yu J, et al. Utility of dynamic contrast-enhanced magnetic resonance imaging for differentiating glioblastoma, primary central nervous system lymphoma and brain metastatic tumor. Eur J Radiol. 2016; 85:1722–1727.
5. Petersen E, Zimine I, Ho YL, et al. Non-invasive measurement of perfusion: a critical review of arterial spin labelling techniques. Br J Radiol. 2006; 79:688–701.
Figures