1713
Preoperative Proliferation Prediction of Pituitary Macroadenoma Based on Radiomics Analysis on DCE-MRI
Yangyingqiu Liu1, Yanwei Miao1, Ailian Liu1, Qingwei Song1, and Lizhi Xie2
1Department of Radiology, First Affiliated Hospital of Dalian Medical University, Dalian, China, 2GE healthcare, Beijing, China
1Department of Radiology, First Affiliated Hospital of Dalian Medical University, Dalian, China, 2GE healthcare, Beijing, China
Synopsis
Proliferative states of pituitary macroadenomas is assessed by radiomics analysis on Dynamic Contrast Enhanced MRI(DCE-MRI). The results show that DCE-MRI could be used as a new noninvasive method for identification the proliferative states of pituitary macroadenomas.
Purpose
To investigate the use of radiomicsDynamic Contrast Enhanced MRI(DCE-MRI) in differential diagnosis of pituitary macroadenomas with different proliferative ability.Materials and methods
Fifty patients with histo-pathologically confirmed pituitary macroadenomas, including 11 patients with active proliferation (active group, Ki-67 index≥3% ) and 39 with inactive proliferation(inactive group, Ki-67 index<3%) were included in this study. Ethical approval and consent forms were obtained. The preoperative MRI and clinical data were collected. The regions of interest (ROIs) covering the parenchyma of tumor were manually delineated by experienced radiologists, and the radiomics features based on Ktrans, Ve, Kep were generated.Independent t test and Kruskal-Wallis test were used for comparison between groups. ROC curve was constructed to assess the differential ability of independent radiomics features. P<0.05 was considered statistically significant.Results
The placement of ROIs on images of patients with active and inactive proliferation are shown in Figure 1, along with Ki-67 staining results.Based on analysis of radiomic features of DCE-MRI, Max intensity(p=0.022), Short run emphasis(p=0.021) and Long run low grey level emphasis(p=0.022)of Ktrans in active group were significant increased, whileGLRLM Inverse difference moment(p=0.047), Long run emphasis(p=0.021), Low grey level run emphasis(p=0.036), Short run low grey level emphasis(p=0.036) of Ktrans and Angular Second Moment(p=0.025)of Kep were significantly decreased in active group compared to inactive group(Table 1). According to ROC analysis, the Short run emphasis and Long run emphasis of Ktrans was considered as the best features for diagnosis(AUC=0.710,sensitivity=58.3% and 78.6%,specificity=78.6% and 58.3%,respectively).Discussion and Conclusion
Tumor proliferation (mitotic count and Ki-67 index) has been identified as a key biomarker for WHO classification of pituitary gland tumors[1]. It is therefore important to identify clinically active proliferation adenomas and perform treatment planning. Angiogenesis is anessential pathological factor in tumor growth and proliferation, DCE has been reported to be able to quantitatively assess the level of angiogenesis [2].In this study, it was found that Ktrans maps of inactive proliferation pituitary adenomas feature more delicate texture, uniformity gray level;on the other hand, the Ktrans images of active proliferation pituitary adenomas have more rough texture, non-uniformity gray level, neovascular has the characteristics of low maturity, vessel wall is thin and incomplete,less vascular basement membrane and high vascular permeability. Overall, higher level of non-uniformity was observed in vascular permeability in active proliferation groups.Acknowledgements
No acknowledgement found.References
[1] Osamura RY, Lopes MBS, Grossman A, Kontogeorgos G, Trouillas J. WHO classification of tumours of endocrine organs,4th edn. 2017, IARC Press, Lyon.
[2] Jia ZZ, Gu HM, Zhou XJ, et al. The assessment of immature microvascular density in brain gliomas with dynamic contrast enhanced magnetic resonance imaging. Eur J Radiol, 2015, 84(9): 1805-1809.
Figures
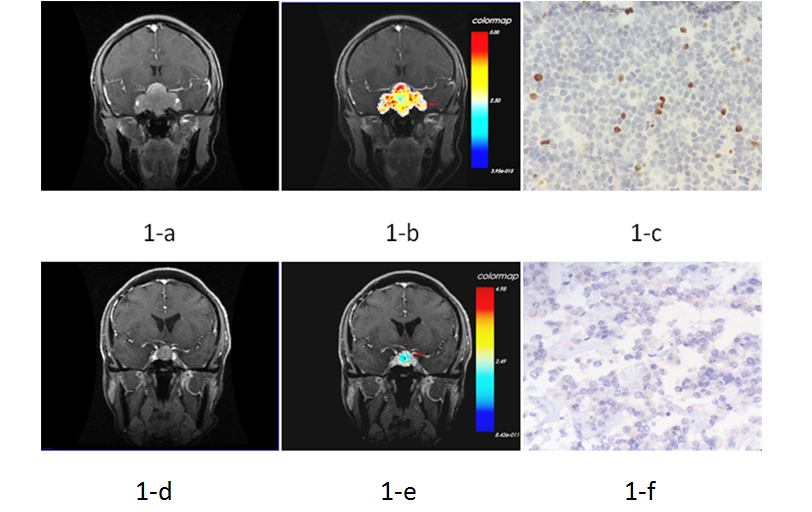
Fig.1(a-c) Images of a
56-year-old woman with active
proliferation pituitary adenoma and Fig.1(d-f)
images of a 34-year-old woman with inactive
proliferation pituitary adenoma. Fig.1-a,d
Showing the T1 enhancement image. Fig.1-b,e showing the fitting image of Ktrans maps, Fig.1-b was rough
and nonuniform, and Fig.1-e was delicate and uniform.
Fig.1-c,f Showing 5% of the
cells were stained on Ki-67 staining of in active
proliferation pituitary adenoma, however
ki-67 staining was negative in inactive
proliferation pituitary adenoma.
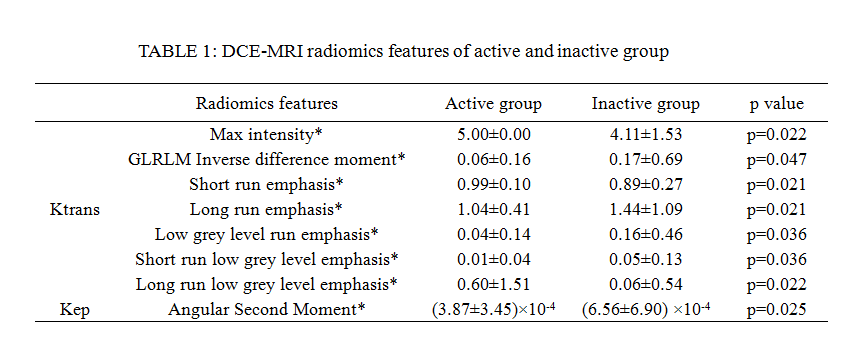
*Data are
expressed as mean median±inter-quartile range
and was analyzed by Kruskal-Wallis
test