1708
Comparative evaluation of Oligodendroglioma and Astrocytoma subtypes with similar grade using Conventional MRI and T1 perfusion MRI imaging
Mamta Gupta1, Abhinav Gupta1, Anup Singh2, Jitender Saini3, Rana Patir4, Sunita Ahlawat5, Vani Santosh3, Neha Vats2, Manish Awasthi2, Suhail Parvaze6, and Rakesh Kumar Gupta1
1Department of Radiology, Fortis Memorial Research Institute, Gurgaon, India, 2Centre for Biomedical Engineering, Indian Institute of Technology, New Delhi, India, 3National Institute of Mental, Health and Neurosciences, Bangalore, India, 4Department of Neurosurgery, Fortis Memorial Research Institute, Gurgaon, India, 5SRL Diagnostics, Fortis Remorial Research Institute, Gurgaon, India, 6Philips Innovation Campus, Bangalore, India
1Department of Radiology, Fortis Memorial Research Institute, Gurgaon, India, 2Centre for Biomedical Engineering, Indian Institute of Technology, New Delhi, India, 3National Institute of Mental, Health and Neurosciences, Bangalore, India, 4Department of Neurosurgery, Fortis Memorial Research Institute, Gurgaon, India, 5SRL Diagnostics, Fortis Remorial Research Institute, Gurgaon, India, 6Philips Innovation Campus, Bangalore, India
Synopsis
The differentiation of oligodendroglioma and astrocytoma has become increasingly important due to the distinct sensitivity of oligodendroglioma (OD) to chemotherapy and prolonged survival compared to astrocytoma (AT) of similar grades. The purpose of the present study was to determine whether unique characteristics of OD and AT are visible on MR imaging and to assess the added value of perfusion imaging in differentiating OD from AT tumors across similar grades in large study population. Our results demonstrated no characteristic/specific conventional MRI features and perfusion parameters those could clearly differentiate similar grades of OD’s and AT tumors.
Introduction
Grade II and III glioma comprises of most common histologic subtypes such as astrocytoma (AT) and oligodendroglioma (OD). The prognosis of AT and OD are different. Accurate determination of tumor and its subtype in patients is therefore clinically relevant. The histopathology is the current reference standard for glioma grading. In the context of a shift towards histological and molecular markers in classifying subtype of AT and OD, a reappraisal of noninvasive imaging biomarkers is warranted. Previous reported studies1,2 have evaluated conventional MRI features such as calcifications, cortical involvement, hemorrhage, location and T2/FLAIR mismatch in differentiating OD’s from AT’s. Despite the identification of several characteristic features, MR imaging is not sufficiently specific for differentiation between glioma subtypes. Dynamic contrast-enhanced (DCE), and dynamic susceptibility contrast-enhanced (DSC) perfusion MRI have been extensively used to characterize the tumor on the basis of tumor biology and the degree of neoangiogenesis3,4. A Few studies have reported the usefulness of DSC-perfusion MRI in differentiating OD from AT based on relative CBV (rCBV) values5,6. On the other hand, a recent study has reported that DSC perfusion MRI shows no change in relative CBV (rCBV) whereas, DCE-derived kinetic parameters especially Ktrans, Kep and Ve showed higher values in OD than AT of similar grades7. However, these studies are limited to small number of patients and have demonstrated inconsistent results. To the best our knowledge, the comparative evaluation of OD and AT with similar grades in large participants is still limited. The present study is designed to compare perfusion parameter and conventional MRI features in large histological proven participants across similar grades of OD and AT to look for any differentiating biomarkers.Materials and Methods
In the current study, 79 patients were included (51 men, 28 women; mean age= 34.7; age range=03-69 years). Patients were classified into two groups: OD group (n=40; grade II, n=17; grade III, n=23; mean-age=37 years, age range=13-61 years) and AT group (n=39; grade II, n=08; grade III, n=31; mean-age=32.5 years, age range=03-69 years) with tumor histopathological characterization done using WHO 2016 classification. Conventional MRI and T1-perfusion MRI was performed at 3.0T MRI (Philips Health Systems, the Netherlands) with 15 channel head coil. Structural MRI of the brain included T2-W, T1-W, 3D-fluid attenuated inversion recovery (FLAIR), pre-contrast 2D T1-W and susceptibility-weighted imaging (SWI) sequences. 12 slices for T1-W and dual PD-T2-W images were obtained which covered the entire tumor. DCE perfusion imaging was performed using a T1-fast field echo (T1-FFE) sequence (TR/TE= 4.45/2.01ms; FA=10 degree; slice thickness=6 mm; FOV= 240 × 240 mm2; acquisition matrix size = 128x128). A series of 384 images, 32-time points for each of the 12 slices, with a temporal resolution of 3.9 sec with total dynamic acquisition time of 2 min and 7 seconds was acquired followed by acquisition of a Post-contrast 3D T1-W turbo spin echo (TSE) sequence. Two experienced radiologists evaluated the conventional MRI features in all the patients. The T1-perfusion MRI data analysis was done using in-house built Matlab programs (MathWorks, Natick, MA). Briefly, data analysis comprises of the following steps: 1) Quantification of T1 perfusion parameters (CBF_NormWM, CBV_NormWM_corr, Ktrans, Ve, Vp). 2) Extraction of tumor subparts (contrast enhancing, necrosis, SVM classifier based non-enhancing and vasogenic edema). 3) Statistical analysis of features from selected ROIs8.Results
The comparison of the conventional MRI features between the OD and AT of similar grades is summarized in (Table 1). The OD’s showed higher prevalence of intratumoral calcifications, higher cortex involvement and haemorrhage than the AT’s. T2/FLAIR mismatch was slightly higher in AT’s as compared to OD’s. Figure 1 depicts an atypical example from one of the AT’s cases. Statistical analysis was performed on the perfusion parameters using SPSS 16.0 software. Student T test analysis showed no significant differences across the similar grades of OD and AT, on all the perfusion and kinetic parameters. However, there was a tendency towards higher values in AT than OD in almost all the parameters except Ktrans (Table 2). The OD group (grade II+III) and AT group (grade II+III) demonstrated no significant differences between any of the perfusion parameters (Table 2).Discussion and Conclusion
In our study the characteristic conventional imaging findings, such as the higher cortex involvement, presence of calcification, hemorrhage and T2/FLAIR mismatch could not clearly differentiate similar grades of OD and AT. T1-perfusion based DCE-MRI imaging also showed no significant difference in all the perfusion parameters across the similar grades of OD and AT. In this study the mean rCBVmax values of AT’s were higher as compared to OD’s across similar grades. This finding is in disagreement with a report by Saito et al.9, which showed that the mean rCBVmax of AT was significantly lower than that of OD. We assumed that this discrepancy could be because of the T2* based DSC perfusion MRI technique used in this study which is known to overestimate the rCBV values in the presence of increased calcification and hemorrhage that is more commonly seen in OD10. Our results suggest that even with advanced MR imaging techniques the image biomarkers for differentiation and grading of OD and AT subtypes in large data remain elusive.Acknowledgements
No acknowledgement found.References
1. Yoon HJ, Ahn KJ, Lee S, et al. Differential diagnosis of oligodendroglial and astrocytic tumors using imaging results: the added value of perfusion MR imaging. Neuroradiology. 2017 Jul;59:665-675. 2. Ellenbogen JR, Walker C1, Jenkinson MD1. Genetics and imaging of oligodendroglial tumors. CNS Oncol. 2015;4:307-15. 3. Jung SC, Yeom JA, Kim JH, et al. Glioma: Application of histogram analysis of pharmacokinetic parameters from T1-weighted dynamic contrast-enhanced MR imaging to tumor grading. AJNR Am J Neuroradiol. 2014;35:1103-10. 4. Arevalo-Perez J, Peck KK, Young RJ, et al. Dynamic Contrast-Enhanced Perfusion MRI and Diffusion-Weighted Imaging in Grading of Gliomas. J Neuroimaging. 2015;25:792-8. 5. Cha S, Tihan T, Crawford F, et al. Differentiation of low grade oligodendrogliomas from low-grade astrocytomas by using quantitative blood-volume measurements derived from dynamic susceptibility contrast-enhanced MR imaging. Am J Neuroradiol 2005;26:266-273. 6. Emblem KE, Scheie D, Due-Tonnessen P, et al. Histogram analysis of MR imaging-derived cerebral blood volume maps: combined glioma grading and identification of low-grade oligodendroglial subtypes. Am J Neuroradiol 2008;29:1664-1670. 7. Lee JY, Ahn KJ, Lee YS, et al. Differentiation of grade II and III oligodendrogliomas from grade II and III astrocytomas: a histogram analysis of perfusion parameters derived from dynamic contrast-enhanced (DCE) and dynamic susceptibility contrast (DSC) MRI. Acta Radiol. 2018;59:723-731. 8. Sengupta A, Agarwal S, Gupta PK, et al. On differentiation between vasogenic edema and non-enhancing tumor in high-grade glioma patients using a support vector machine classifier based upon pre and post-surgery MRI images. Eur J Radiol. 2018;106:199-208. 9. Saito T, Yamasaki F, Kajiwara Y, et al. Role of perfusion weighted imaging at 3T in the histopathological differentiation between astrocytic and oligodendroglial tumors. Eur J Radiol 2012; 81:1863-1869. 10. Saini J, Gupta RK, Kumar M, et al. Comparative evaluation of cerebral gliomas using rCBV measurements during sequential acquisition of T1-perfusion and T2*-perfusion MRI. Plos One 2019; 14:e0215400.Figures
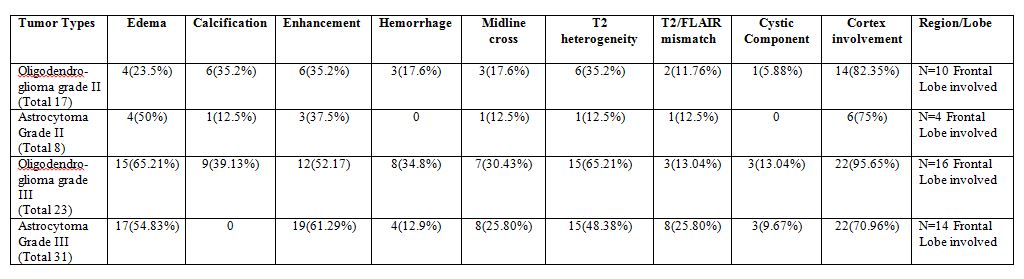
Table 1: Summary of conventional MR imaging
parameters for Oligodendroglioma and Astrocytoma.
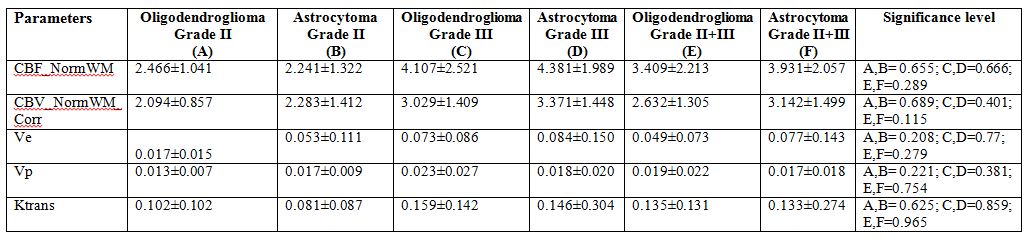
Table 2: Results of Student T
test analysis of all the perfusion parameters between similar grades of OD and
AT and Grade II+III OD and Grade II+III Astrocytoma Tumors.
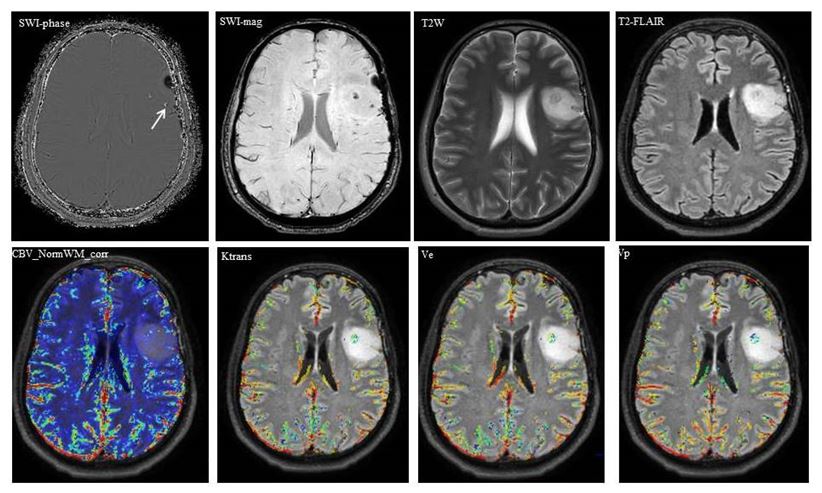
Figure 1: An atypical example of an Astrocytoma grade II case
showing calcification in SWI-phase image and depicting no T2W/FLAIR mismatch.
The CBV_NormWM_corr, Ktrans, Ve and Vp maps also shows low values.