1706
Pixel-wise and regional comparison of a low flip angle, single-dose versus moderate flip angle, double-dose DSC-MRI protocol1Barrow Neurological Institute, Phoenix, AZ, United States, 2Mayo Clinic, Scottsdale, AZ, United States, 3Medical College of Wisconsin53226, Milwaukee, WI, United States, 4Rhode Island Hospital and Alpert Medical School of Brown University, Providence, RI, United States
Synopsis
Current recommendations for brain tumor dynamic susceptibility contrast MRI include the use of a moderate flip angle (MFA) and a full standard preload dose.1 Recently, simulations2 identified an equally accurate protocol that requires no preload and uses a low flip angle (LFA) and optimized echo time. This was validated in vivo3 by comparing LFA- and MFA-based mean tumor cerebral blood volume. Here we aim to systematically characterize agreement by evaluating the pixel-wise agreement in enhancing tumor, edema, white matter, and gray matter regions. We found high agreement in all regions further strengthening the clinical utility of the LFA protocol.
Introduction:
To aid in the recent efforts towards a consensus DSC-MRI protocol based on the optimized LFA approach, we evaluated the pixel-wise rCBV agreement in four regions: enhancing tumor, edema, white matter (WM), and gray matter (GM).Methods:
Imaging Protocol: At the time of analysis, 48 subjects with high-grade gliomas were scanned in this current, on-going IRB-approved study at 3T (MAGNETOM Skyra, Siemens, Germany) using a 20 channel receive phased array. Two DSC-MRI scans were performed in each session using gradient-recalled EPI: LFA sequence using no preload and flip angle = 30° and a MFA sequence using a full standard dose preload and flip angle = 60°. Relevant shared DSC-MRI parameters: TR/TE = 1500/20 ms, acquisition matrix = 96 x 96, acquired spatial resolution = 2.29 x 2.29 x 5 mm3, and skip = 0 mm. A standard dose (0.1 mmol/kg) of gadobutrol was injected 15 seconds after the start of the scan. High resolution T1-weighted post-contrast and T2-weighted FLAIR images were acquired for segmentation.Preprocessing: Semi-automatic segmentation of enhancing and necrotic tumor from T1-weighted post-contrast scans and edema from T2-weighted FLAIR scans were done at their native resolutions using ITK-SNAP.4 Automatic segmentation of WM and GM was done on the high-resolution T1-weighted post-contrast scans using FSL FAST.5 Both anatomical scans and the LFA DSC-MRI were registered to the MFA DSC-MRI using FSL FLIRT.6,7 Transform outputs from these registrations were applied to the segmentation maps.
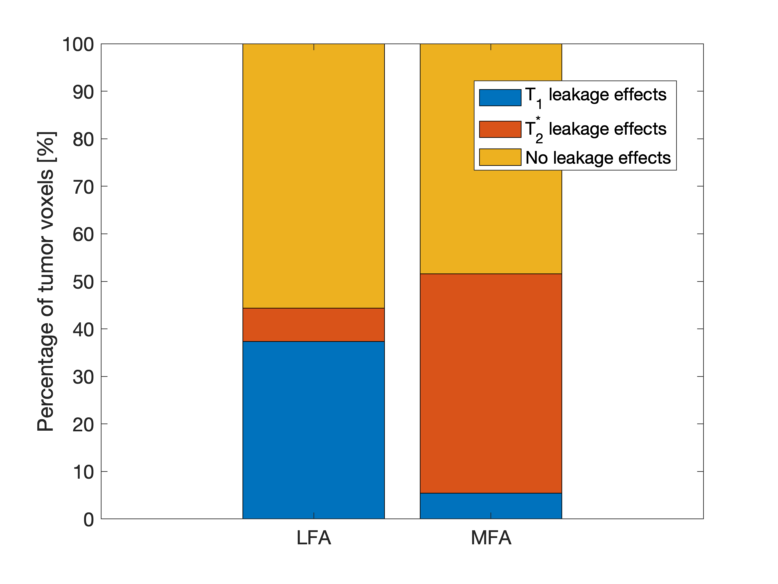
Postprocessing: To assess the types of leakage effects seen in each DSC-MRI protocol, pixels were arbitrarily categorized as T1-related if the post-bolus signal intensity (SI) was 5% or greater than pre-bolus SI and T2*-related if the postcontrast SI was -5% or less than pre-bolus SI. The percentage of voxels exhibiting T1 or T2* leakage effects or neither was then calculated across protocols for all subjects. ΔR2*-time curves were computed from the DSC-MRI signals and those within tumor were leakage corrected by applying the Boxerman-Schmainda-Weisskoff8 (BSW) algorithm. Finally, rCBV was computed by taking the integral under the first pass of the ΔR2*-time curves and normalizing to the mean CBV in WM.
Statistical Analysis: Lin’s concordance correlation coefficients (LCCC) were evaluated in each subject to assess the agreement across all pixels in each ROI. Additionally, for completeness, we computed the LCCC across the mean rCBV in each subject.
Results/Discussion:
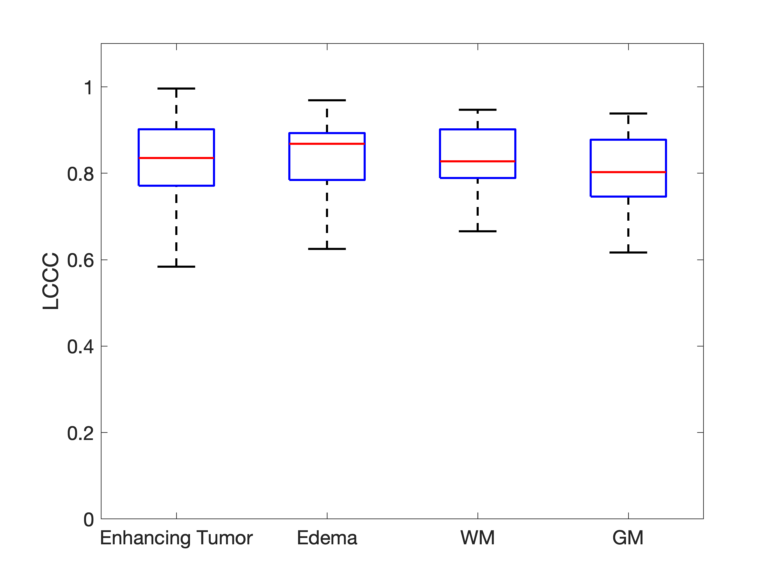
33 subjects were successfully analyzed for this study. Subjects were excluded due to no enhancing tumor observed (n = 13), insufficient baseline signal points (n = 1), and poor anatomical image quality (n = 1). The LCCC across mean leakage-corrected rCBV in subjects between the two protocols was 0.973 and is comparable to a previously reported value of 0.952.3Varying amounts of leakage effects are seen in each protocol (Figure 1). Irrespective of protocol, half the pixels within enhancing tumor did not express either leakage effect. More T1 related leakage effects are observed in the LFA protocol, whereas, more T2* related leakage effects are observed in the MFA protocol, most likely due to the preload. After leakage correction, high pixel-wise agreement is observed within and across all 4 ROIs (Figure 2). Here boxplots show the distribution of observed LCCC across subjects in the four regions. The mean LCCC in each ROI is 0.834 (enhancing tumor), 0.834 (edema), 0.839 (WM), and 0.811 (GM).
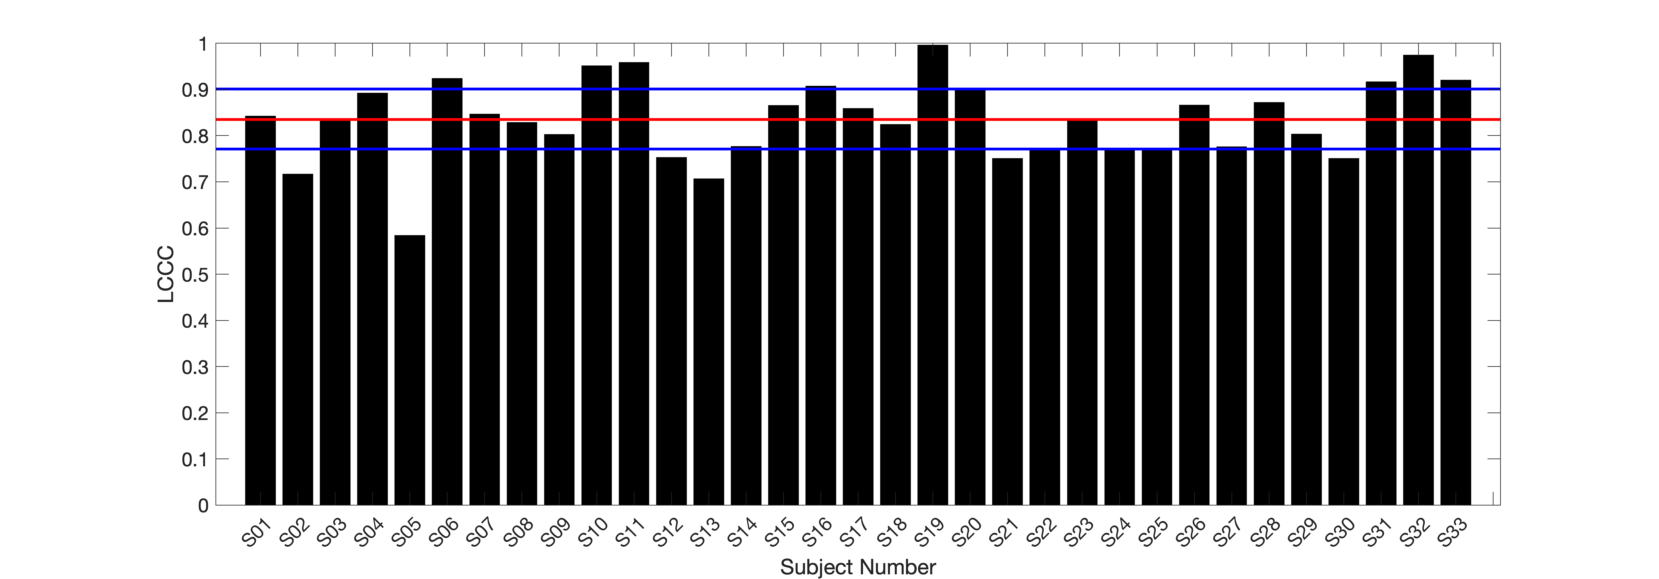
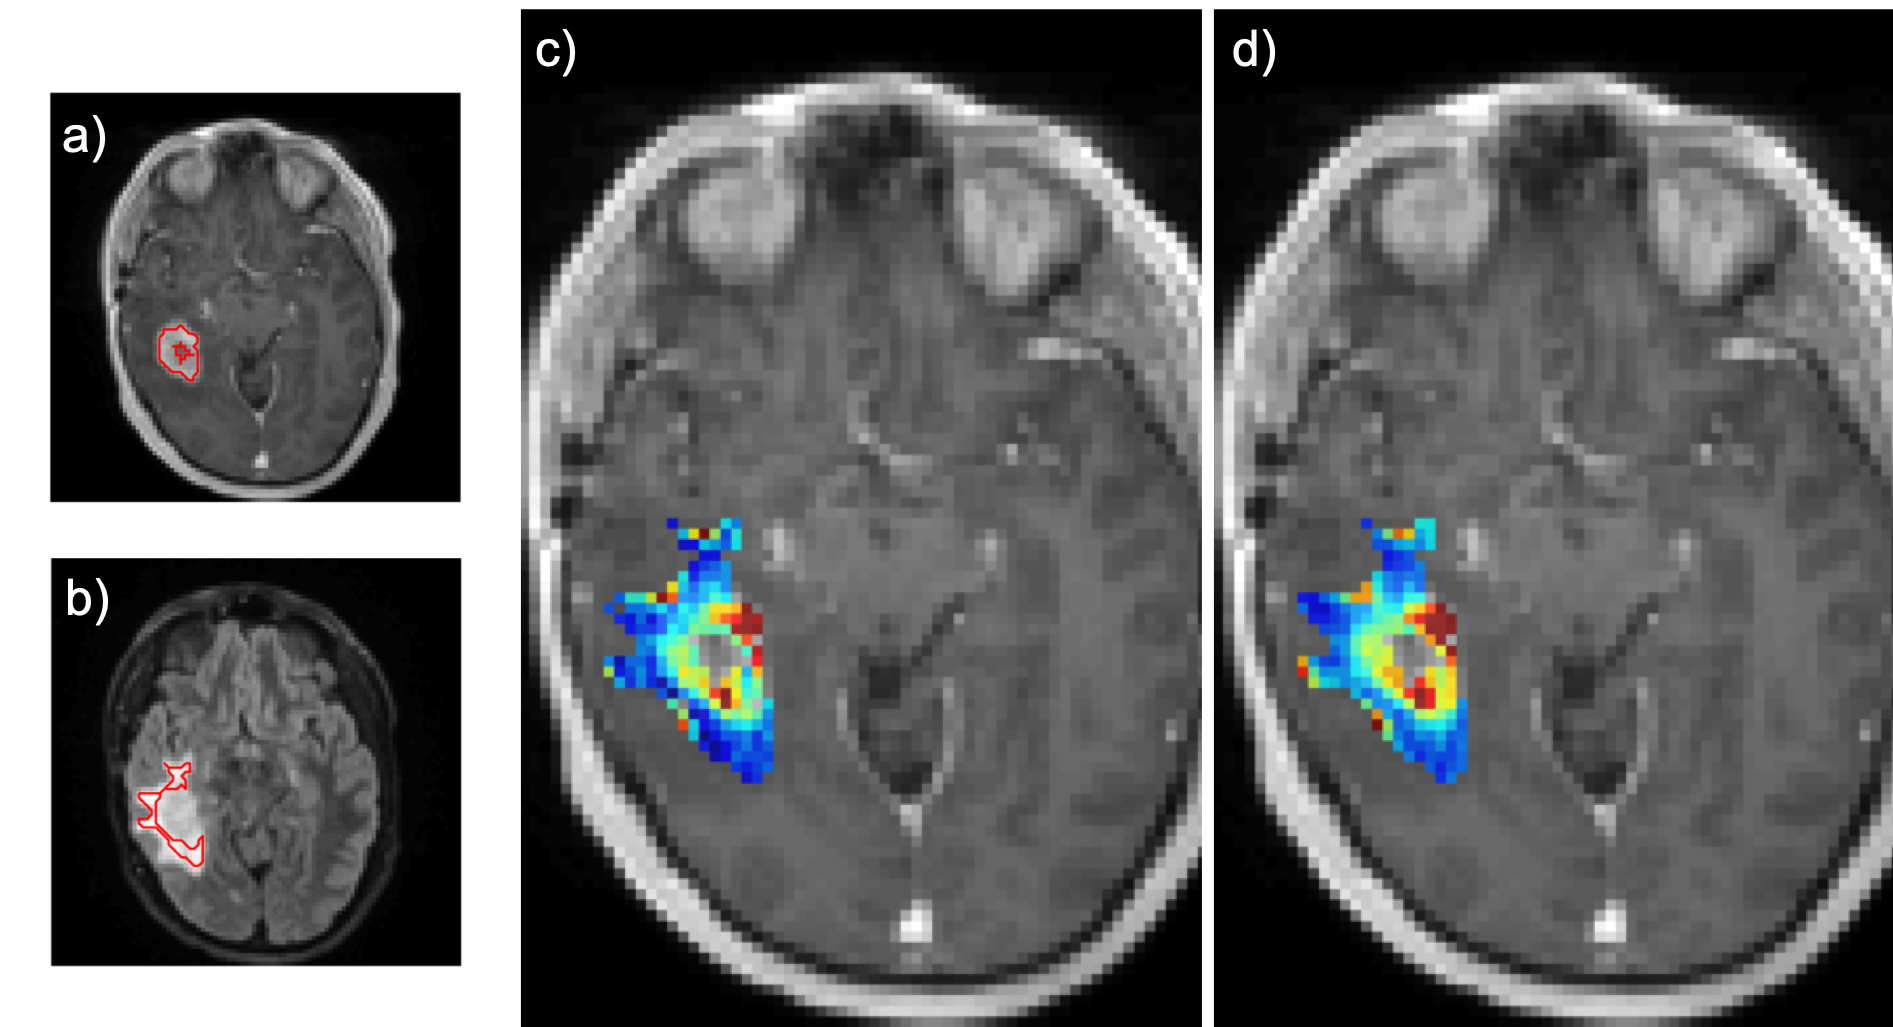
Figure 3 is a bar plot of each subject’s LCCC within the enhancing tumor. Figure 4 is an example of a subject with high agreement across protocols (LCCC = 0.919). Qualitative assessment of the 6 subjects below the 25th percentile indicated poorer agreement possibly due to tumor locations in susceptibility prone areas (near nasal cavity and ear canal), tumors with thin enhancing rims, and/or tumors located in the cerebellum (n = 1). An example of a subject with a lower rCBV agreement (LCCC = 0.717) across protocols is shown in Figure 5.
Conclusion:
This study demonstrated good pixel-wise rCBV agreement in 4 different regions: enhancing tumor, edema, WM, and GM and builds upon the prior in vivo study that highlighted rCBV agreement in tumor ROIs. This systematic comparison is clinically meaningful as interpretation of tumor status involves comparison to values observed in other brain regions and confirmation of peritumoral invasion into regions of edema as indicated by elevated rCBV. Results from this study further strengthen the recommendation that the single-dose LFA protocol, with an optimized TE, may be used in the clinic.Acknowledgements
We received funding from the following:
NIH/NCI R01 CA221938 (all authors), NIH/NCI U01 CA176110 (KMS), NIH/NCI R01 CA213158-01 (LCB, CCQ)
References
[1] Welker K, Boxerman J, Kalnin A, et al. ASFNR recommendations for clinical performance of MR dynamic susceptibility contrast perfusion imaging of the brain. AJNR. Am. J. Neuroradiol. 2015;36:E41-51
[2] Semmineh N, Bell L, Stokes A, Hu L, Boxerman J, Quarles C. Optimization of Acquisition and Analysis Methods for Clinical Dynamic Susceptibility Contrast (DSC) MRI Using a Population-based Digital Reference Object. AJNR Am J Neuroradiol 2018.[3] Schmainda K, Prah M, Hu L, et al. Moving Toward a Consensus DSC-MRI Protocol: Validation of a Low-Flip Angle Single-Dose Option as a Reference Standard for Brain Tumors. AJNR Am J Neuroradiol 2019;40(4):626-633.
[4] Yushkevich P, Piven J, Hazlett H, et al. User-guided 3D active contour segmentation of anatomical structures: Significantly improved efficiency and reliability. Neuroimage 2006 Jul 1;31(3):1116-28.
[5] Zhang, Y, Brady, M, Smith, S. Segmentation of brain MR images through a hidden Markov random field model and the expectation-maximization algorithm. IEEE Trans Med Imag, 20(1):45-57, 2001.
[6] M. Jenkinson and S.M. Smith. A global optimisation method for robust affine registration of brain images. Medical Image Analysis, 5(2):143-156, 2001.
[7] M. Jenkinson, P.R. Bannister, J.M. Brady, and S.M. Smith. Improved optimisation for the robust and accurate linear registration and motion correction of brain images. NeuroImage, 17(2):825-841, 2002.
[8] Boxerman JL, Schmainda KM, Weisskoff RM. Relative cerebral blood volume maps corrected for contrast agent extravasation significantly correlate with glioma tumor grade, whereas uncorrected maps do not. AJNR. Am. J. Neuroradiol. 2006;27:859–67.
Figures