1705
Response prediction of the vestibular schwannoma after gamma-knife radiosurgery using DCE-MRI: preliminary results after 1-year follow-up.1Department of Radiology, Seoul National University Hospital, Seoul, Korea, Republic of, 2Department of Neurosurgery, Seoul National University Hospital, Seoul, Korea, Republic of
Synopsis
There are few known predictive factors for response to gamma-knife radiosurgery (GKRS) in vestibular schwannoma (VS). This study investigated the relationship between DCE-MR derived pharmacokinetic parameters and tumor volume change at one year after GKRS follow-up in VS. This prospective study performed a volumetric measurement of DCE-MR pharmacokinetic parameters before GKRS. The patients underwent followed-up MR at post one year, tumor volume was measured, and pharmacokinetic parameters were compared between tumor growth group and stable group. Only the Ktrans value showed statistical differences. Our results suggest that Ktrans value has the potential to predict tumor response in VS after GKRS.
INTRODUCTION
Vestibular schwannoma (VS) is a benign neurogenic tumor arising from the myelin sheath of the vestibulocochlear nerve. Gamma-knife radiosurgery (GKRS) is a well-established treatment option for VS, with the effective growth control of the tumor.1 Although the effective tumor control rate was known to be more than 90%, in some patients, it fails to control tumor growth. However, the only way to evaluate treatment response is long-term follow-up imaging.2 In particular, transient increase in the size of the tumor after GKRS up to 2 years after treatment is a well-known phenomenon, that makes it harder to assess the treatment response. There are few known predictive factors for response to GKRS. Some MR features might be related to tumor response, such as cystic appearance.3 Dynamic contrast-enhanced (DCE) MR imaging can give information about tissue permeability and angiogenesis by quantitative pharmacokinetic parameters.4 A recent study suggested that growing VS showed higher mean tumor volume transfer constant (Ktrans) by using DCE-MR. We postulated that DCE-MR derived pharmacokinetic parameters also could have information related to response to GKRS. Therefore, the purpose of this study was to investigate the relationship between DCE-MR derived pharmacokinetic parameters and tumor volume change at one year after GKRS follow-up in VS.METHODS
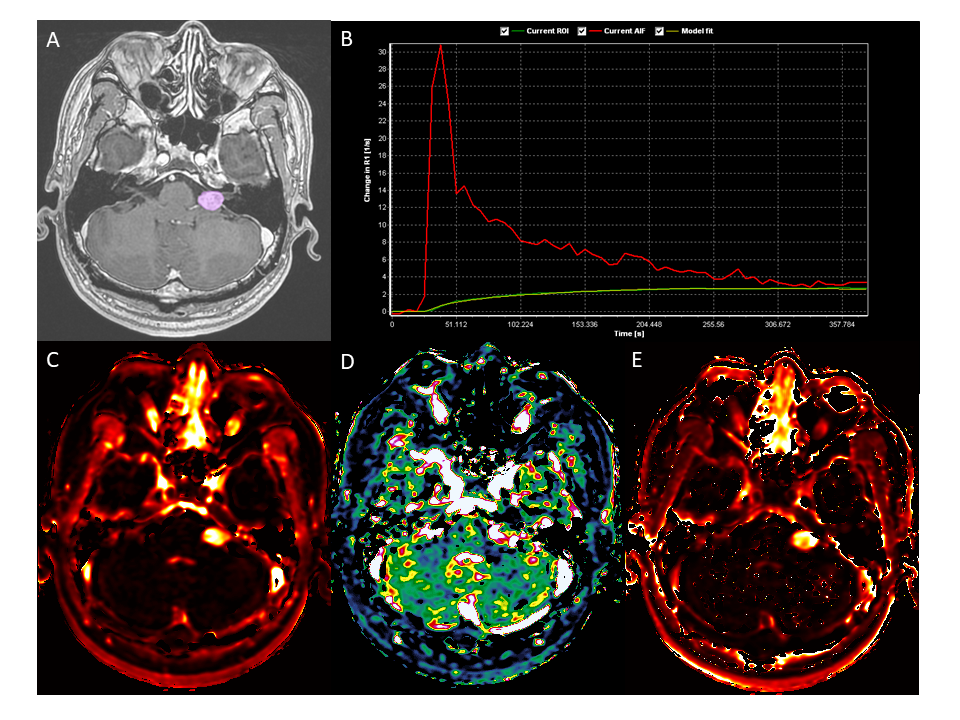
This prospective study enrolled 45 patients from January 2017 to December 2018 in a single institution. The final study population included 26 patients who underwent a 1-year follow-up MR study. The patients were diagnosed with most likely vestibular schwannoma by MR imaging. All patients underwent GKRS planning MR with DCE images by using a 1.5 T MR scanner (Signa HDxt, GE Healthcare, USA). The DCE raw images were transferred to dedicated postprocessing workstations, and investigators generated pharmacokinetic parametric maps by extended Tofts model (Ktrans, vp, ve).4 Tumor volume of interests (VOIs) were drawn in enhancing tumor on the 3D thin-section post-contrast T1-weighted images (CE-T1WI) for GKRS surgical planning. After the co-registration of images, the volumetric measurement of each pharmacokinetic parameters was done. The mean pharmacokinetic parameter value of every voxel in the VOI was used for further analysis. The patient was followed-up at six months after GKRS, and one year later as a second follow-up. The investigators measured tumor volume at the longest diameter (A) and its perpendicular diameter (B) in axial planes and third diameter in the coronal plane (C) on CE-T1WI. Tumor volume was calculated as 0.523×A×B×C. The tumor volume ratio was calculated as 1 year follow-up volume divided by baseline tumor volume, and tumor growing was defined if tumor volume was increased more than 20%, 15% or 10%, regarding to baseline tumor volume (<2 cm3, 2-8 cm3, or >8 cm3, respectively).5 The statistical test was performed to compare pharmacokinetic parameters between tumor growing group and stable group by using the Mann-Whitney U test. Linear and logistic regression analyses were performed with significant pharmacokinetic parameters as well as baseline tumor volume.RESULTS
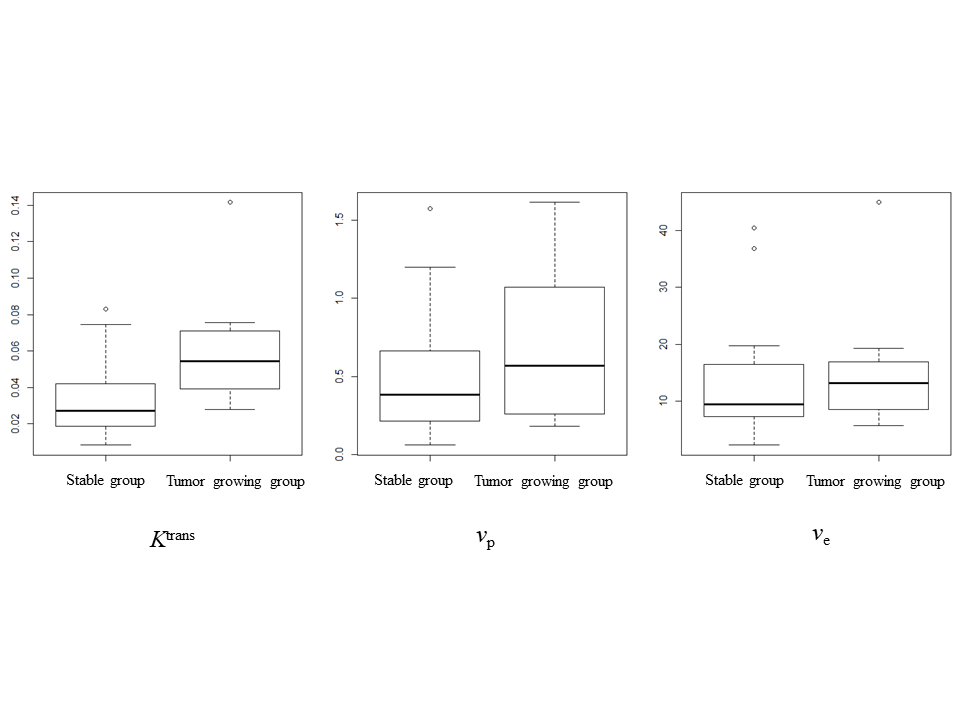
The baseline mean tumor volume was 2.03 cm3 (range, 0.0086-8.53 cm3.) The median interval between GKRS and second follow-up imaging was 13.3 months (range, 11.4-28.2 months). There were 7 patients (26.9%) in a tumor growing group and 19 patients (73.1%) in a stable group after a 1-year follow-up. There was no significant difference in age, sex, and baseline tumor size (P > .05). Only the Ktrans value showed statistical differences between tumor growing group and stable group (0.0634±0.0387 vs. 0.0341±0.0224, P = .035). The stepwise logistic regression analysis with Ktrans, baseline tumor volume, age, and sex revealed that the Ktrans value was marginally insignificant (P = .070). The stepwise linear regression to predict tumor volume ratio with independent variable of Ktrans, baseline tumor volume, age, and sex, demonstrated that the Ktrans value was the only significant variable (P = .007).DISCUSSION
Our results support that the Ktrans value derived from DCE-MR could be predictive for tumor size increase on a 1-year follow-up. The higher Ktrans value might reflect the physiological increased vascular permeability or surface area. Although the VS is a benign tumor, the more permeable tumor might be related to more aggressive biology, hence showed increased after GKRS. However, considering the published tumor control rate (more than 90%) of GKRS, a substantial number of our subjects showed growth in a 1-year follow-up might be a transient phenomenon. In contrast, higher Ktrans VSs might be related to an abundant oxygen supply and might show prolonged change to oxidation damages by radiation.6 Therefore, the long-term follow-up result should be needed to draw a solid conclusion of the predictive value of Ktrans for tumor control.CONCLUSION
Our 1-year follow-up results suggest that Ktrans value has the potential to predict tumor response in VS after GKRS. However, long-term follow-up results should be warranted because the transient increase of tumor size may persist.Acknowledgements
No acknowledgement found.References
1. Boari N, Bailo M, Gagliardi F, et al. Gamma Knife radiosurgery for vestibular schwannoma: clinical results at long-term follow-up in a series of 379 patients. J Neurosurg 2014;121 Suppl:123-142
2. Meijer OW, Weijmans EJ, Knol DL, et al. Tumor-volume changes after radiosurgery for vestibular schwannoma: implications for follow-up MR imaging protocol. AJNR Am J Neuroradiol 2008;29:906-910
3. Wu CC, Guo WY, Chung WY, et al. Magnetic resonance imaging characteristics and the prediction of outcome of vestibular schwannomas following Gamma Knife radiosurgery. J Neurosurg 2017;127:1384-1391
4. Tofts PS, Brix G, Buckley DL, et al. Estimating kinetic parameters from dynamic contrast-enhanced T(1)-weighted MRI of a diffusable tracer: standardized quantities and symbols. J Magn Reson Imaging 1999;10:223-232
5. Nakamura H, Jokura H, Takahashi K, et al. Serial follow-up MR imaging after gamma knife radiosurgery for vestibular schwannoma. AJNR Am J Neuroradiol 2000;21:1540-1546
6. Zahra MA, Hollingsworth KG, Sala E, et al. Dynamic contrast-enhanced MRI as a predictor of tumour response to radiotherapy. Lancet Oncol 2007;8:63-74
Figures