1703
Differentiation of glioblastoma and lymphoma: Improvement in Accuracy and Reliability of DCE Parameters by Using AIF Obtained from DSC-MRI
Koung Mi Kang1, Seung Hong Choi1, Inpyeong Hwang1, Roh-Eul Yoo1, Tae Jin Yun1, Ji-hoon Kim1, and Chul-Ho Sohn1
1Seoul National University Hospital, Seoul, Republic of Korea
1Seoul National University Hospital, Seoul, Republic of Korea
Synopsis
We investigated that whether arterial input functions (AIFs) obtained from Dynamic susceptibility-contrast (DSC)-MRI, or AIFDSC values, improved reliability and diagnostic accuracy of DCE parameters, for differentiating glioblastoma (GBM) from primary CNS Lymphoma (PCNSL), compared with AIFs derived from DCE-MRI (AIFDCE). This study demonstrated that AIFDSC –driven DCE parameters had better diagnostic accuracy and reliability for the differential diagnosis than those from AIFDCE. In addition, the AIFDSC-driven mean Ktrans showed better accuracy than the other DCE parameters and rCBV in the discrimination of GBM without marked vascularity from PCNSL.
INTRODUCTION
Accurate differentiation between primary central nervous system lymphoma (PCNSL) and glioblastoma (GBM) is crucial because GBM is treated with wide surgical resection followed by concurrent chemoradiation with temozolomide, whereas PCNSL is treated with chemotherapy or radiation therapy after stereotactic biopsy.1, 2 As PCNSL is characterized by less neovascularization and higher vascular permeability than glioblastoma,3, 4 perfusion MRI techniques can aid the differential diagnosis. Dynamic susceptibility-contrast (DSC) -MR perfusion imaging is the most established perfusion MRI technique which demonstrates low relative cerebral blood volume (rCBV) in PCNSL compared with glioblastoma.5 In contrast, the results from dynamic contrast material–enhanced (DCE) for the differential diagnosis have been controversial. Some studies revealed increased permeability in PCNSL compared with glioblastoma,3 while others did not found significant differences in DCE parameters between them.6 However, as 30%~48% of GBM revealed reduced vascularity,7-9 we anticipated that the measurement of permeability would have additional value for the differential diagnosis. Although DCE-MRI is versatile to show the permeability, there have been concerns about its low reliability. Arterial input function (AIF) has been considered as one of key factors responsible for its low reliability.10 T2* effects of contrast agents used in DSC-MRI are significantly higher than T1 shortening effects used in DCE-MRI, which makes the results of DSC-MRI robust. However, in contrast to T1 effects, T2* effects disappear when the agents extravagate into the interstitial space. Therefore, it is limited to measure the permeability using DSC-MRI. Based on these respective strengths of DSC- and DCE-MRI, we developed a new method to analyze the T1 based DCE-MRI data obtaining AIFs from DSC-MRI.11 Therefore, the purpose of our study was to evaluate whether arterial input functions (AIFs) obtained from DSC-MRI, or AIFDSC values, improved reliability and diagnostic accuracy of DCE perfusion parameters, for differentiating GBM from PCNSL, compared with AIFs derived from DCE MR imaging (AIFDCE). This study also aimed to assess the diagnostic ability of AIFDCE driven DCE parameters to differentiate GBM without marked hypervascularity from PCNSL.METHODS
This retrospective study included 172 consecutive patients (104 men, 68 women; mean age, 57.25 years 6±13.10; range, 22–83 years) with pathologically confirmed GBM (n = 147) and PCNSL (n=25). All patients underwent both DSC and DCE MR imaging before surgery, and AIFDSC and AIFDCE were obtained from each image. DCE parameters including volume transfer constant (Ktrans), volume of vascular plasma space (Vp), and volume of extravascular extracellular space (Ve) were processed by using postprocessing software with two AIFs. rCBV was also calculated from DSC-MRI. Intraclass correlation coefficients (ICCs) were used to assess reliability. The Mann-Whitney U test was used to compare the medians of DCE- and DCE- MRI parameters.The diagnostic accuracies of individual parameters were compared by using receiver operating characteristic curve (ROC) analysis. ROC analyses were repeated in the subgroup analyses for GBM with rCBV value less than or equal to that of PCNSL.RESULTS
All three DCE parameters revealed better ICCs with AIFDSC than with AIFDCE (Ktrans, 0.355 vs 0.911; Vp, 0.503 vs 0.766; Ve, 0.657 vs 0.758, table 1). ICC for rCBV was 0.793 (95% confidence interval [CI], 0.667-0.875). Among DCE parameters from AIFDSC and AIFDCE, the AIFDSC-driven mean Ktrans and Ve, and AIFDCE-driven mean Vp were significantly different between GBM and PCNSL (p = 0.001, p = 0.01 and p = 0.003, figure 1 and table 2). In the ROC analysis for all GBM and PCNSL, although the AIFDSC-driven mean Ktrans revealed the highest diagnostic accuracy among DCE parameters (AUC = 0.711, table 3), rCBV demonstrated better diagnostic ability (area under the curve [AUC] = 0.856). In the first subgroup analysis for GBM which had rCBV less or equal to the maximum rCBV of PCNSL (GBM with rCBV ≤ 8.27 n = 107), the AIFDSC-driven mean Ktrans revealed the highest diagnostic accuracy among DCE parameters (AUC = 0.711, table 3) but worse than rCBV (AUC = 0.802). However, in the second subgroup analysis for GBM with rCBV less or equal to 75 percentile of PCNSL (GBM with rCBV ≤ 4.61, n = 30), the AIFDSC-driven mean Ktrans demonstrated the highest diagnostic accuracy (AUC = 0.807, table 4) among DCE- and DSC-MRI parameters (AUC of rCBV = 0.515, table 4).CONCLUSION and DISCUSSION
AIFDSC –driven DCE MR parameters showed better diagnostic accuracy and reliability for differentiating between GBM and PCNSL than those from AIFDCE. In particular, the AIFDSC-driven mean Ktrans was an useful imaging marker in the discrimination of GBM without marked vascularity from PCNSL.Acknowledgements
NoneReferences
- Schlegel U. Primary CNS Lymphoma Ther Adv Neurol Disord 2009; 2 (2): 93− 104. Received on September 2011;122.
- Stupp R, Mason WP, Van Den Bent MJ, et al. Radiotherapy plus concomitant and adjuvant temozolomide for glioblastoma. New England Journal of Medicine 2005;352:987-9963.
- Kickingereder P, Sahm F, Wiestler B, et al. Evaluation of microvascular permeability with dynamic contrast-enhanced MRI for the differentiation of primary CNS lymphoma and glioblastoma: radiologic-pathologic correlation. American journal of neuroradiology 2014;35:1503-15084.
- Koeller KK, Smirniotopoulos JG, Jones RV. Primary central nervous system lymphoma: radiologic-pathologic correlation. Radiographics 1997;17:1497-15265.
- Xu W, Wang Q, Shao A, et al. The performance of MR perfusion-weighted imaging for the differentiation of high-grade glioma from primary central nervous system lymphoma: a systematic review and meta-analysis. PLoS One 2017;12:e01734306.
- Zhao J, Yang Z-y, Luo B-n, et al. Quantitative evaluation of diffusion and dynamic contrast-enhanced MR in tumor parenchyma and peritumoral area for distinction of brain tumors. PLoS One 2015;10:e01385737.
- Kadota T, Nakagawa H, Kuroda C. Malignant glioma: evaluation with 3D time-of-flight MR angiography. Acta Radiologica 1998;39:227-2328.
- Russell SM, Elliott R, Forshaw D, et al. Glioma vascularity correlates with reduced patient survival and increased malignancy. Surgical neurology 2009;72:242-2469.
- Puig J, Blasco G, Daunis-i-Estadella J, et al. High-resolution blood-pool-contrast-enhanced MR angiography in glioblastoma: tumor-associated neovascularization as a biomarker for patient survival. A preliminary study. Neuroradiology 2016;58:17-2610.
- Heye T, Davenport MS, Horvath JJ, et al. Reproducibility of dynamic contrast-enhanced MR imaging. Part I. Perfusion characteristics in the female pelvis by using multiple computer-aided diagnosis perfusion analysis solutions. Radiology 2013;266:801-81111.
- You S-H, Choi SH, Kim TM, et al. Differentiation of high-grade from low-grade astrocytoma: improvement in diagnostic accuracy and reliability of pharmacokinetic parameters from DCE MR imaging by using arterial input functions obtained from DSC MR imaging. Radiology 2017;286:981-991
Figures

Table 1. ICC
of DCE parameters derived by using AIFDSC
and
AIFDCE
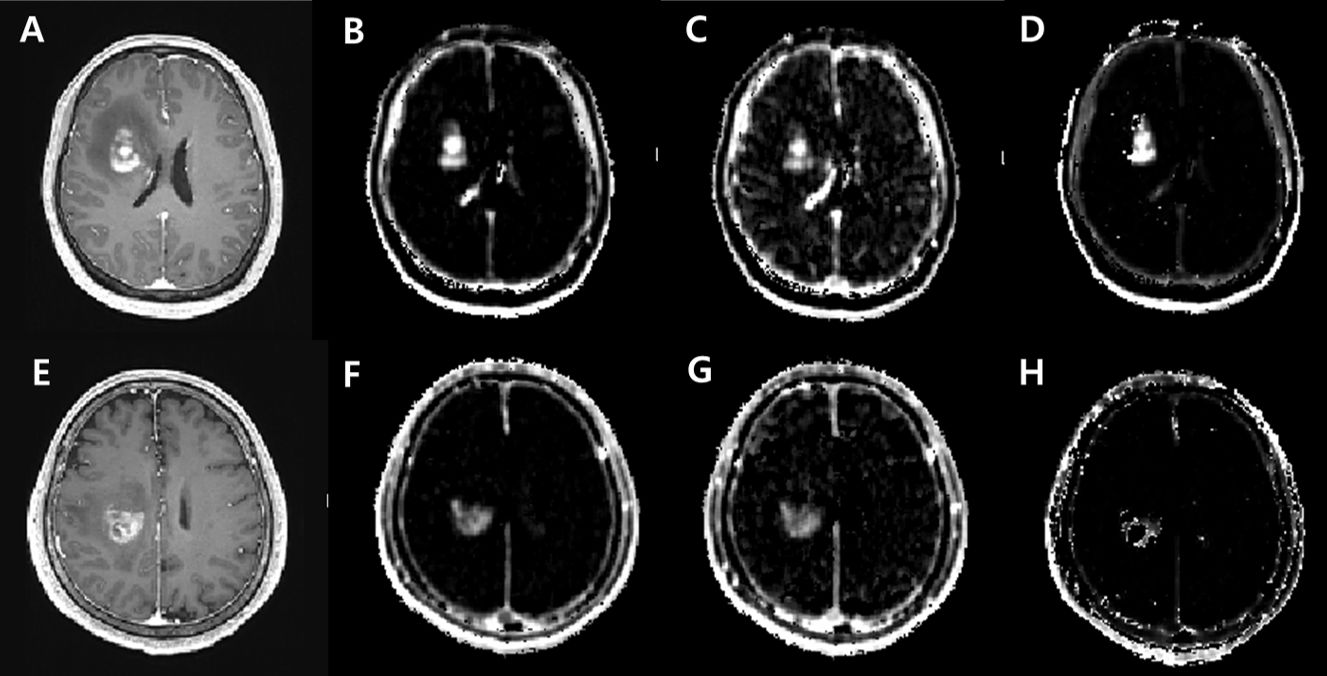
Figure 1. Contrast-enhanced
T1WI (A and D) and AIFdsc- driven Ktrans (B and E), Vp (C
and F) and Ve maps (D and G) for two representative cases.
A-D, A primary CNS lymphoma in a 51-year-old with a
Ktrans of 0.0612, Vp of 0.5107, and Ve of 20.604. E-H, A glioblastoma in a
56-year-old man with a Ktrans
of
0.0166, Vp of 0.1580, and Ve of 12.6684.
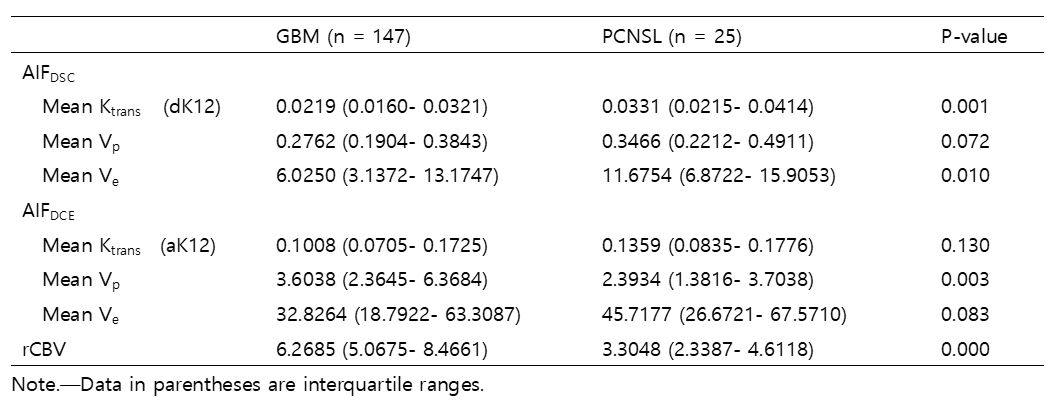
Table 2. DCE and DSC MR imaging parameters in GBM
and PCNSL

Table 3. Diagnostic performance of DCE MR imaging
parameters derived by using AIFDSC and AIFDCE for differentiation
between GBM and PCNSL

Table 4. Subgroup Analysis of the Diagnostic
performance of DCE MR imaging parameters for differentiating GBM with rCBV ≤ 75
percentile of PCNSL from PCNSL