1699
Differential diagnosis of primary CNS lymphoma and glioblastoma using statistics derived from commercial software1Department of Diagnostic Radiology, The Cancer Institute Hospital of the Japanese Foundation for Cancer Research, Tokyo, Japan, 2Division of Biostatistics and Bioinformatics, Graduate School of Public Health, St. Luke’s International University, Tokyo, Japan, 3Department of Radiology, Faculty of Medical Sciences, University of Fukui, Fukui, Japan
Synopsis
Primary central nervous system lymphomas (PCNSLs) are sometimes difficult to distinguish from glioblastomas (GBMs) based on routine magnetic resonance examination. This study assessed the utility of histogram analysis of intratumoral contrast-enhanced region using contrast-enhanced T1WI (CET1WI) with a 3D-spoiled gradient recalled acquisition in the steady state sequence for PCNSLs and GBMs to determine whether histogram statistics differed between the two tumors using the commercial software. There were significant differences in skewness, entropy, and angular second moment between PCNSLs and GBMs. This suggests the possibility of the differential diagnosis of PCNSLs and GBMs using histogram analysis of CET1WI.
INTRODUCTION
Primary central nervous system lymphomas (PCNSLs) are sometimes difficult to distinguish from glioblastomas (GBMs) based on routine magnetic resonance (MR) examination. To date, the apparent diffusion coefficient (ADC) and different patterns of contrast enhancement have been valuable for the differential diagnosis of PCNSLs and GBMs. ADC is based on a quantitative value, whereas contrast-enhanced T1-weighted images (CET1WI) are based on appearance instead of a quantitative value. Therefore, we aimed to determine whether statistics (kurtosis, skewness, entropy, and angular second moment) can be derived from histograms on signal intensity distribution in CET1WIs of brain tumors using a commercial software. In addition, we aimed to evaluate the utility of histogram analysis of intratumoral contrast-enhanced regions using CET1WIs of PCNSLs and GBMs to determine whether the abovementioned statistics differed between these tumors.METHODS
CET1WI of 20 patients with PCNSLs (n = 10) or GBMs (n = 10) were obtained using a 3D-spoiled gradient recalled acquisition in the steady state (SPGR) sequence. All tumors were pathologically confirmed. Further, MR imaging was performed using a 3.0-T whole body scanner (Discovery MR750, GE Healthcare, Waukesha, WI, USA) and a 32-channel head coil. Imaging parameters were as follows: FOV = 240 mm, matrix size = 420 × 192, slice thickness = 1.4 mm, TR/TE/TI = 7.2/2.2/700 ms, and number of slices = 192–270. A standard dose of contrast agent (0.1 mmol/kg) was injected. The region surrounding the outermost layer of the tumors was removed using a workstation (ZIOSTATION; Amin Co., Ltd., Tokyo, Japan) to reveal the contrast-enhanced areas. Moreover, signal intensity distribution was measured within the tumors. Commercial software (Microsoft Excel; Microsoft Corporation, Redmond, WA, USA) was used to calculate statistics, and Wilcoxon rank sum test was used to estimate differences in terms of statistics (skewness, kurtosis, entropy, and angular second moment) between PCNSLs and GBMs. To differentiate between these tumors using statistics, area under the curve (AUC) and cut-off values were determined using receiver operating characteristic (ROC) curve analysis. Sensitivity, specificity, and accuracy were calculated. The AUC value was calculated using logistic regression analysis of the judgments of the two radiologists. DeLong’s test was used to examine significant differences between the AUC values of the statistics individually and those of the radiologists’ judgments. Using all combinations of different statistics, we calculated the AUC values using multivariate logistic regression analysis. We calculated the differences between the AUC values of combined statistics and those of the radiologists’ judgments. Further, we used the Akaike information criteria (AIC) to determine the optimal statistics combination for the differential diagnosis of the two tumors. Because kurtosis, entropy, and angular second moment were positive for the four variables, we performed logarithmic transformation of these statistics and calculated the AUC values for all combinations using multivariate logistic regression analysis. Similarly, we estimated the optimal statistics combination with the lowest AIC values. We performed DeLong’s test using a one-sided test between the AUC values of the optimal statistics combination and that of the judgment of each radiologist. The difference was found to be significant (p < 0.05).RESULTS
Univariate analysisThere were significant differences in terms of skewness, entropy, and angular second moment between PCNSLs and GBMs (Figure 1; p < 0.01) but not in terms of kurtosis (p = 0.579). From the results of the ROC curve analysis, we could differentiate between the two tumors based on skewness, entropy, and angular second moment with cut-off values of −0.034, 4.474, and 0.018, respectively, as well as accuracies of 90%, 85%, and 95%, respectively. The AUC values of skewness, entropy, and angular second moment were 0.900 (95% confidence interval [CI]: 0.754–1.00), 0.890 (95% CI: 0.736–1.00), and 0.930 (95% CI: 0.790–1.00), respectively (Table 1). Additionally, the AUC values of the radiologists’ judgments were 0.750 (95% CI: 0.562–0.938) and 0.800 (95% CI: 0.615–0.985) (Table 2). Notably, there were no significant differences between the AUC values of each statistics and that of the radiologists’ judgments.
Multivariate analysis
Angular second moment was used to determine the optimal statistics combination. However, despite combining the statistics, a significant difference was not observed between the AUC values of the optimal statistics combination and that of the radiologists’ judgments. Furthermore, following logarithmic transformation of the statistics, the skewness–angular second moment combination was found to be the optimal combination. There were significant differences between the AUC values of this combination (0.95 [95% CI: 0.847–1]) (Table 2) and that of each radiologist’s judgment (p = 0.0496 and 0.0388, respectively).
DISCUSSION AND CONCLUSION
In this study, the commercial software was used to derive statistics (skewness, kurtosis, entropy, and angular second moment) from histogram analysis. Skewness, entropy, and angular second moment determined from the histograms of CET1WI signal intensities are useful indices of measurement for the differential diagnosis of PCNSLs and GBMs. The optimal combination for the differential diagnosis was found to be of skewness and angular second moment.Acknowledgements
No acknowledgement found.References
1. Lubner MG, Smith AD, Sandrasegaran K, Sahani DV, Pickhardt PJ. CT texture analysis: definitions, applications, biologic correlates, and challenges. Radiographics 2017; 37:1483–503.Figures
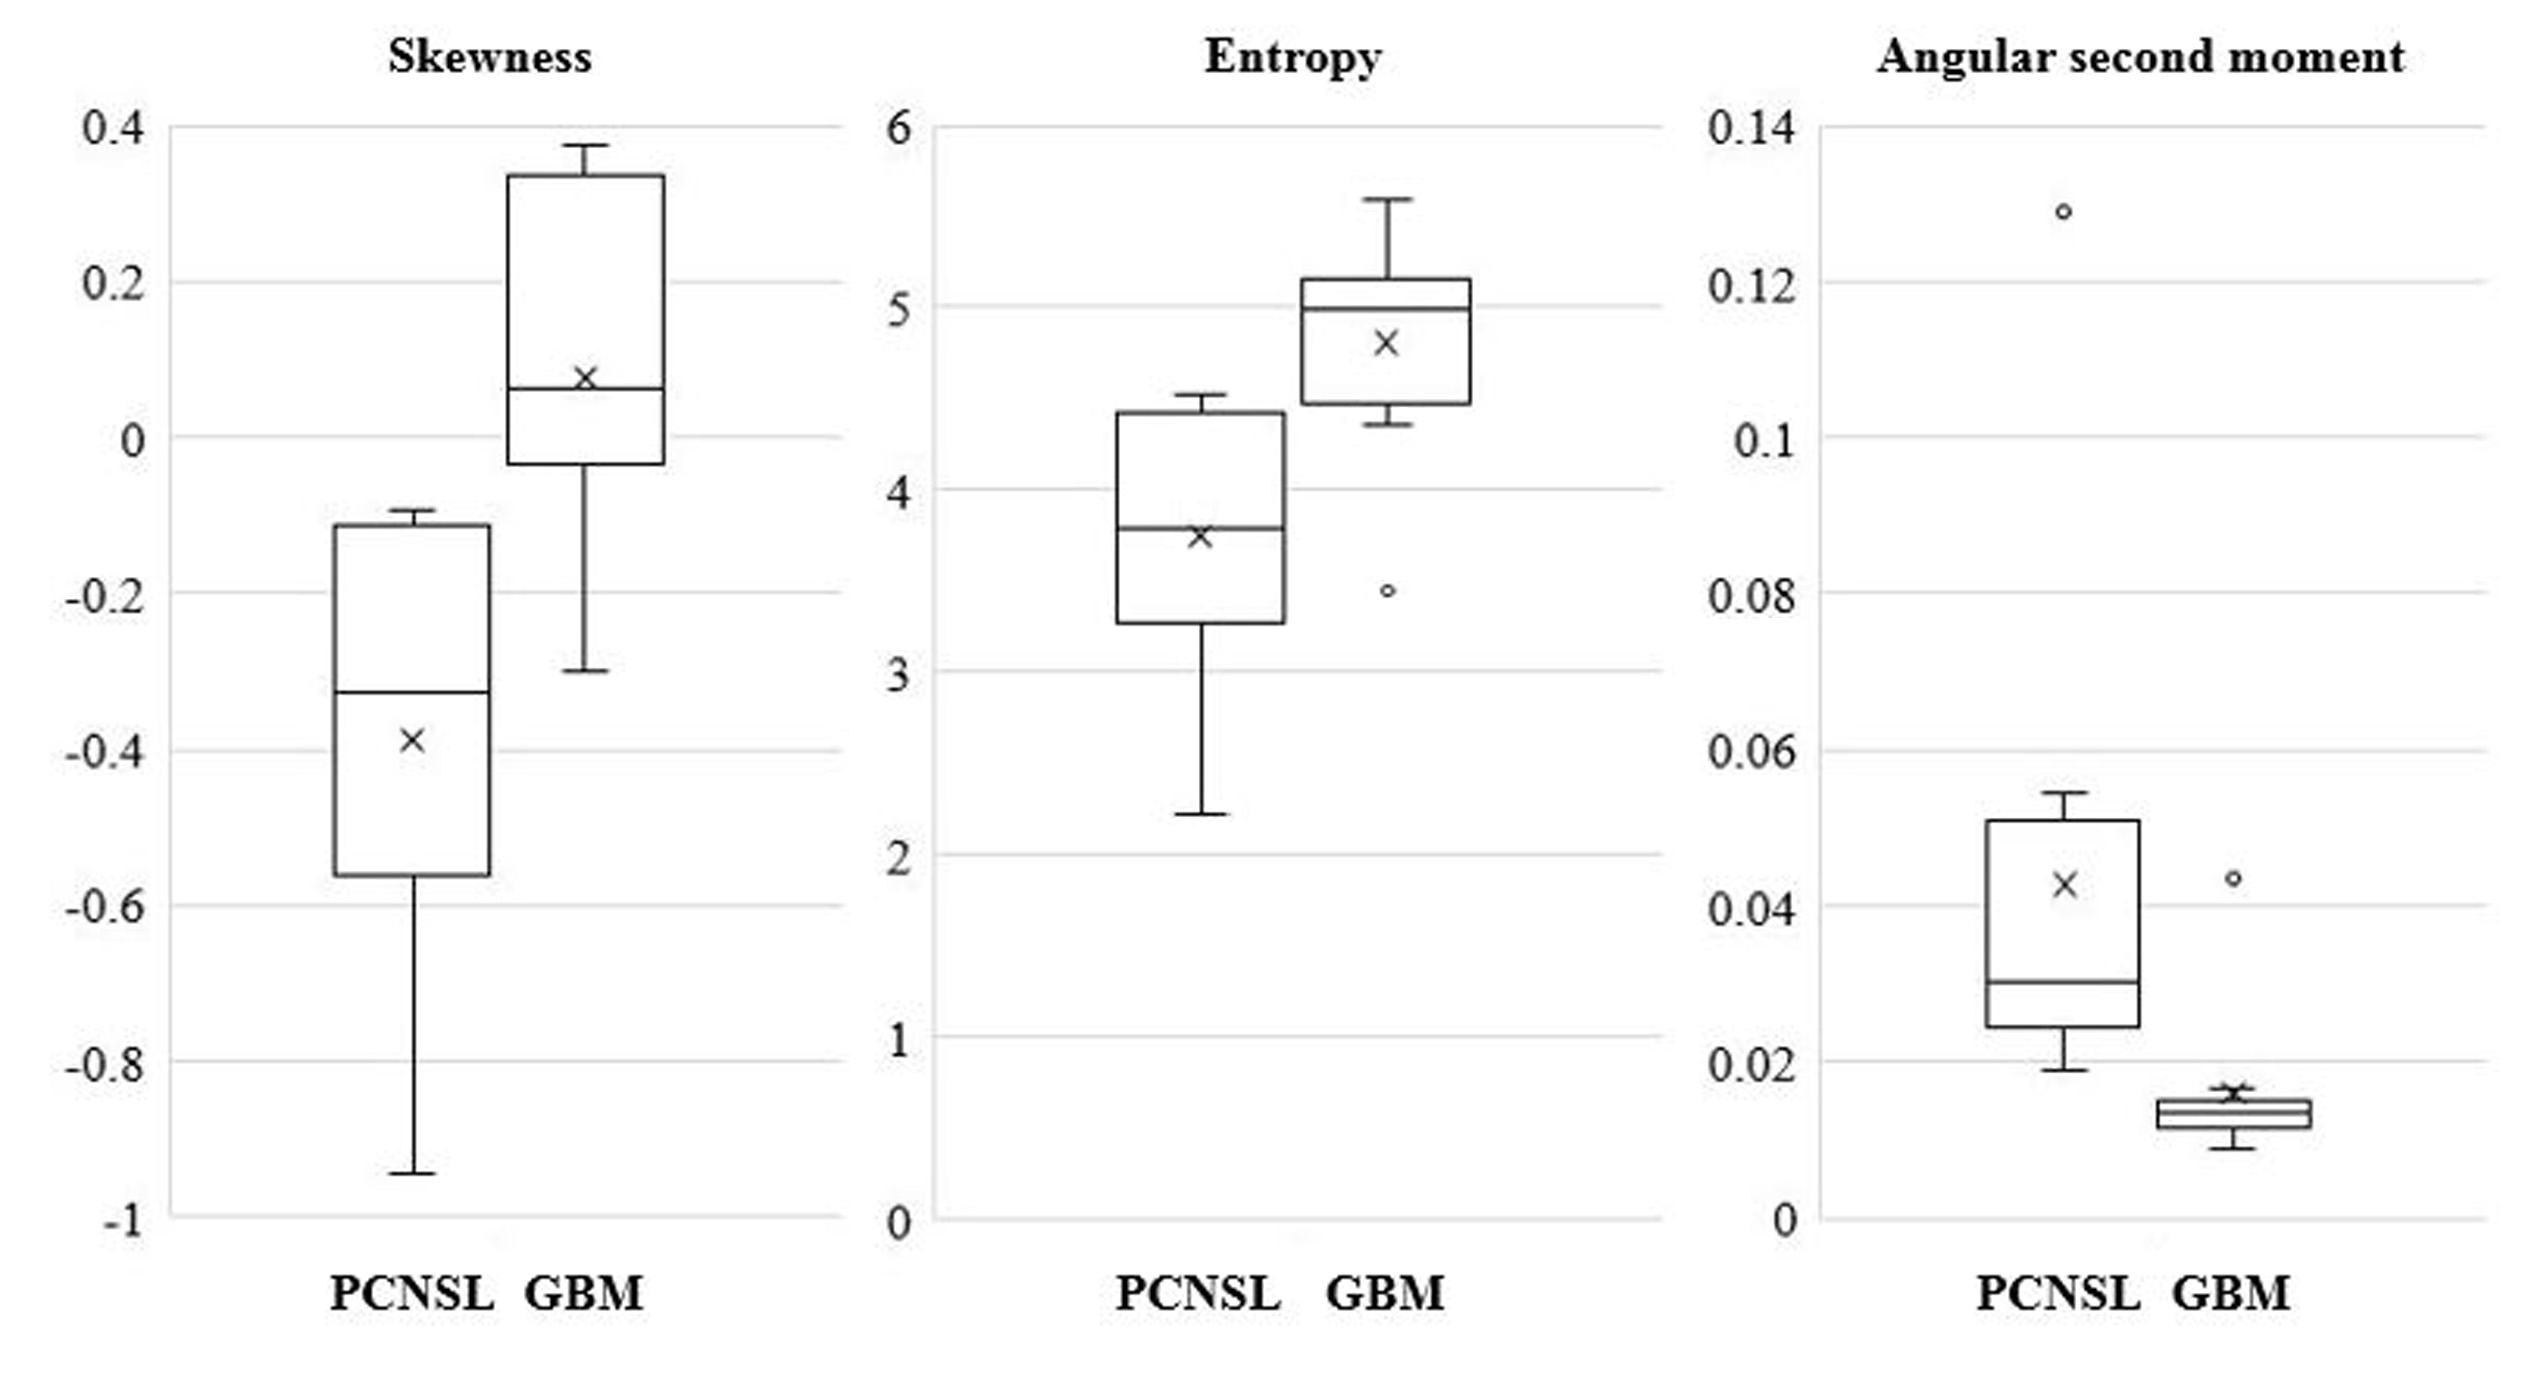
Figure 1. Comparison of statistics between PCNSLs and GBMs
Box-and-whisker plots show each statistics for PCNSLs and GBMs. Lower and upper hinges of the boxes denote the 25th and 75th percentiles, respectively. The median value (50th percentile) of each distribution is indicated by a line. Whiskers on either side extend to the most extreme data point or median ± 1.5 times the interquartile range (IQR). Skewness and entropy were significantly lower for PCNSLs than for GBMs (p < 0.01), whereas the angular second moment was significantly higher for PCNSLs than for GBMs (p < 0.01).
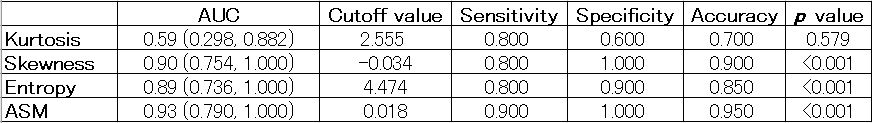
Table 1. Diagnostic performance based on statistics to distinguish between primary central nervous system lymphoma and glioblastoma
Numbers in parentheses represent 95% confidence intervals. AUC, area under the curve; ASM, angular second moment
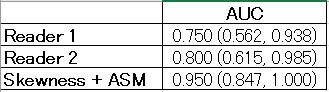
Table 2. Comparison of AUC calculated using logistic regression analysis to differentiate primary central nervous system lymphoma from glioblastoma
Numbers in parentheses represent 95% confidence intervals. AUC, area under the curve; ASM, angular second moment