1698
Effects of Chemo-Radiation on Normal Appearing White Matter in GBM patients1Physical Sciences, Sunnybrook Research Institute, Toronto, ON, Canada, 2Medical Physics, Sunnybrook Health Sciences Centre, Toronto, ON, Canada, 3Radiation Oncology, Sunnybrook Health Sciences Centre, Toronto, ON, Canada, 4Radiation Oncology, University of Toronto, Toronto, ON, Canada, 5Medical Biophysics, University of Toronto, Toronto, ON, Canada
Synopsis
Chemo-radiation treatment for GBM damages normal brain tissues and leads to significant deterioration in patients’ quality of life months or years after treatment. Magnetization transfer (MT) is sensitive to white matter damage and may detect it early. We observed significant reduction in MT exchange rate (RM0B) that quantifies white matters integrity as early as one month after 6-week chemo-radiation. The treatment impact on normal brain tissue was observed even in regions that received low radiation dose. More importantly, not all patients experienced MT reduction showing the heterogeneity of response to treatment and the potential of MT in identifying vulnerable patients.
Introduction
Chemo-radiation treatment for glioblastoma1 affects normal brain tissues and leads to significant decline in patients’ quality of life (QoL) and neuro-cognitive function. Treatment-induced changes in normal brain are not detectable on clinically used anatomical imaging early after the treatment2,3. However their impact on QoL appear several months after end of the treatment3. Magnetization transfer (MT) is sensitive to treatment-induced changes in white matter integrity and microstructure and might detect such damages early. Identification of the patients who are sensitive to treatment and are expected to experience deteriorated QoL may help in minimizing these effects by adjusting the treatment or additional medication.Methods
Subjects: 14 newly diagnosed GBM patients were recruited (REB approved) and MRI-scanned immediately before start of the treatment (Day0). Patients were treated with 30 fractions of 2Gy radiation (delivered via IMRT) + daily Temozolomide (TMZ) over 6 weeks. 12 patients (out of 14) were also MRI-scanned one month after end of the treatment (Day70).MRI: was performed on a 3T Philips Achieva scanner. An axial slice passing through the tumour was imaged with TFE (TR/TE=1971/29ms, TFE-factor=2, Matrix=144×144, FOV=20×20cm, slice=3mm).
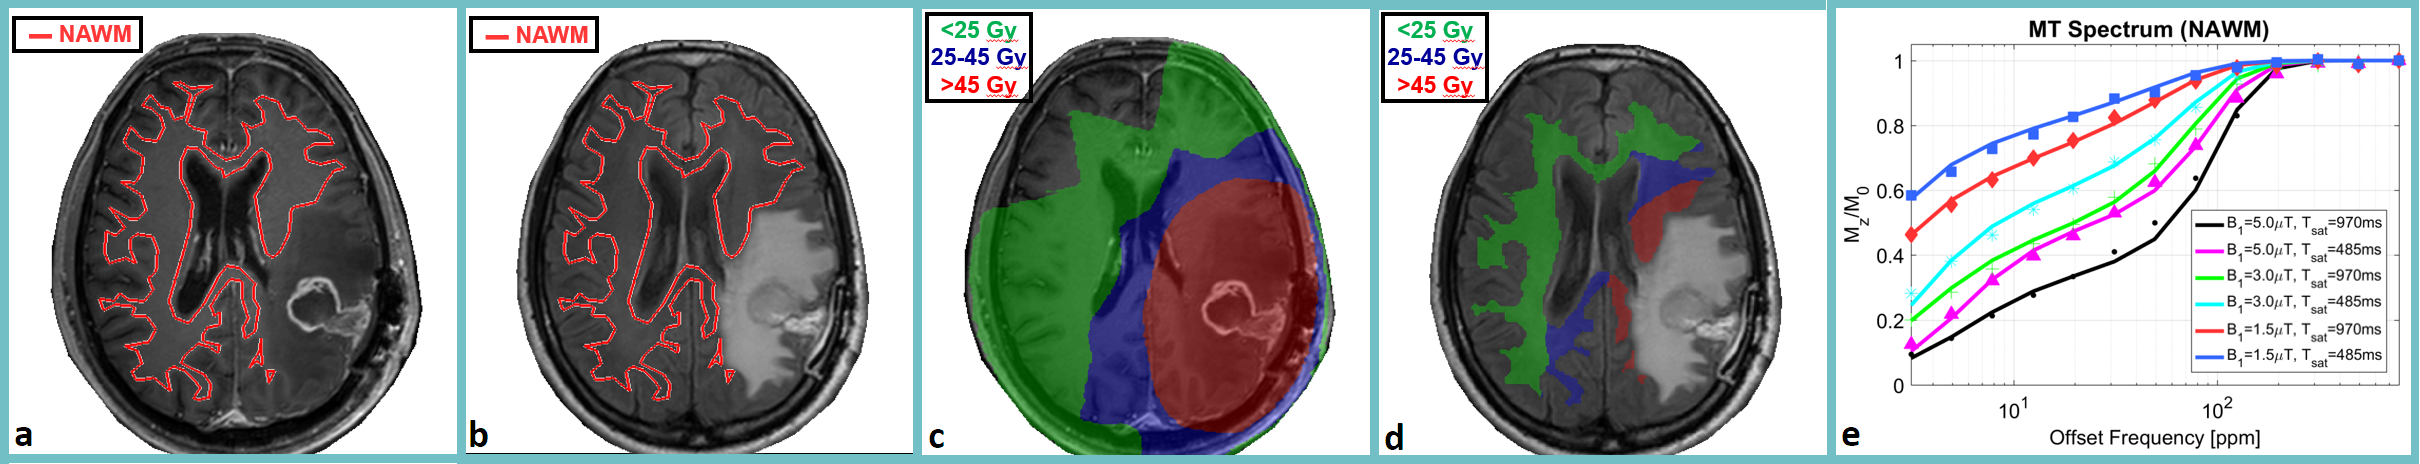
qMT: Imaging covered offsets between 2 and 780ppm with 14 offsets (with equal logarithmic scale spacing). RF saturation consisted of 2 & 4 block pulses of 242.5ms each with 2.5ms gaps interleaved (485 & 970ms total) and B1=1.5,3,5 µT4,5.
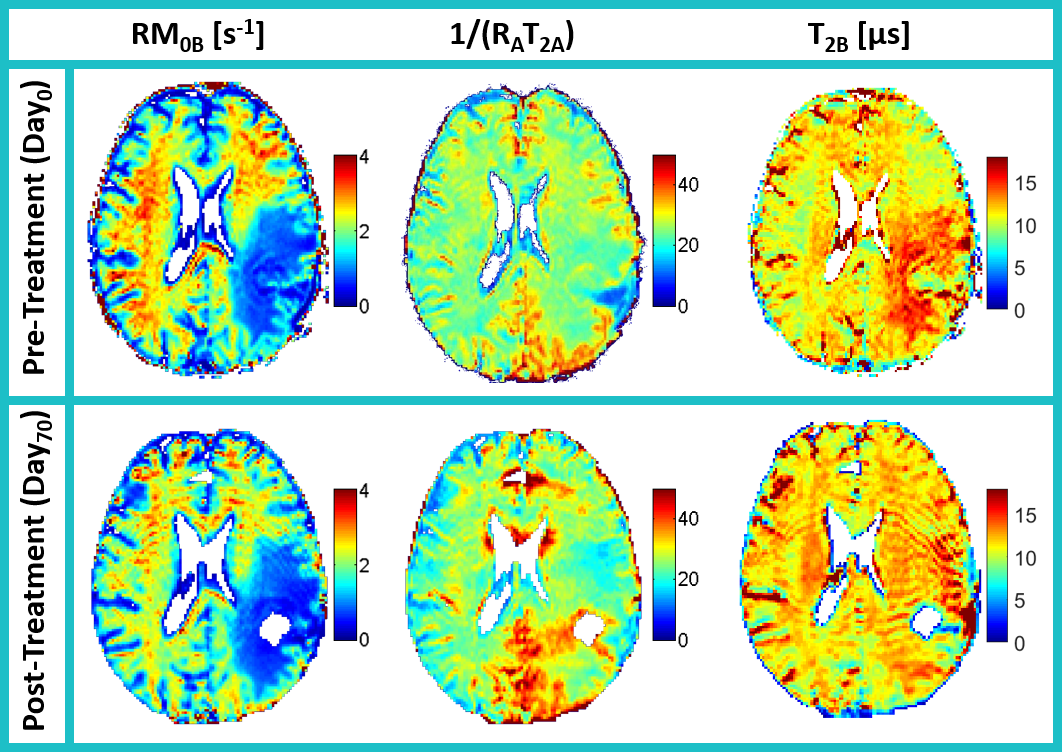
The six MT spectra were fitted to the two-pool MT model proposed by Henkelman6 in transient state, and the four model parameters [RM0B/RA,T2B,R,1/(RAT2A)] were calculated where RM0B is magnetization transfer rate; M0B, the macromolecular pool-size; R, the exchange rate from MT to water pool; RA, the longitudinal relaxation rate of the water pool; and T2A and T2B, the transverse relaxation times of the water and MT pools, respectively.
Analysis: qMT/T1/B1/postGd-T1w/FLAIR images were co-registered to the first acquired MT image. Normal appearing white matter (NAWM) ROI was defined manually on postGd-T1w and FLAIR, avoiding tumour mass, edema and areas of white matter hyperintensity. The total radiation dose (over 6-week treatment) in radiotherapy plan was divided into three dose levels (XRT<25Gy, 25Gy<XRT<45Gy, XRT>45Gy). Metrics were calculated voxelwise and median value over ROI was used.
Results & Discussions
Day0 scan of one patient was discarded due to imaging problems, thus eleven patients had both Day0 and Day70 scans. Figure 1a-b show the NAWM ROI of an illustrative patient overlaid on postGd-T1w and T2w-FLAIR. Radiotherapy plan (XRT) used for treatment is shown in Fig.1c, showing the three dose level regions. Figure 1d shows the overlap of NAWM region and radiotherapy plan which was used in calculating summary statistics.Figure 2 presents MT parametric maps for the patient at Day0 and Day70 showing RM0B is decreasing and Fig.3 shows the histogram distribution of two qMT parameters averaged over all patients at each scan.
Table 1 reports qMT parameters segregated for the three dose levels. For XRT<25Gy region there is statistically significant reduction in RM0B (which represents the magnetization transfer rate) after treatment. RM0B reduction shows loss of white matter integrity that may result in cognitive dysfunction. When moving closer to the tumour at Day0 (25Gy<XRT<45Gy and XRT>45Gy) value of RM0B is already lower than XRT<25Gy (which is the farthest region from the tumour). This might be due to the fact that GBM cells invade their surrounding normal tissues and destroy them (such destruction is not visible on clinical MRI).
Figure 4 shows RM0B for each of 11 patients that had both Day0 and Day70 scans. For XRT<25Gy region approximately half the patients (6/11) experienced significant reduction in RM0B while the other half experience no change. Thus, treatment impacts patients differently where some patients are resistant to treatment and others experience significant damage to NAWM (Similar trends with smaller magnitudes are occurring for 25Gy<XRT<45Gy region).
For XRT>45Gy region that received the highest radiation dose, MT parameter was similar before and after treatment (RM0B,Day0=2.22±0.17 vs. RM0B,Day70=2.21±0.19) indicating NAWM was already damaged by the tumour infiltration and did not change with treatment.
Similarly for 25Gy<XRT<45Gy, RM0B at Day0 had a value between the other two dose levels which indicates there was some NAWM damage. After treatment (Day70) however, RM0B of 25Gy<XRT<45Gy region decreased to values similar to the other dose levels (RM0B,Day70= 2.25±0.10, 2.23±0.17, 2.21±0.19 for the three dose levels).
The parameter 1/(RAT2A) represents direct water effect and the fact that it did not change between Day0 and Day70 shows the above mentioned changes were due to change in MT properties and not just tissue T1 and T2. This also re-confirms the fact that these subtle early changes in NAWM cannot be detected on clinical MRI scans that rely on T1 and T2.
Conclusions
Chemo-radiation damages NAWM and its impact on patients’ quality of life becomes apparent several months to years after treatment. MT is sensitive to microstructural changes in white matter and might detect such changes early. As early as one month post-treatment, we observed MT changes at NAWM that were far from tumour and received very low radiation dose. More importantly, not all patients experienced the same damage to NAWM after treatment. Early diagnosis of the patients that are sensitive to treatment might guide further medication to preserve quality of life.Acknowledgements
This study was funded by Canadian Institute of Health Research (CIHR PJT156252) and Terry Fox Research Institute (TFRI project 1034).References
1. Olson JJ, Ryken T. Guidelines for the treatment of newly diagnosed glioblastoma: introduction. J Neurooncol. 2008;89(3):255-258. doi:10.1007/s11060-008-9595-4
2. Taphoorn MJ, Klein M. Cognitive deficits in adult patients with brain tumours. Lancet Neurol. 2004;3(3):159-168. doi:10.1016/S1474-4422(04)00680-5
3. Henriksson R, Asklund T, Poulsen HS. Impact of therapy on quality of life, neurocognitive function and their correlates in glioblastoma multiforme: A review. J Neurooncol. 2011;104(3):639-646. doi:10.1007/s11060-011-0565-x
4. Mehrabian H, Myrehaug S, Soliman H, Sahgal A, Stanisz GJGJ. Quantitative Magnetization Transfer in Monitoring Glioblastoma (GBM) Response to Therapy. Sci Rep. 2018;8(1):2475. doi:10.1038/s41598-018-20624-6
5. Mehrabian H, Lam WW, Myrehaug S, Sahgal A, Stanisz GJ. Glioblastoma (GBM) effects on quantitative MRI of contralateral normal appearing white matter. J Neurooncol. 2018;139(1):97-106. doi:10.1007/s11060-018-2846-0
6. Henkelman RM, Huang X, Xiang QS, Stanisz GJ, Swanson SD, Bronskill MJ. Quantitative interpretation of magnetization transfer. Magn Reson Med. 1993;29:759-766.
Figures