1697
Characterization of Brain Tumors using Amide Proton and Nuclear Overhauser Effect at 3 Tesla MR Scanner.
Yuki Kanazawa1, Masafumi Harada1, Mitsuharu Miyoshi2, Takashi Abe1, Yuki Matsumoto1, and Yasushi Takagi3
1Tokushima University, Tokushima, Japan, 2Global MR Applications and Workflow, GE Healthcare Japan, Hino, Japan, 3Department of Neurosurgery, Tokushima University, Tokushima, Japan
1Tokushima University, Tokushima, Japan, 2Global MR Applications and Workflow, GE Healthcare Japan, Hino, Japan, 3Department of Neurosurgery, Tokushima University, Tokushima, Japan
Synopsis
To achieve detailed characterization of brain tumors, we demonstrated CEST imaging with multi-pool model [bulk water, magnetization transfer (MT), amide proton transfer (APT), and nuclear Overhauser effect (NOE)] derive from the Bloch equation. This study was performed using five patients with brain tumors. As a result, there was high linearity between MTRasym and T2/T1 in each tumor (R2 = 0.91, P<0.05). Moreover, there were significantly different NOE signals for tumors and normal white matter (P<0.05). Detection using APT and NOE make it possible to provide more detailed information of brain tumors than MTRasym analysis.
Introduction
Chemical exchange transfer (CEST) imaging has been reported as clinically useful for brain tumor analysis. Amide proton transfer (APT) imaging has been applied to histological grading, assessment of treatment effectiveness and/or monitoring of brain tumors at 3 Tesla. On the other hand, the nuclear Overhauser effect (NOE) signal is generally observed as an oppositional offset frequency to the CEST signal, of which has been clearly observed with low B1 power at ultra-high-field MRI.1 Moreover, various CEST pool models have been developed and demonstrated including APT and NOE. On a 3 Tesla scanner, because a high B1 setting is used for acquiring adequate APT contrast, the NOE signal which is on the opposite side of APT would be challenging of distinguish with MTR asymmetry (MTRasym) analysis. Detecting a NOE signal in a brain tumor may be useful for histological classification when compared to APT signals. The purpose in this study was to demonstrate CEST imaging with multi-pool Bloch equation modeling for different types of brain tumors.Materials and Methods
This study was approved by the institutional review board and performed using five patients with brain tumors (two glioblastomas, one lymphoma, and two radiation necrosis). On a 3.0 Tesla MR system (GE Healthcare), CEST imaging was performed with a single-shot fast spin-echo (SSFSE) sequence and phase cycle radio frequency (RF) preparation; the frequency offset range was from -7 to +7 ppm at intervals of 0.5 ppm. The mean B1 values of the MT pulses with 1.5 sec RF duration were set at 0.5, 1.0 µT; then, 0.5 µT B1 was used for B0 correction. The other imaging parameters were echo time, 27.1 ms; repetition time, 9588 ms; bandwidth, 488 Hz/pixel; field of view, 22 cm; matrix size, 128 × 128; slice thickness, 8 mm. Slice positions were set at center of tumor for a maximum of three slices. Acquired imaging data had motion correction applied to each pixel. Post processing of CEST imaging was performed using the multi-pool model Bloch equation; T2/T1 as bulk water, magnetization transfer (MT), amide proton transfer (APT), and nuclear Overhauser effect (NOE). Each parameter estimation of the multi-pool model Bloch equation was as follows;$$\frac{dm}{dt}=A\cdot{m}+R_{1}{m_{0}}=0\left(Eq.1\right) $$
$$m=-A^{-1}R_{1}m_{0}\left(Eq.2\right)$$
where, A is the matrix representation including parameters of MT, APT, and NOE, m0 is thermal equilibrium including bulk water. m is a steady state signal, which includes measured Z-spectrum. R1 is relaxation rate, which was fixed in this fitting. Each parameter was calculated from Z and CEST peak extraction (CPE) spectrum fitting,2 this minimized the error between measured and calculated Z-spectrum. Then APT and NOE concentration map were generated. Regions of interest (ROIs) within the tumors and contralateral white matter (WM) were manually delineated in CEST images to be used as a comparison of each of the tumors.
Results and Discussions
Table 1 shows the histological diagnoses of brain tumors and estimated parameters derived from CEST for each patient. Figure 1 shows the relationship of each estimated parameter of each tumor and bilateral normal WM. Mean values for MTRasym at 3-4 ppm, APT3.5 ppm, NOE3.5 ppm, T2/T1, and MT of brain tumors were 0.008 ± 0.017, 7.91 ± 5.42 (×10-4), 5.24 ± 3.32 (×10-4), 0.08 ± 0.43, and 0.19 ± 0.85, respectively. Mean values for each parameters of normal WM tissue were -0.009 ± 0.018, 7.00 ± 4.44 (×10-4), 0.12 ± 3.27 (×10-4), 0.06 ± 0.11, and 0.53 ± 0.12, respectively. Figure 2 shows the relationship between mean MTRasym at 3-4 ppm and estimated CEST parameters derived from the multi-pool Bloch equation model of each brain tumor. Figures 3 and 4 show each image and Z-spectrum of each patient with brain tumors. In the glioblastomas case (patient No. 2), we observed high MTRasym_3-4 ppm and APT3.5 ppm, and low NOE3.5 ppm signal areas (Fig. 3). In the other glioblastomas case (patient No. 4), we observed negative value of MTRasym_3-4 ppm and a higher NOE3.5 ppm signal than that found in the other tumors (Fig. 2b&4). Because NOE signal was significantly different between tumors and normal white matter, MTRasym was affected by NOE. In the future, we must research what the biomechanism is that causes the NOE signal in a brain tumor or normal brain tissue.Conclusion
Distinguishing APT to NOE signal may lead to more detailed characteristics of metabolism in brain tumors than that of MTRasym analysis.Acknowledgements
No acknowledgement found.References
- Zhou J, Hong X, Zhao X, Gao JH, Yuan J. APT-weighted and NOE-weighted image contrasts in glioma with different RF saturation powers based on magnetization transfer ratio asymmetry analyses. Magn Reson Med. 2013;70(2):320-7.
- Miyoshi M, Matsuda T, and Kabasawa H. CEST Peak Extraction method for multi peak fitting. Proceedings of the 23th Annual Meeting of ISMRM. 2015;3346.
Figures
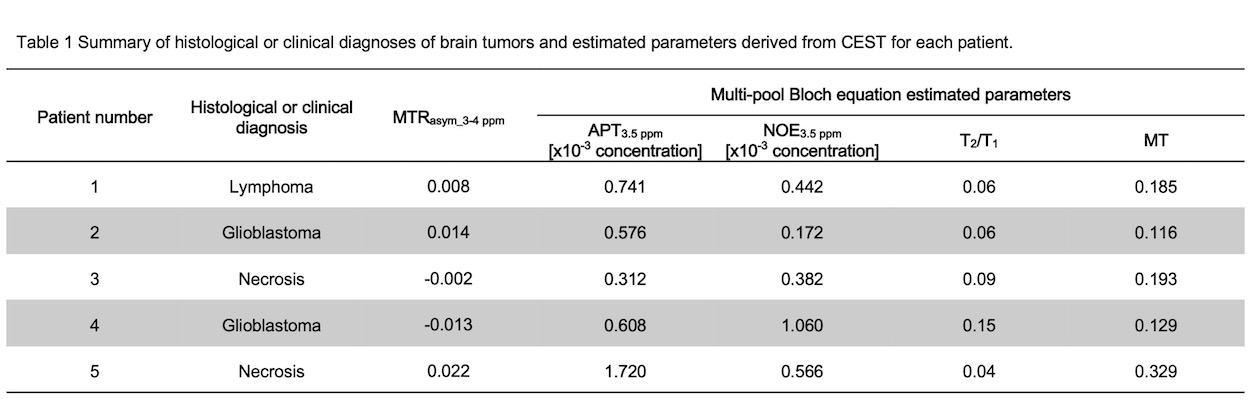
Table 1 Summary of
histological or clinical diagnoses of brain tumors and estimated parameters
derived from CEST for each patient.
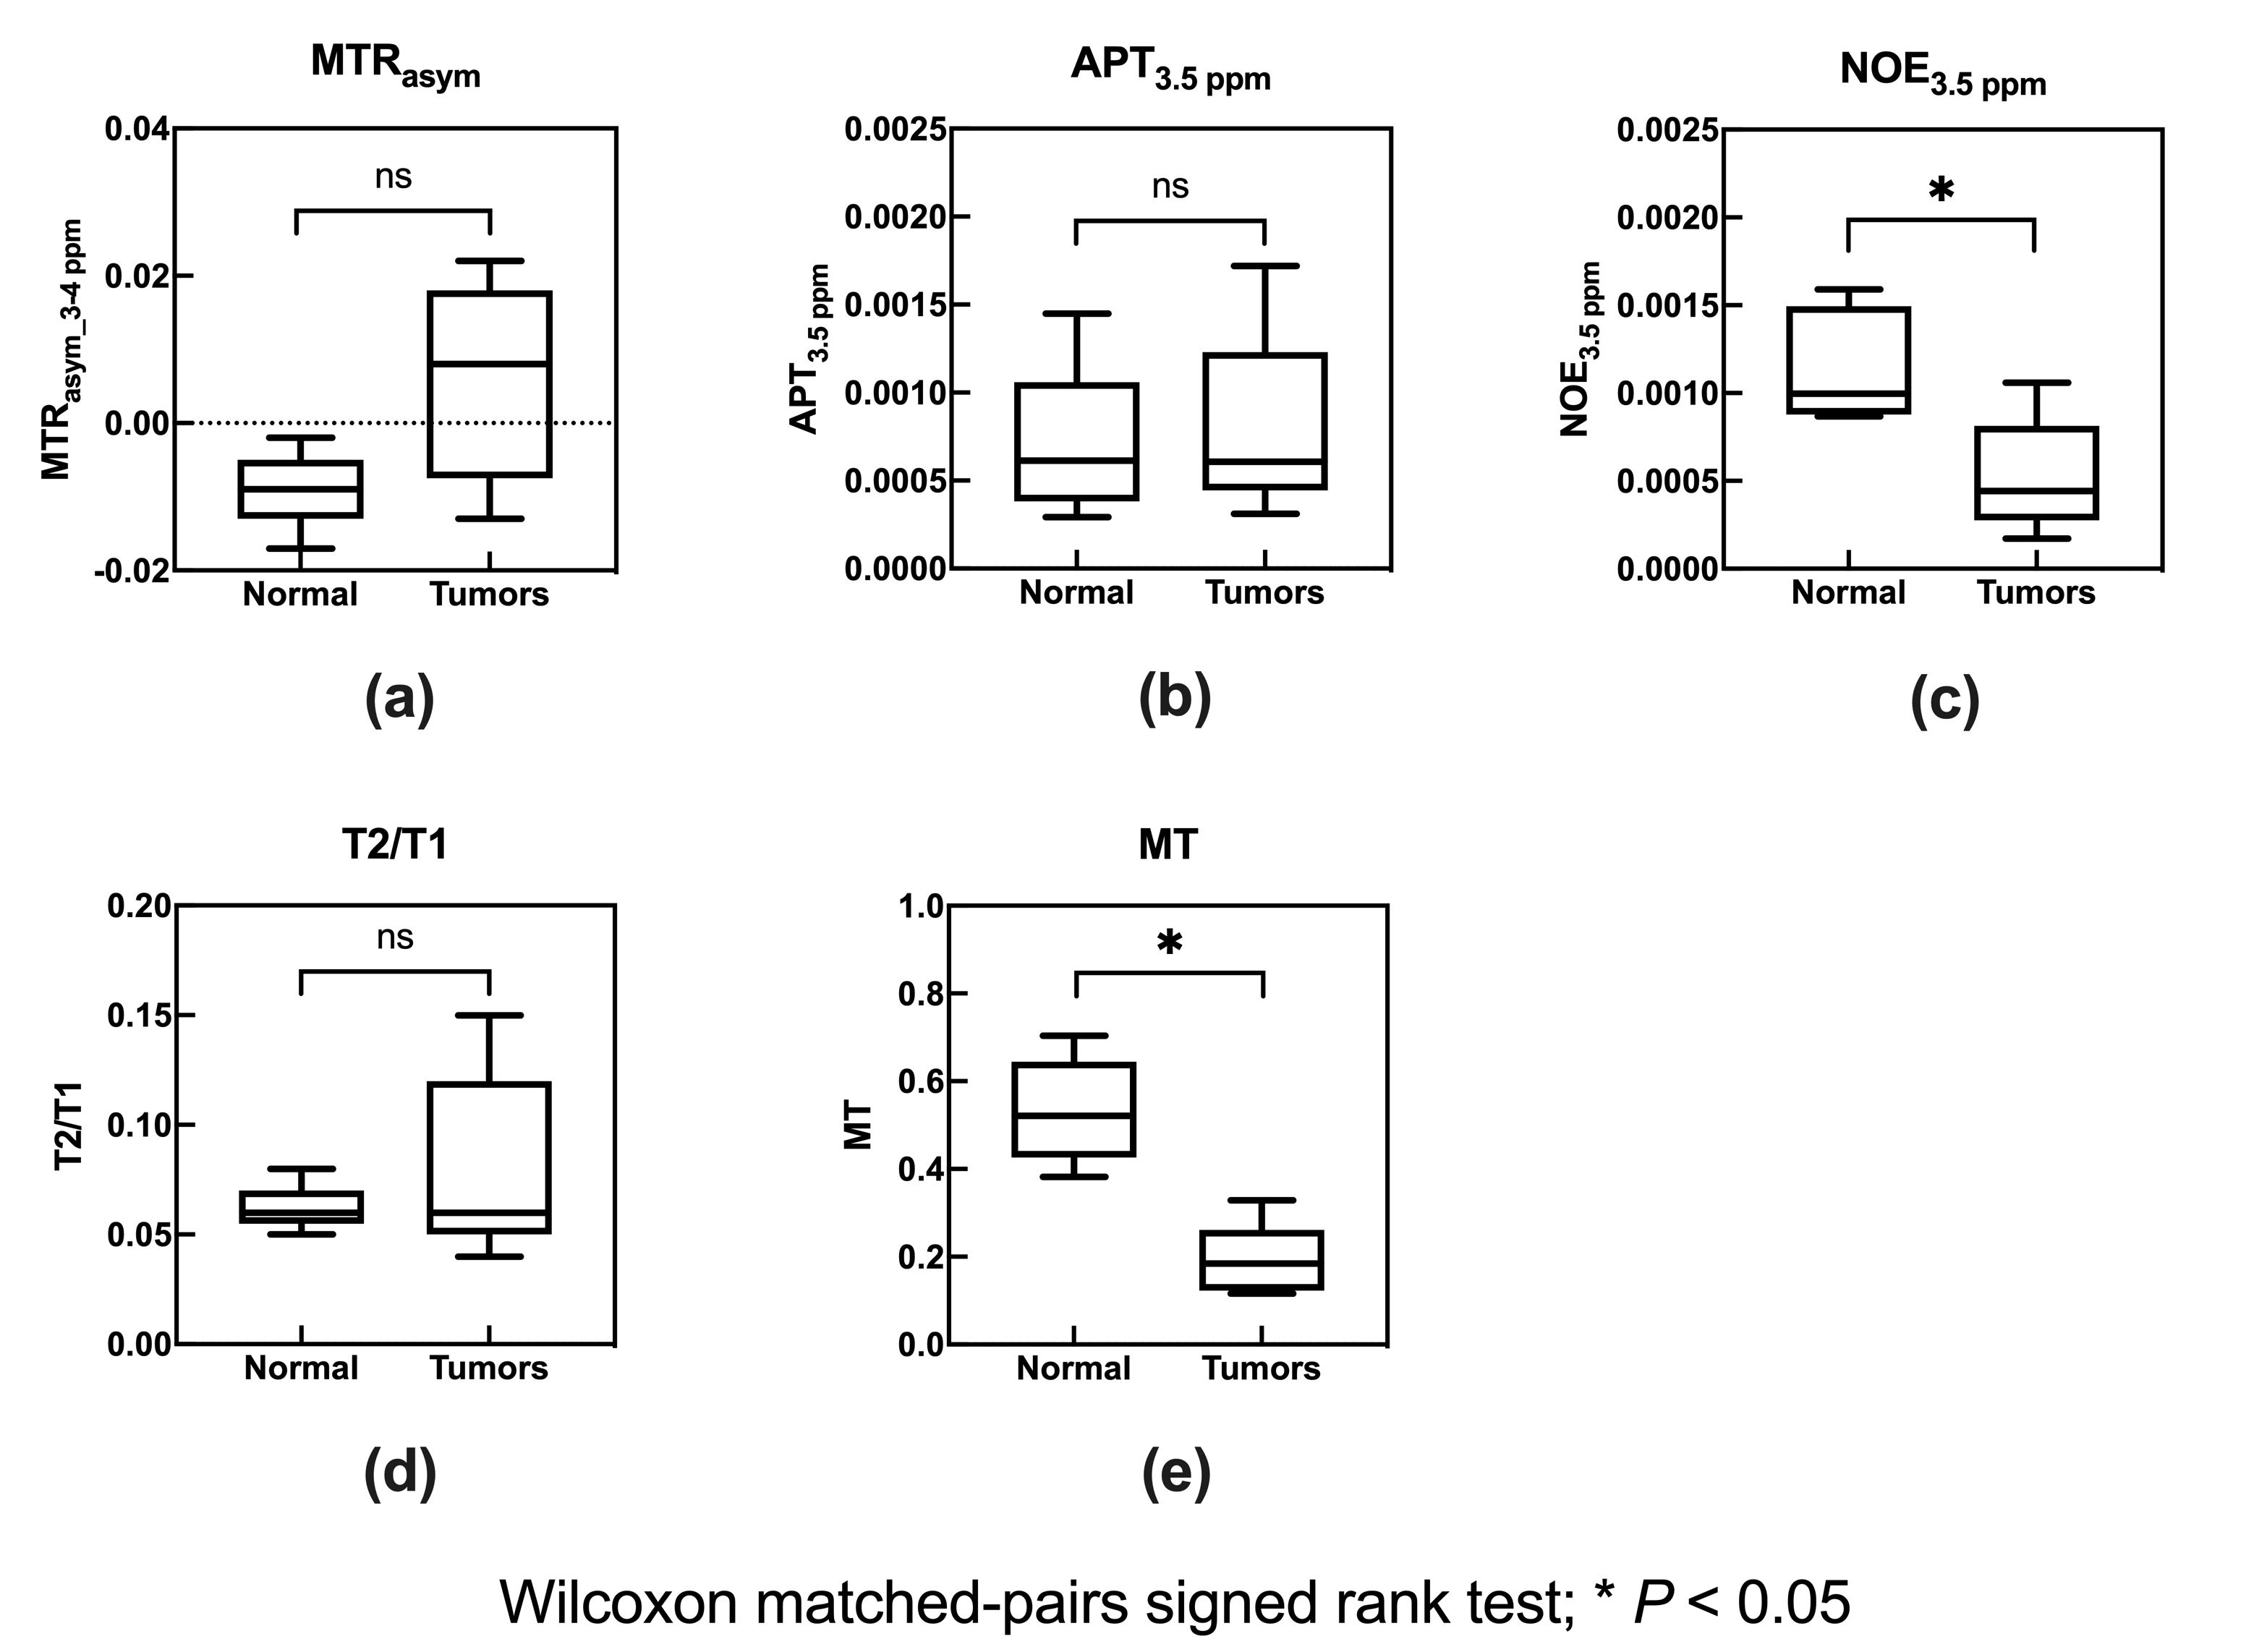
Fig. 1 Box plots
of mean estimated parameters of CEST for normal WM tissue and brain tumors.
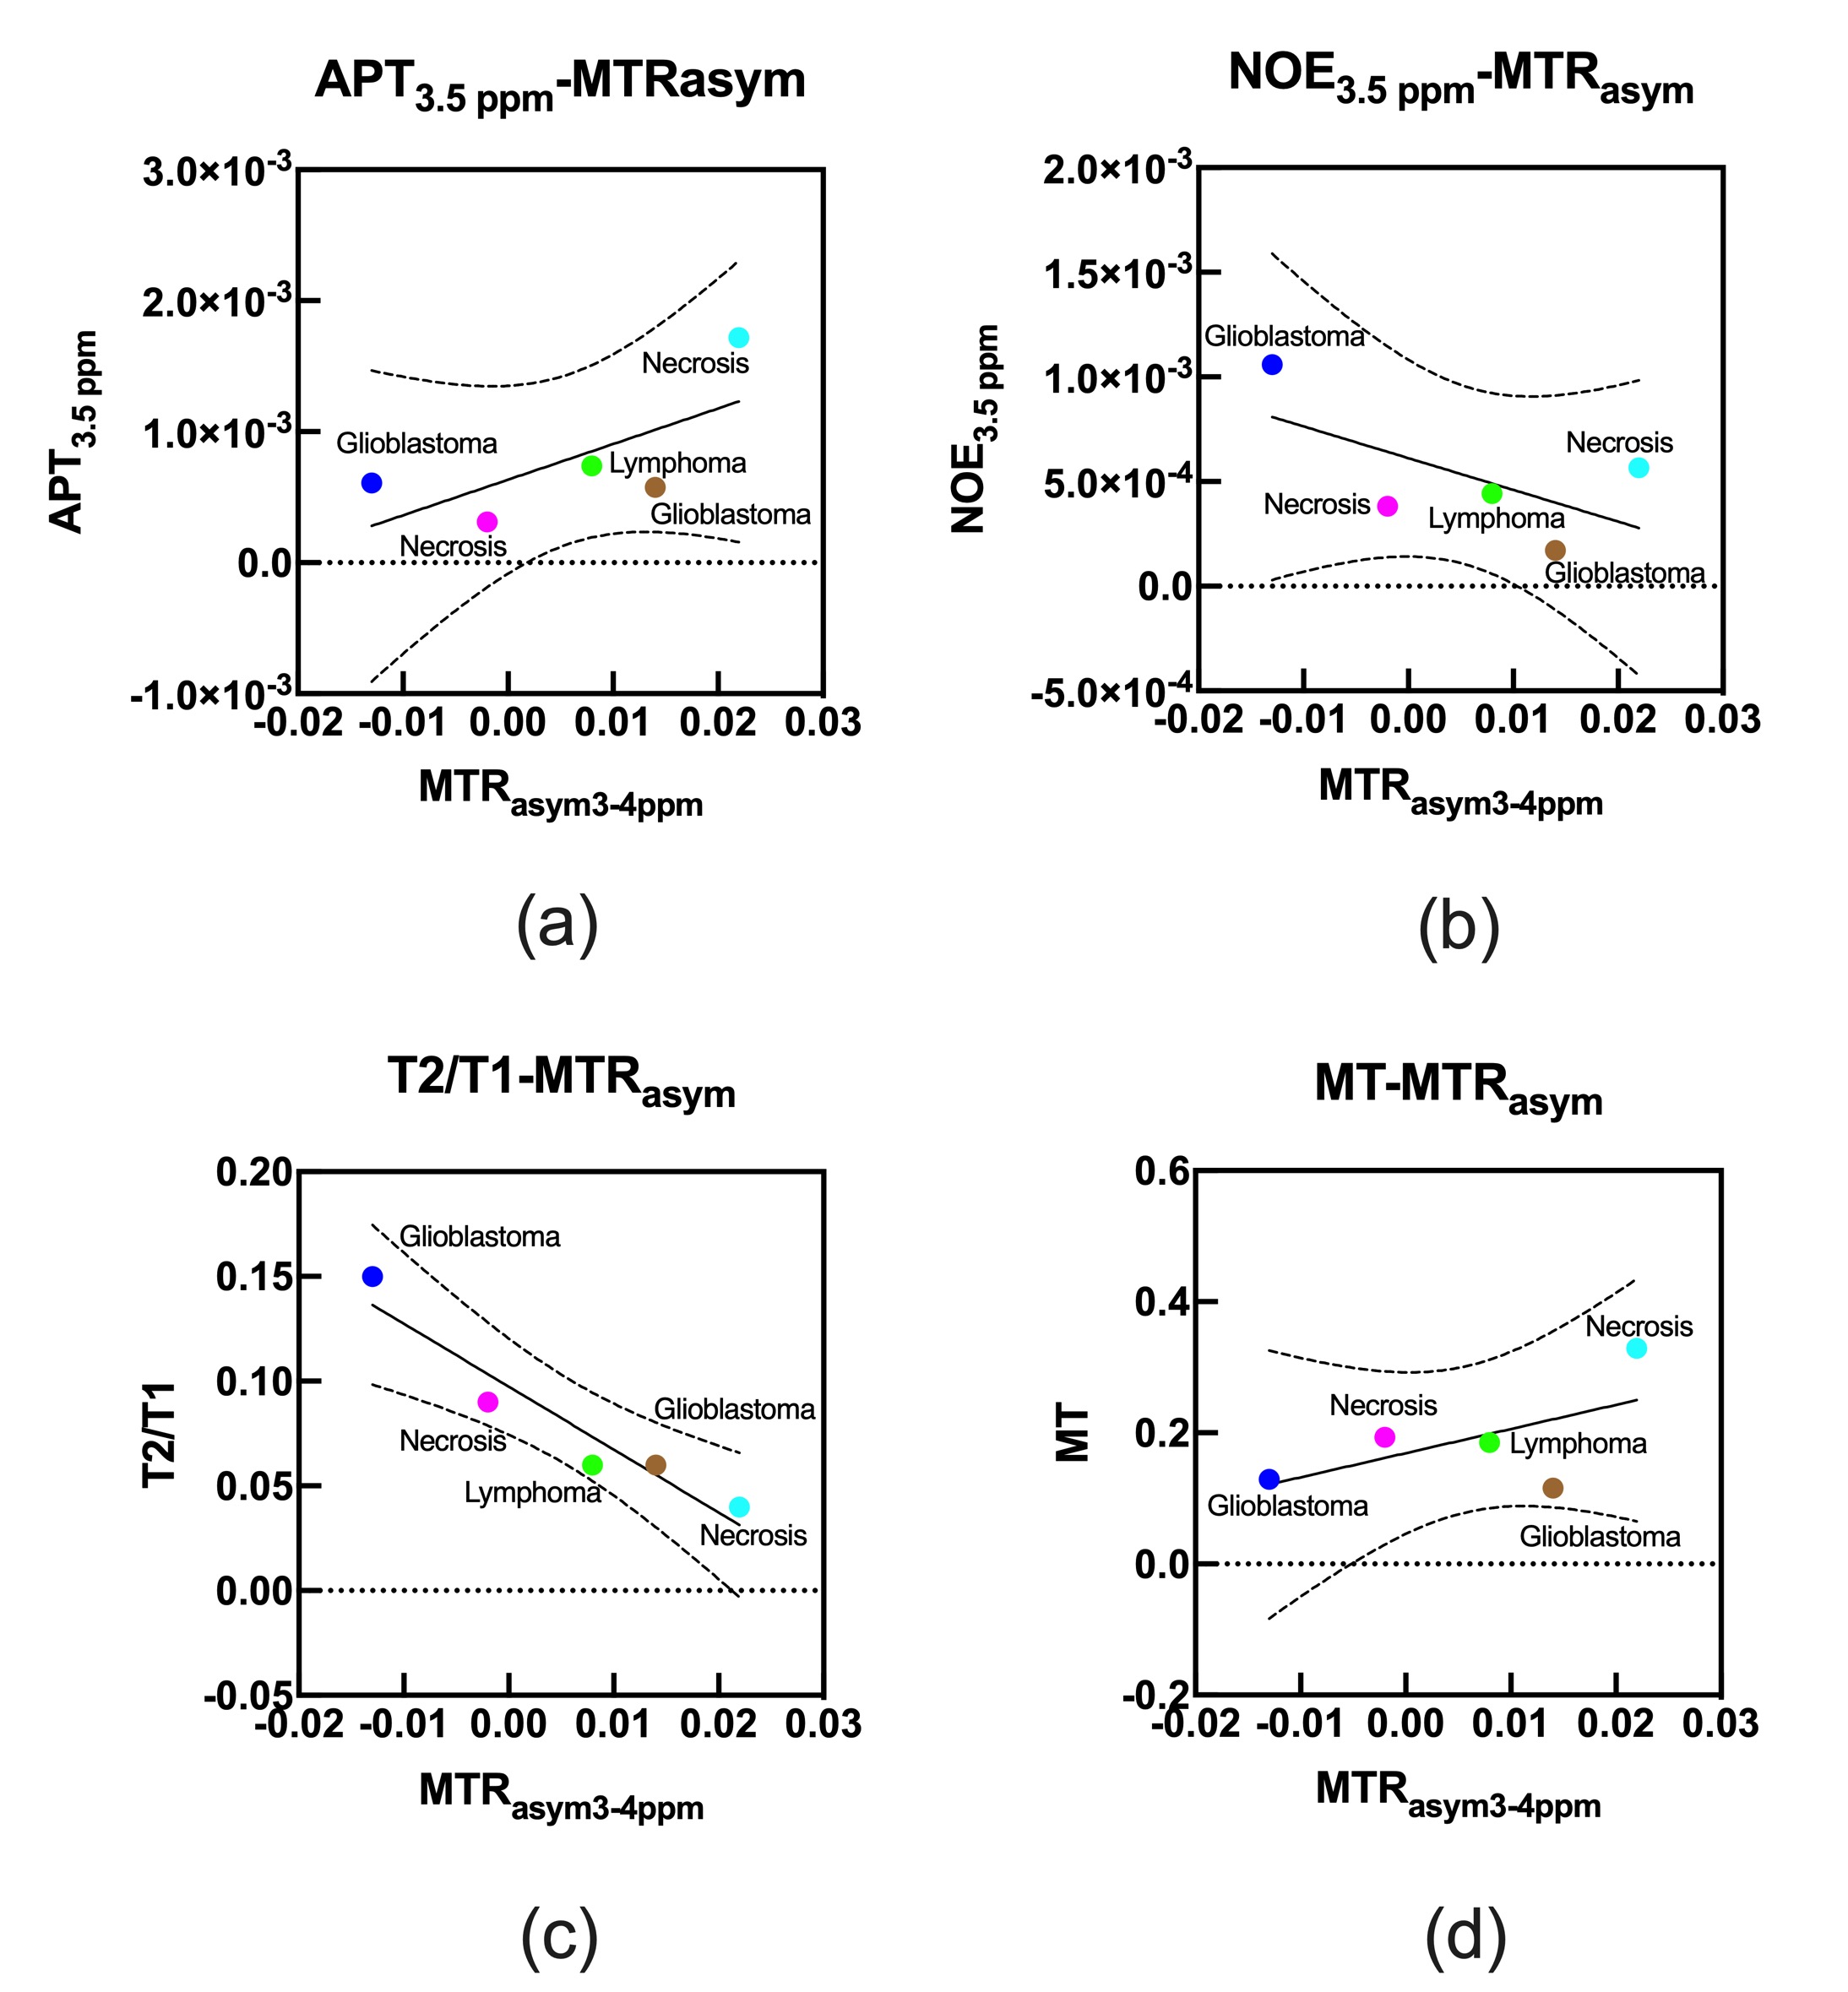
Fig. 2 Scatter
plots of mean MTRasym at 3-4 ppm and each estimated parameter of
CEST for each brain tumor.
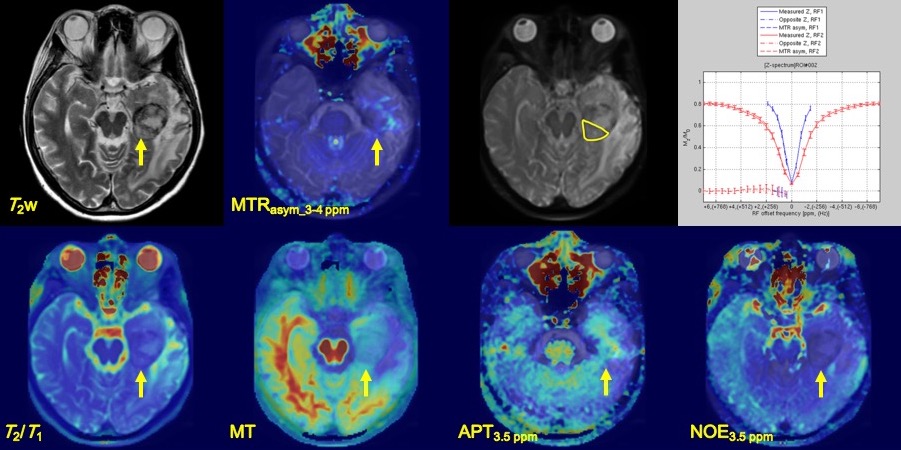
Fig. 3 A 56-year-old female with glioblastoma WHO
grade IV (patient No. 2). T2w imege, MTRasym at
3-4 ppm, estimated CEST parameters map, and Z-spectrum were shown. Z-spectrum
shows at upper-raw of left side. Yellow allows indicate lesion of tumor and a
yellow ellipse ROI.
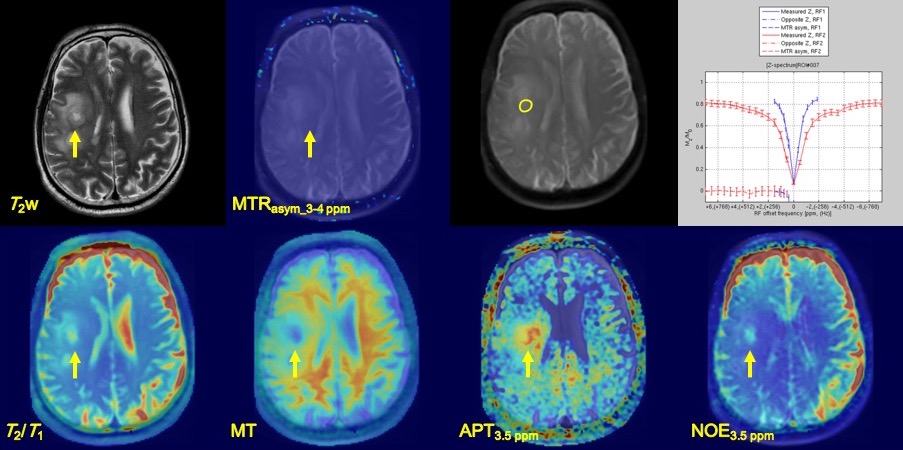
Fig. 4 A 70-year-old male with glioblastoma WHO
grade IV (patient No. 4). T2w imege, MTRasym at
3-4 ppm, estimated CEST parameters map, and Z-spectrum were shown. Z-spectrum
shows at upper-raw of left side. Yellow allows indicate lesion of tumor and a
yellow ellipse ROI.