1696
Assessment of Automated Brain Tumour Segmentation Tools for Clinical Data1Department of Computing, Imperial College London, London, United Kingdom, 2Department of Surgery and Cancer, Imperial College London, London, United Kingdom, 3Department of Imaging, Imperial College Healthcare NHS Trust UK, London, United Kingdom, 4Great Ormond Street Children’s Hospital, London, United Kingdom, 5Department of Medicine, Imperial College London, London, United Kingdom, 6Centre for Clinical Brain Sciences, The University of Edinburgh, Edinburgh, United Kingdom, 7Department of Developmental Neurosciences, UCL Great Ormond Street Institute of Child Health, London, United Kingdom
Synopsis
Radiological diagnosis of certain brain tumours remains poor. The development of automated tools that can extract valuable, yet currently underused, information from routine MRI acquisitions have been explored. The present study aimed to evaluate the accuracy of three automatic tumour segmentation programmes using the BRATS validation 2018 glioma dataset (n=66). The performance of BraTumIA was assessed across an adult glioma dataset from Imperial College Healthcare NHS Trust (n=13) and a paediatric brain tumour dataset from Great Ormond Street Hospital NHS Foundation Trust. DeepMedic segments adult gliomas more accurately than BraTumIA and ONCOhabitats. However, BraTumIA provides a more user-friendly segmentation tool.
Introduction
There are ~11,700 new primary brain tumour cases/year in the UK alone1. Whilst advances have been made in brain tumour research, radiological diagnosis of certain brain tumours, including the more aggressive glioma types, remains poor2. Tumour segmentation involves separating tumorous tissue from healthy brain tissue on MRI scans. Manual brain tumour segmentation by a radiologist remains the gold standard for tumour volume measurement in clinical tumour evaluation, but it is time-consuming and exhibits inter-rater variability. The development of automated tools that can extract valuable, yet currently underused, information from routine MRI acquisitions have been explored3,4. By being able to automatically capture volumetric data from whole tumours, clinical decision making and more accurate assessment of treatment response may be improved.AIMS & METHODS
The present study aimed to evaluate the accuracy of three automatic tumour segmentation programmes using the publicly available BRATS validation 2018 glioma dataset (n=66)3,5-8. The three software packages of interest evaluated in the current study are: i) BraTumIA, a GUI-based with automated pre-processing and segmentation9; ii) ONCOhabitats, an online open-access platform with fully automated pre-processing and segmentation10; iii) DeepMedic, a command line-based tool requiring training11. Furthermore, the performance of BraTumIA was assessed across an adult glioma dataset from Imperial College Healthcare NHS Trust (n=13) and a paediatric brain tumour dataset from Great Ormond Street Hospital NHS Foundation Trust (n=27). Axial T2, pre- and post-contrast T1, and FLAIR sequences were used for segmentation of all three datasets. DeepMedic was trained on a separate dataset, the BRATS 2018 training dataset (n=285)3,5-8 as part of this study while ONCOhabitats and BraTumIA were pre-trained. The automatic segmentation of whole tumour volumes was compared with manual segmentations performed by radiologists and evaluated using the Dice score and Hausdorff distance. To assess the differences in performances of the three segmentation software packages, one-way ANOVA with Tukey’s post hoc analysis was used. To compare the differences in performance of BraTumIA between the adult and paediatric clinical datasets, Mann-Whitney U or Behrens-Fisher tests were used.RESULTS AND DISCUSSION
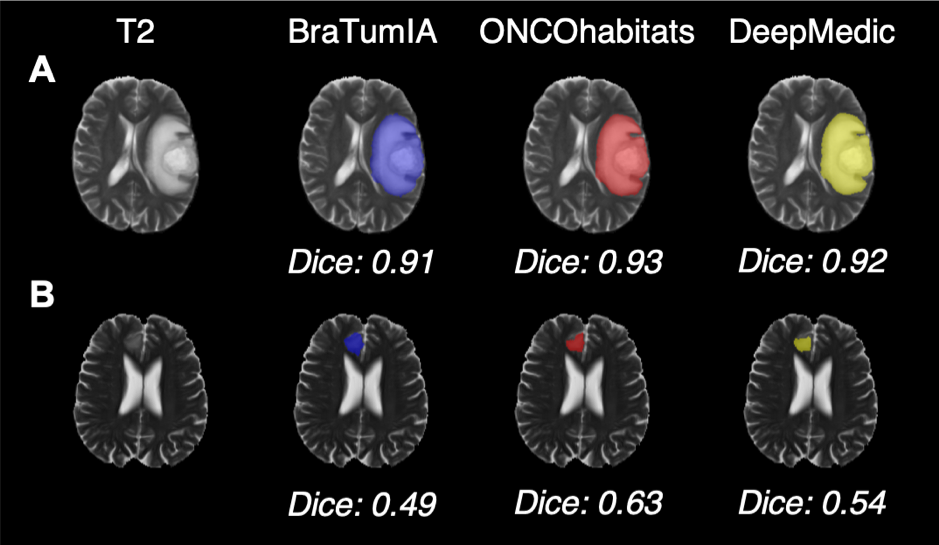
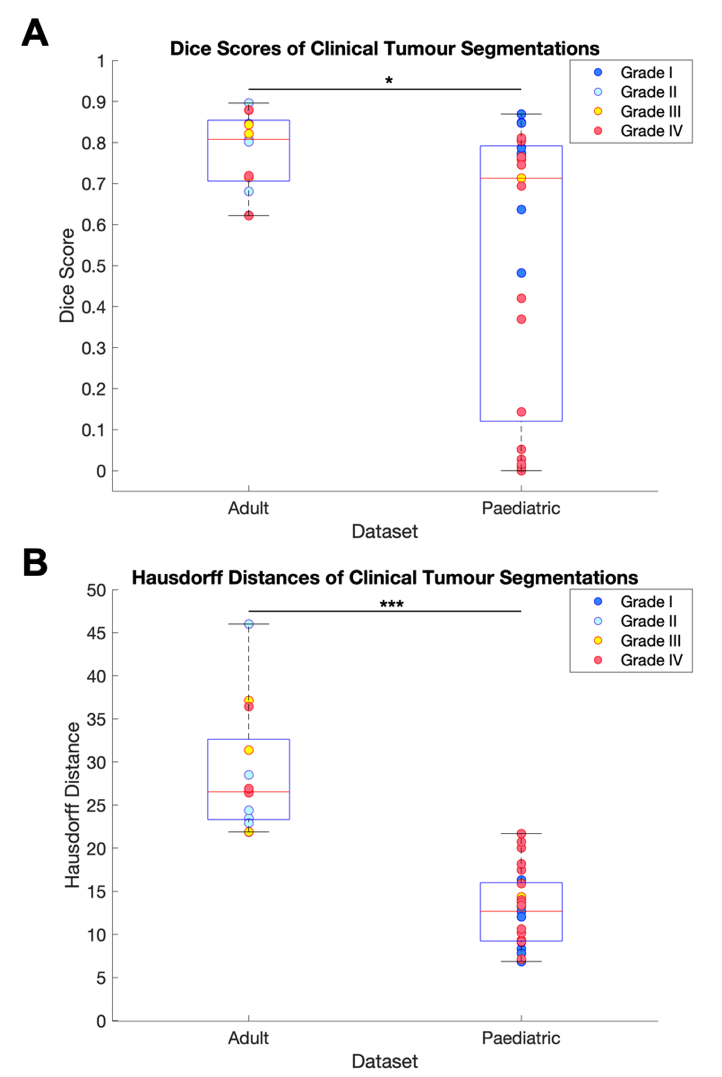
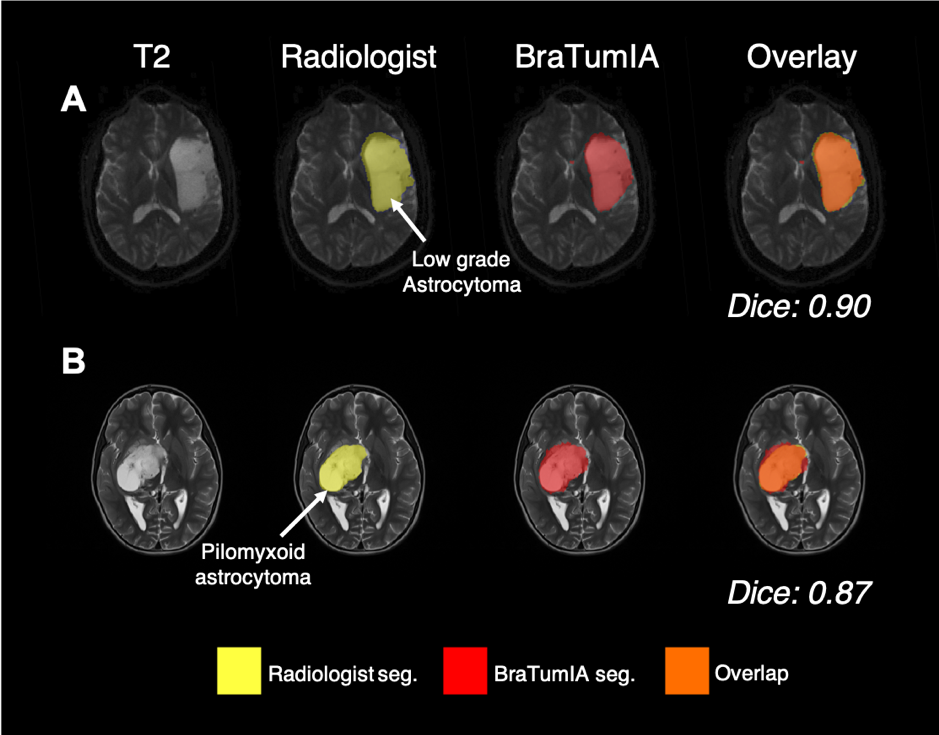
Using the BRATS 2018 validation data, DeepMedic demonstrated the highest overlap with the ground truth labels as indicated by the highest Dice scores compared with BraTumIA and ONCOhabitats (both P<0.001) (Fig. 1 & 2). ONCOhabitats (p=0.003) and DeepMedic (p=0.02) produced shorter Hausdorff distances between the ground truth and automatic segmentations, compared with BraTumIA. The approximate computation time for BraTumIA was 5 minutes per case including preprocessing, whereas ONCOhabitats took 30 minutes per case. The computation time for training on Google Colab took approximately 35 hours and testing on the 66 BRATS 2018 validation dataset took 10 minutes per case the CPU with the default parameters.Regarding the performance of BraTumIA analysed on the clinical adult glioma and paediatric mixed primary brain tumour datasets, 10/13 (76.9%) adult and 14/25 (56.0%) paediatric brain tumour cases demonstrated Dice scores >0.70, indicative of a good overlap (Figs. 3 & 4). BraTumIA performed better on the adult brain tumour dataset compared with the paediatric dataset as indicated by a significantly increased Dice score (p=0.02). The Hausdorff distances demonstrated contradicting results to the Dice scores, whereby the paediatric dataset exhibited significantly lower values compared with the adult dataset.
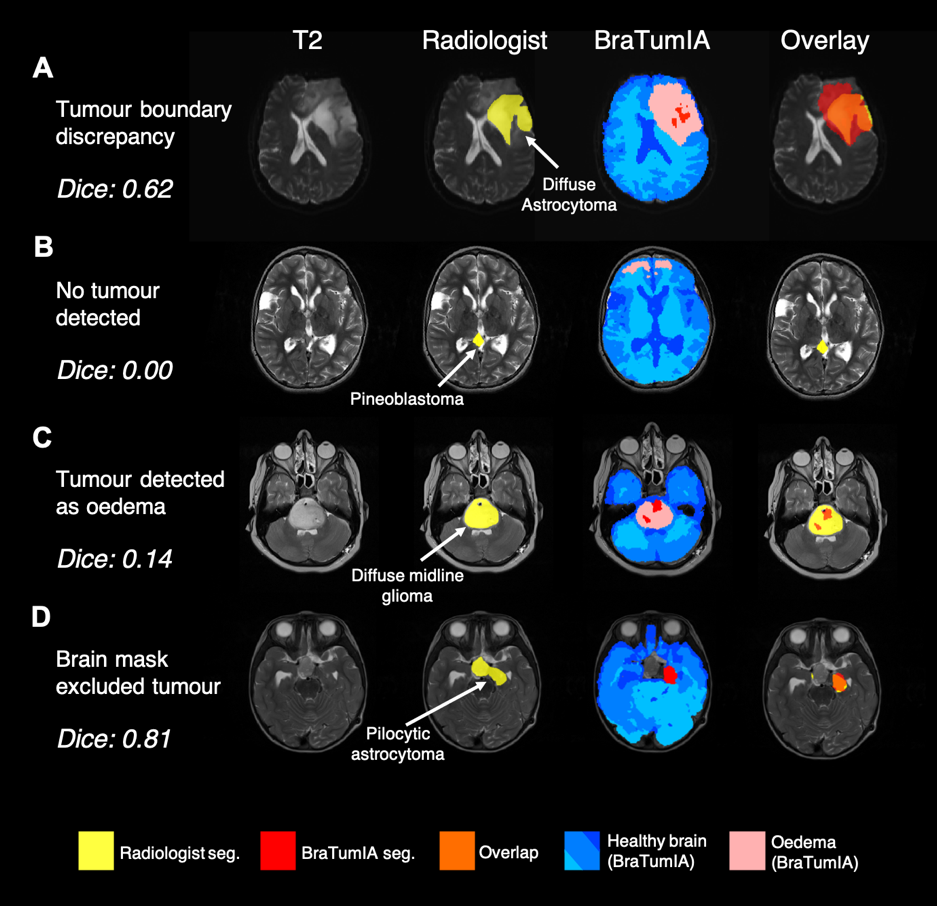
Various examples of issues encountered with BraTumIA on the clinical dataset are highlighted in Fig. 5. Firstly, within the adult dataset, the lowest Dice score was that of a diffuse astrocytoma, whereby BraTumIA over-estimated the tumour compared with the manual segmentation (Fig. 5A). Fig. 5B demonstrates a paediatric pineoblastoma located between the two lateral ventricles that went completely undetected by BraTumIA. Instead, healthy regions in the frontal lobe were incorrectly detected as oedema. Another paediatric example of a large diffuse midline glioma present in the cerebellum demonstrates that BraTumIA identified the majority of the tumour as oedema, thus when the oedema label was removed, the Dice score decreased significantly (Fig. 5C). Another problem encountered with BraTumIA was its tendency to exclude areas of brain/tumour during the skull stripping process in the paediatric dataset, 17 cases of which had some extent of tumour loss due to inaccurate skull stripping. Fig. 5D demonstrates a slow-growing pilocytic astrocytoma whereby the skull strip excluded the area around the optic chiasm where the tumour was located. BraTumIA was able to detect part of the tumour that remained within the skull stripped area, thus, this indicated a problem with the preprocessing BraTumIA performs and not the tumour segmentation process per se.
CONCLUSION
The results of this study suggest that DeepMedic segments adult gliomas more accurately than BraTumIA and ONCOhabitats. However, BraTumIA provides a user-friendly, fully integrated segmentation tool, allowing non-specialist users to use the software, making it more clinically feasible. BraTumIA performed well on a clinical adult glioma dataset. However, various issues remain to be resolved regarding BraTumia’s use in paediatric scans. This is largely due to the unique biology of paediatric brain tumours, which encompass a number of tumour subtypes which are rarely seen in adults and which have not been used in training the software. Notably, the collaboration between clinicians and software developers is required to produce clinically applicable software able to overcome the current challenges faced in brain tumour management.Acknowledgements
PH and MGS contributed equally to this work. The authors would like to thank the patients who participated in this study. This study was supported by the Imperial NIHR Biomedical Research Centre and the Imperial College Healthcare NHS Trust Imaging Research Team. PH would like to thank Children with Cancer UK (CwCUK-15-203).References
1. Cancer Research, U.K. (2019) Brain, other CNS and intracranial tumours statistics. Available from: https://www.cancerresearchuk.org/health-professional/cancer-statistics/statistics-by-cancer-type/brain-other-cns-and-intracranial-tumours#heading-Zero [Accessed Jul 12, 2019].
2. Menze, B. H., Jakab, A., Bauer, S., Kalpathy-Cramer, J., Farahani, K., Kirby, J., et al. (2015) The Multimodal Brain Tumor Image Segmentation Benchmark (BRATS). IEEE Transactions on Medical Imaging. 34 (10), 1993-2024. Available from: https://ieeexplore.ieee.org/document/6975210. Available from: doi: 10.1109/TMI.2014.2377694.
3. Pereira, S., Pinto, A., Alves, V. & Silva, C. A. (2016) Brain Tumor Segmentation Using Convolutional Neural Networks in MRI Images. IEEE Transactions on Medical Imaging. 35 (5), 1240-1251. Available from: https://ieeexplore.ieee.org/document/7426413. Available from: doi: 10.1109/TMI.2016.2538465.
4. Fyllingen, E. H., Stensjøen, A. L., Berntsen, E. M., Solheim, O. & Reinertsen, I. (2016) Glioblastoma Segmentation: Comparison of Three Different Software Packages. PloS One. 11 (10), e0164891. Available from: https://www.ncbi.nlm.nih.gov/pubmed/27780224. Available from: doi: 10.1371/journal.pone.0164891.
5. Bakas, S., Akbari, H., Sotiras, A., Bilello, M., Rozycki, M., Kirby, J., et al., "Advancing The Cancer Genome Atlas glioma MRI collections with expert segmentation labels and radiomic features", Nature Scientific Data, 4:170117 (2017a) DOI: 10.1038/sdata.2017.117
6. Bakas, S., Akbari, H., Sotiras, A., Bilello, M., Rozycki, M., Kirby, J., et al., "Segmentation Labels and Radiomic Features for the Pre-operative Scans of the TCGA-GBM collection", The Cancer Imaging Archive, 2017b. DOI: 10.7937/K9/TCIA.2017.KLXWJJ1Q
7. Bakas, S., Akbari, H., Sotiras, A., Bilello, M., Rozycki, M., Kirby, J., et al., "Segmentation Labels and Radiomic Features for the Pre-operative Scans of the TCGA-LGG collection", The Cancer Imaging Archive, 2017c. DOI: 10.7937/K9/TCIA.2017.GJQ7R0EF
8. Bakas, S., Reyes, M., Jakab, A., Bauer, S., Rempfler, M., Crimi, A., Shinohara, R.T. et al. (2018) Identifying the Best Machine Learning Algorithms for Brain Tumor Segmentation, Progression Assessment, and Overall Survival Prediction in the BRATS Challenge. Available from: https://arxiv.org/abs/1811.02629.
9. Porz, N., Bauer, S., Pica, A., Schucht, P., Beck, J., Verma, R. K., Slotboom, J., Reyes, M. & Wiest, R. (2014) Multi-Modal Glioblastoma Segmentation: Man versus Machine. PloS One. 9 (5), e96873. Available from: https://www.ncbi.nlm.nih.gov/pubmed/24804720. Available from: doi: 10.1371/journal.pone.0096873.
10. Juan-Albarracín, J., Fuster-Garcia, E., Manjón, J. V., Robles, M., Aparici, F., Martí-Bonmatí, L. & García-Gómez, J. M. (2015) Automated Glioblastoma Segmentation Based on a Multiparametric Structured Unsupervised Classification. PloS One. 10 (5), e0125143. Available from: https://www.ncbi.nlm.nih.gov/pubmed/25978453. Available from: doi: 10.1371/journal.pone.0125143.
11. Kamnitsas, K., Ledig, C., Newcombe, V. F. J., Simpson, J. P., Kane, A. D., Menon, D. K., Rueckert, D. & Glocker, B. (2017) Efficient multi-scale 3D CNN with fully connected CRF for accurate brain lesion segmentation. Medical Image Analysis. 36 61-78. Available from: https://www.sciencedirect.com/science/article/pii/S1361841516301839. Available from: doi: 10.1016/j.media.2016.10.004.
Figures