1693
Radiomics features from APTw MRI improve the diagnostic performance of structural MRI in early response assessment of malignant gliomas1Radiology, Johns Hopkins University, Baltimore, MD, United States, 2Computer Science, Johns Hopkins University, Baltimore, MD, United States, 3Neurology, Johns Hopkins University, Baltimore, MD, United States, 4Pathology, Johns Hopkins University, Baltimore, MD, United States, 5Neurosurgery, Johns Hopkins University, Baltimore, MD, United States, 6F.M. Kirby Research Center, Kennedy Krieger Institute, Baltimore, MD, United States
Synopsis
Assessment of glioma treatment is based on pathological evaluation via biopsies or radiological criteria using follow-up MRI, which is either invasive or time consuming. Amide protein transfer weighted (APTw) MRI has been validated to accurately detect recurrent malignant gliomas by multiple studies. The cutting edge methodology of radiomics provides quantitative measurements for imaging diagnosis. Here, we develop an automated framework that integrates APTw MRI radiomic features with a machine learning model to evaluate treatment response for gliomas. Our results suggest that the use of APTw features enabled the radiomic model to reach a more accurate assessment of the treatment effect.
Purpose
Malignant gliomas, such as WHO grade-IV glioblastoma (GBM) and grade-III anaplastic astrocytoma (AA), are the most common and deadly primary brain cancers in adults around the world1. A major obstacle in daily patient management that has remained for decades is that standard neuroimaging lacks sufficient specificity for the assessment of glioma response to therapy. Amide proton transfer-weighted (APTw) MRI, a method generating contrast dominated by endogenous mobile proteins, is showing an encouraging diagnostic performance for gliomas2-4. Currently, radiomics and machine learning analyses are considered to be promising approaches for computer-aided diagnosis5,6. Here, we extract radiomic features from APTw MRI and quantify the accuracy of a machine learning model for identifying viable recurrent malignant glioma. The goal was to evaluate the power of APTw-MRI based radiomics for classification of treatment effects and tumor recurrence in post treatment malignant gliomas.Methods
Patients:A total of 89 patients, who had MRI exams between May 2010 and August 2016, were enrolled. Each patient had all study-related MRI data within 6 months after their standard chemoradiation regimen completion. Approval for the study was obtained from the local IRB, and all patients provided informed consent. Patients were diagnosed as treatment effect vs. tumor recurrence based on histopathologic diagnosis or the longitudinal MRI analysis according to the updated the Response Assessment in Neuro-Oncology (RANO) criteria7.
MRI protocol:
All patients were scanned on a Philips 3T MRI system. The sequences performed for each patient included T1w, T2w, FLAIR, APTw, and gadolinium contrast-enhanced T1w (T1w-Gd). A multi-offset, multi-acquisition imaging acquisition scheme was used for volumetric APTw imaging (saturation power = 2 μT; saturation time = 800 msec; matrix = 256×256; field of view = 212×186 mm2; slice thickness = 4.4 mm; scan time = 4 min)8. APTw images were calculated using the magnetization transfer ratio asymmetry at 3.5ppm offset from the water frequency. .
Data Postprocessing:
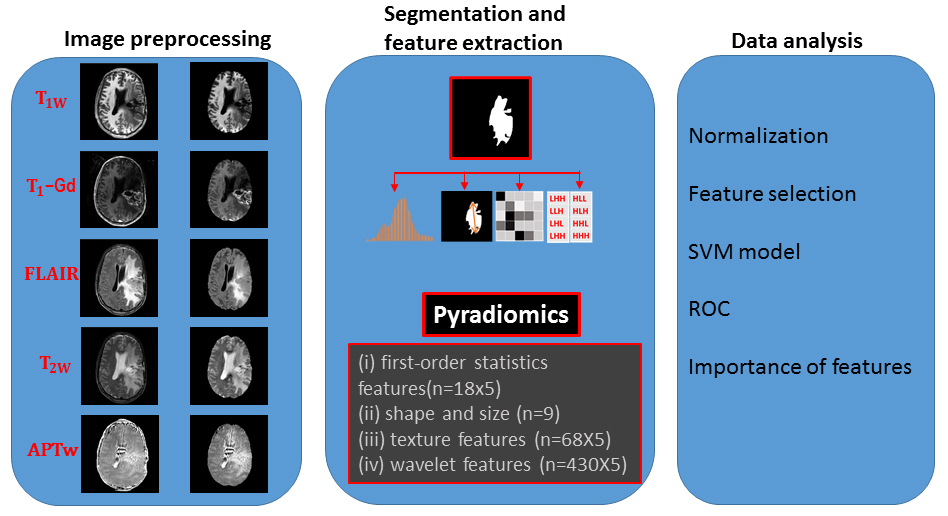
The data processing workflow is presented in Figure 1. All MRI volumes (T1w, T2w, FLAIR, T1w-Gd and APTw) were resampled and co-registered to T2w images. Normalization, bias correction, and skull-stripping were applied. Manual annotation was performed by a radiologist to accurately segment the regions with abnormal signal intensities on T2w images using 3D Slicer9. Then, the largest mask for each subject was chosen to apply for feature extraction. Radiomic features including: (i) first-order statistics; (ii) shape and size; (iii) texture; and (iv) wavelet, were extracted from the tumor ROIs by a customized PyRadiomics program.10,11 Each MRI sequence yielded 525 radiomics features.
Statistical analysis:
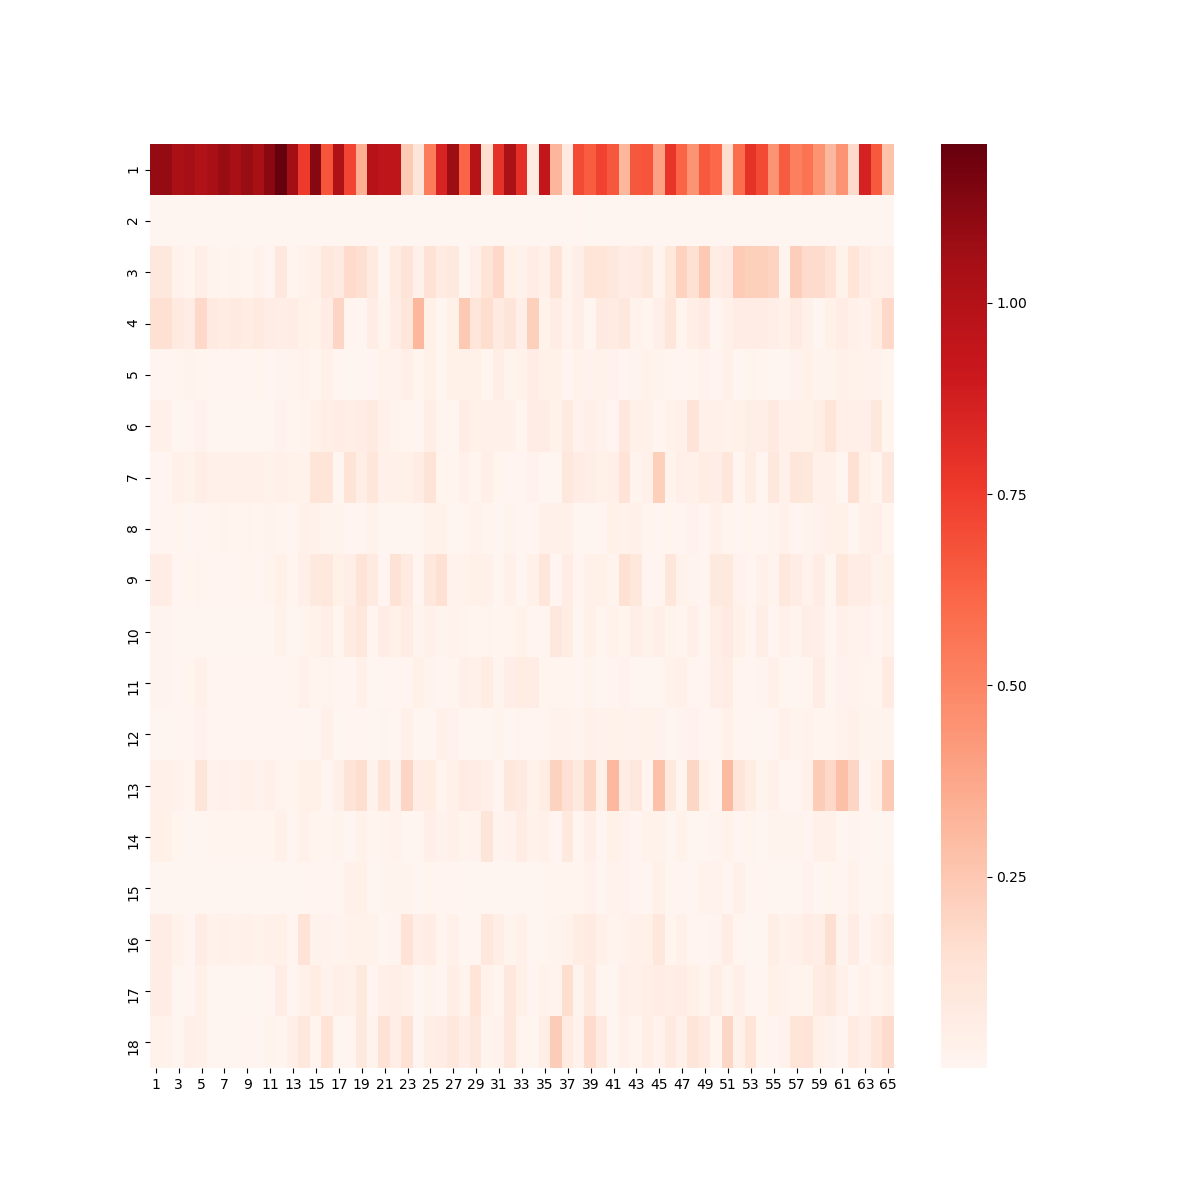
All values of features were normalized across features and subjects. For the feature selection, univariate analysis was performed to compare radiomic features between treatment effect and tumor recurrence to identify features with significant difference (p < 0.05). Pairs of features with a correlation coefficient |r| > 0.85 were removed after the Pearson correlation analysis. Then, a principal component analysis (PCA) was applied to reduce dimensionality with a 90% variation expressed. After the feature selection strategy was utilized to reduce any bias of results and potential overfitting, the top relevant variances identified by the PCA were evaluated by support vector machine (SVM) method, as shown schematically in Figures 1 and 2. 89 cases were randomly assigned to training set and validation set. Five-fold cross-validation was used for tuning parameter (γ) selection. Leave-one-out cross-validation was applied to get an overall estimation of the classification performance of the models. The accuracy of a classifier was determined by ROC analysis. AUC, sensitivity, specificity, and classification accuracy were measured from the results. Finally, the top features identified by the model with the highest impaction on the classifier were weighted according to their regression coefficients Figure 3. The alpha level of all tests was set at P < 0.05.
Results and Discussion
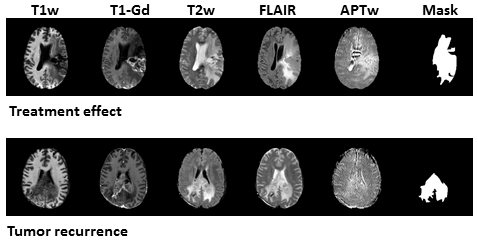
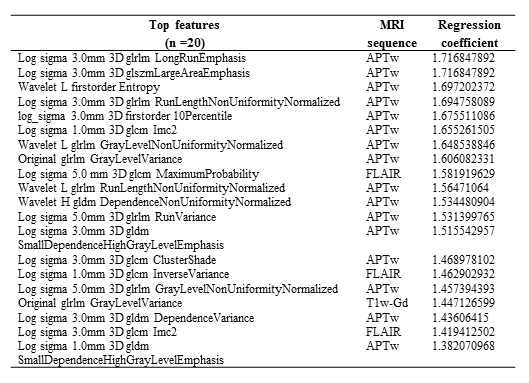
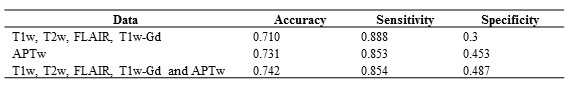
89 patients (age, 23-78 years old; 34 females and 55 males; 25 grade III and 63 grade IV) were enrolled. 26 patients were confirmed as tumor recurrence, and the remaining 63 patients as treatment effect on biopsy or RANO criteria. Figure 2 shows structural and APTw MR images for two GBM patients with tumor recurrence and treatment effect, respectively. Age, WHO grade and gender showed no significant difference between the training set and validation set. In the test set, the model achieved accuracies of 71.0% with radiomic features extracted from structural MR images (T1w, T2w, FLAIR, T1w-Gd), while 73.1% with the features only from the APTw image, and 74.2% with the features from both the structural and APTw images. The radiomic features extracted from APTw images showed incremental value in distinguishing treatment effect from tumor recurrence in post treatment malignant gliomas. The corresponding sensitivity and specificity data were listed in Table 1. The 20 radiomic features (16 features are from APTw, 3 from FLAIR, 1 from T1w-Gd) that contributed most to the models are presented in Table 2.Conclusion
As a pilot proof-of-concept study, our radiomics models presented here achieved an accuracy of 74.2% in treatment response assessment. The findings of our study support the use of textures extracted from APTw MRI to aid the accurate treatment response assessment for post treatment malignant gliomas by increasing detection specificity.Acknowledgements
This work was supported in part by grants from the National Institutes of Health (R01CA228188 and P41EB015909).References
(1) Wen, P. Y. et al. J. Clin. Oncol. 28, 1963 (2010).
(2) Jiang, S. et al. Clin. Cancer Res. 25, 552 (2019).
(3) Park, J. E. et al. Euro. Radiol. 28, 3285 (2018).
(4) Meissner, J. E. et al. J. Magn. Reson. Imaging 50, 1268 (2019).
(5) Pinker, K. et al. Radiology 287, 732 (2018).
(6) Ellingson, B. M. et al. Neuro. Oncol. 21, 1346 (2019).
(7) Eisele, S. C., et al. Curr. Treat. Options Oncol. 17, 35 (2016).
(8) Zhou, J. et al. J. Magn. Reson. Imaging 38,1119 (2013).
(9) Fedorov, A. E. et al. Magn. Reson. Imaging 30, 1323 (2012).
(10) PyRadiomics, https://pyradiomics.readthedocs.io.
(11) van Griethuysen, J. J. M. et al. Cancer Res. 77, e104 (2014).
Figures