1692
Correlation of glioma grade with basal ganglia iron content using QSMnet+1Biophysics, Medical College of Wisconsin, Milwaukee, WI, United States, 2Electrical and Computer Engineering, Seoul National University, Seoul, Korea, Republic of, 3Biomedical Engineering, Medical College of Wisconsin, Milwaukee, WI, United States, 4Hematology & Oncology, Medical College of Wisconsin, Milwaukee, WI, United States
Synopsis
Basal ganglia iron levels were assessed in 55 patients with gliomas by using a deep neural network-powered quantitative susceptibility mapping method (QSMnet+). Basal ganglia QSM values increased with higher tumor grade, suggesting a correlation between BG iron content and glioma severity.
Introduction
Gliomas are primary brain tumors that arise from the supportive glial cells that surround and nourish neurons. The role of iron in glioma pathophysiology has been a subject of recent interest, as these tumors alter cellular metabolism and transport in ways that result in net iron influx.1-3 Quantitative susceptibility mapping (QSM) is a novel contrast mechanism that allows brain iron content to be measured in vivo by reconstructing tissue magnetic susceptibility from gradient echo (GRE) phase sequence data. In a preliminary study performed by us, we used standard QSM processing methods that demonstrated higher basal ganglia (BG) iron content in patients with glioblastoma than in patients with lower grade gliomas.4 In the current study, we use a deep neural network trained QSM method (QSMnet+5,6) to evaluate iron content in a much larger cohort of glioma patients. QSMnet+ was previously shown to have superior image quality and linearity as a function of iron content.6 To our knowledge, this is the first study to use QSMnet+ to assess iron content in the brains of patients with glioma.Methods
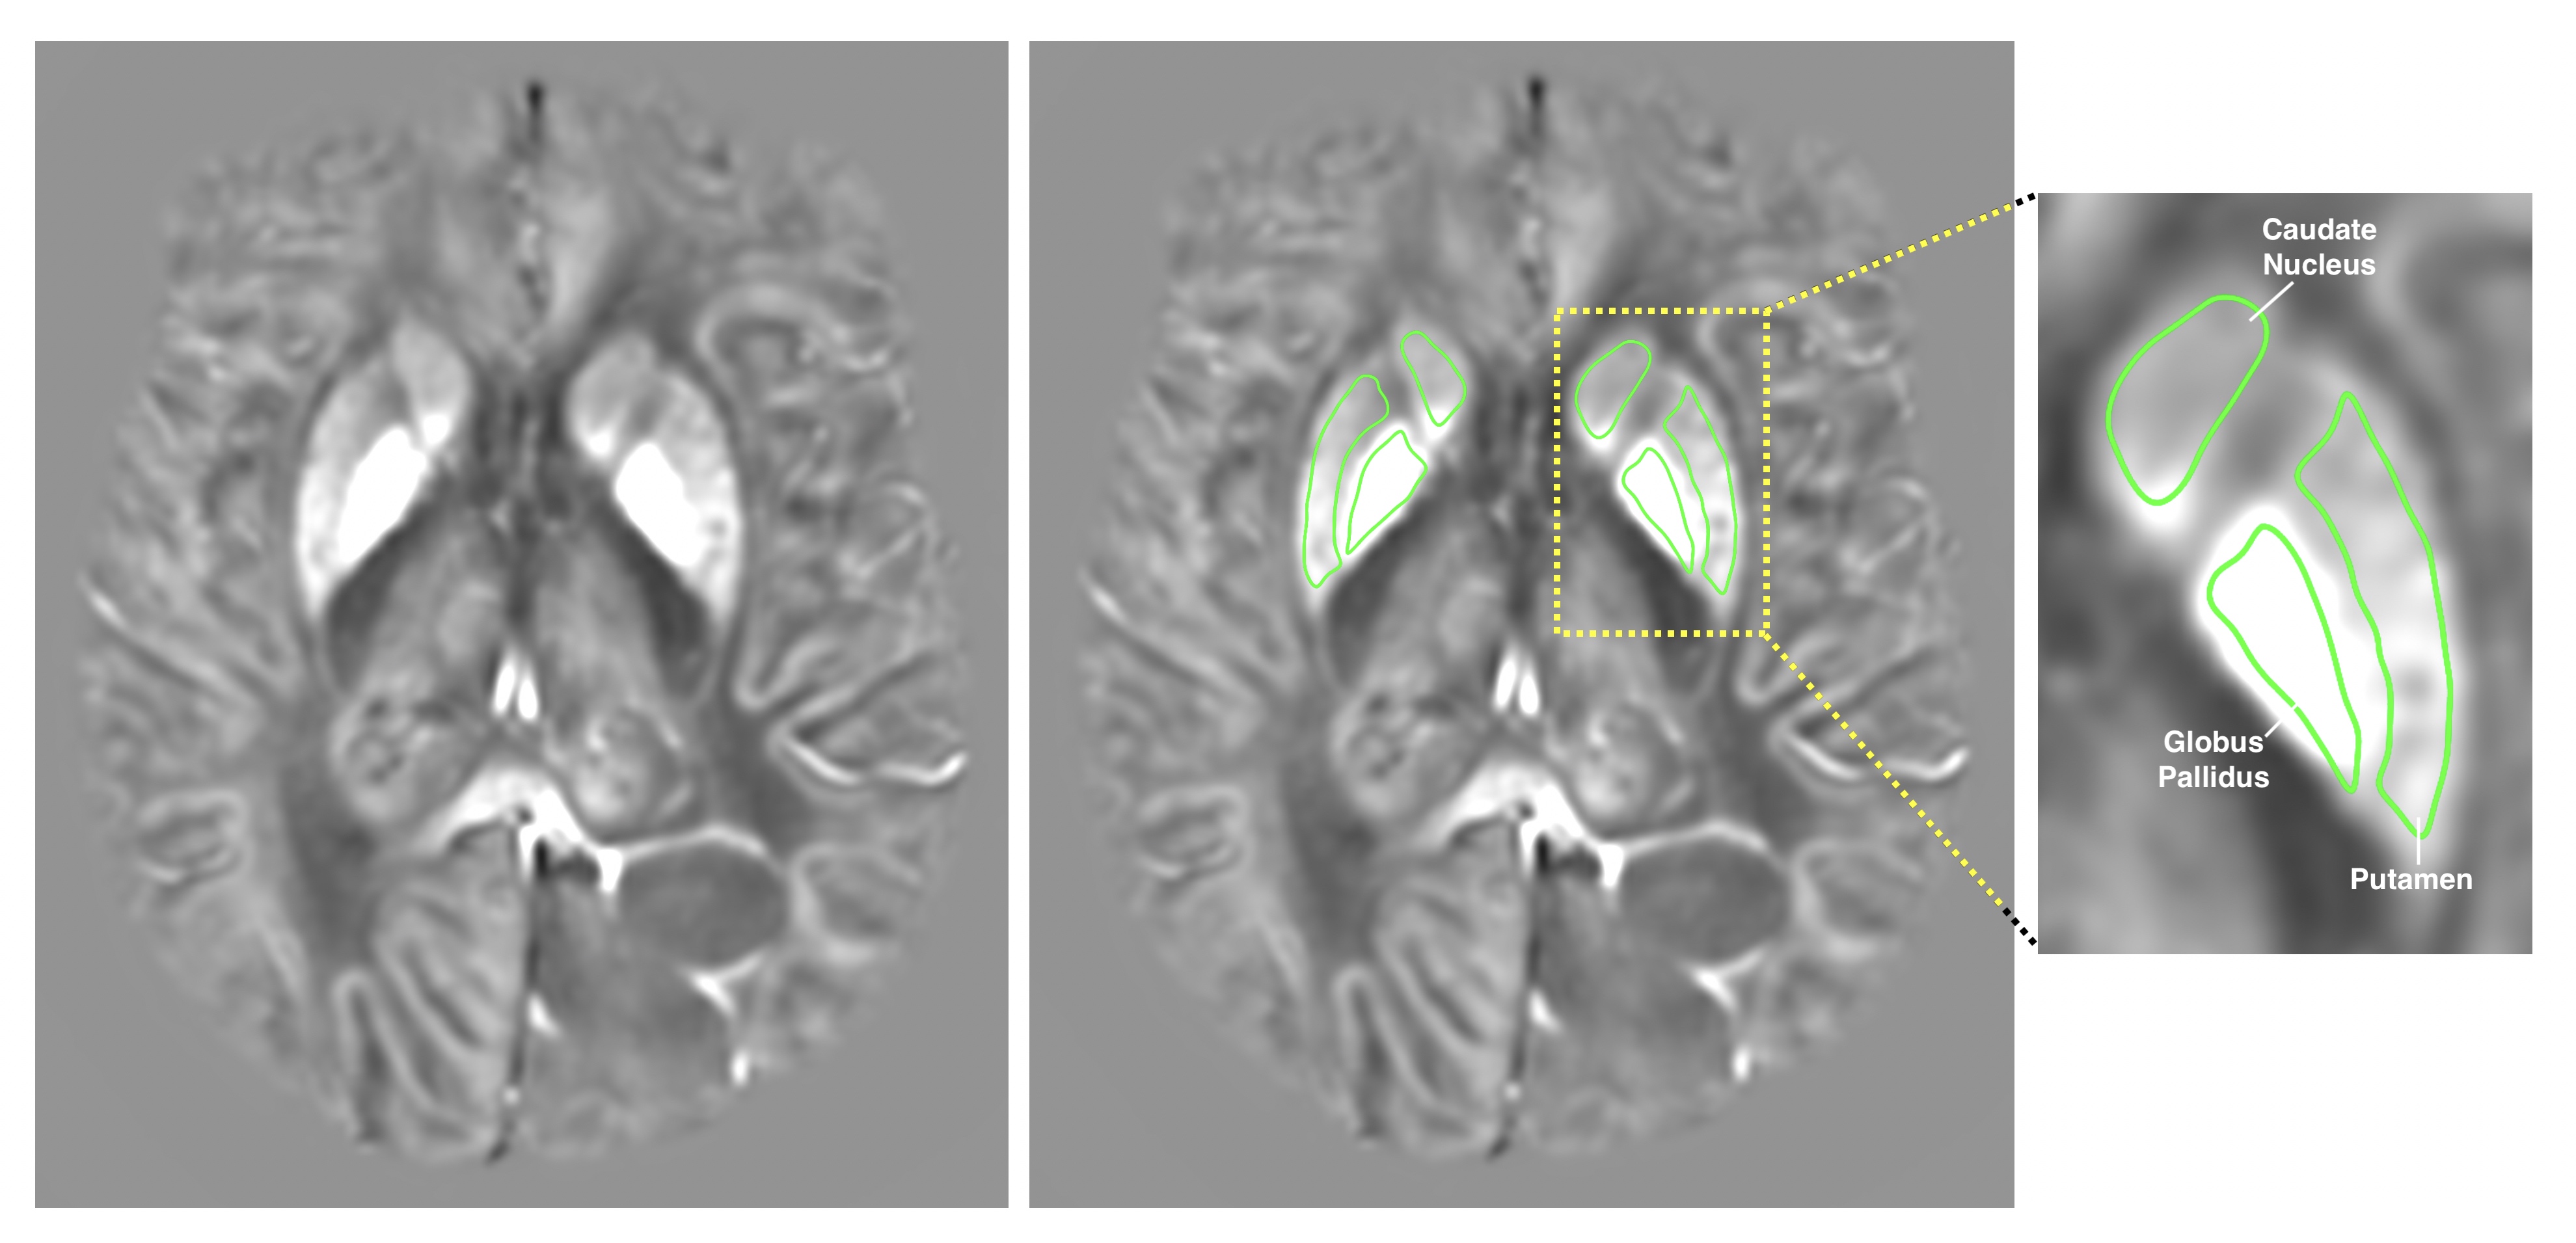
55 patients (28 males and 27 females) diagnosed with gliomas (33 astrocytomas, 17 oligodendrogliomas, 3 mixed oligo-astrocytomas, 2 gliosarcomas; 15 grade II, 16 grade III, 24 grade IV) and ranging from 20 to 84 years old were involved in this IRB-approved study. T1, T1+C, T2, T2-FLAIR, and susceptibility-weighted (SWAN) images were collected at 3.0T. QSM images were constructed using QSMNet+ and affinely co-registered to T1+C images using FMRIB’s Linear Image Registration Tool (FLIRT).7-9Regions of interest (ROIs) for the caudate, putamen, and globus pallidus were manually drawn on QSM images (Figure 1). Mean voxel intensities for all ROIs were averaged across multiple slices to obtain one QSM value per tissue type per patient. The resulting QSM values for the caudate, putamen, and globus pallidus were further averaged to obtain one overall BG QSM value for each patient.
Two-tailed t-tests were used to compare BG QSM values between groups of patients based on sex and tumor grade with sample size n ≥ 30. For samples with sample size n < 30, two-tailed Mann-Whitney U tests were used.
Results
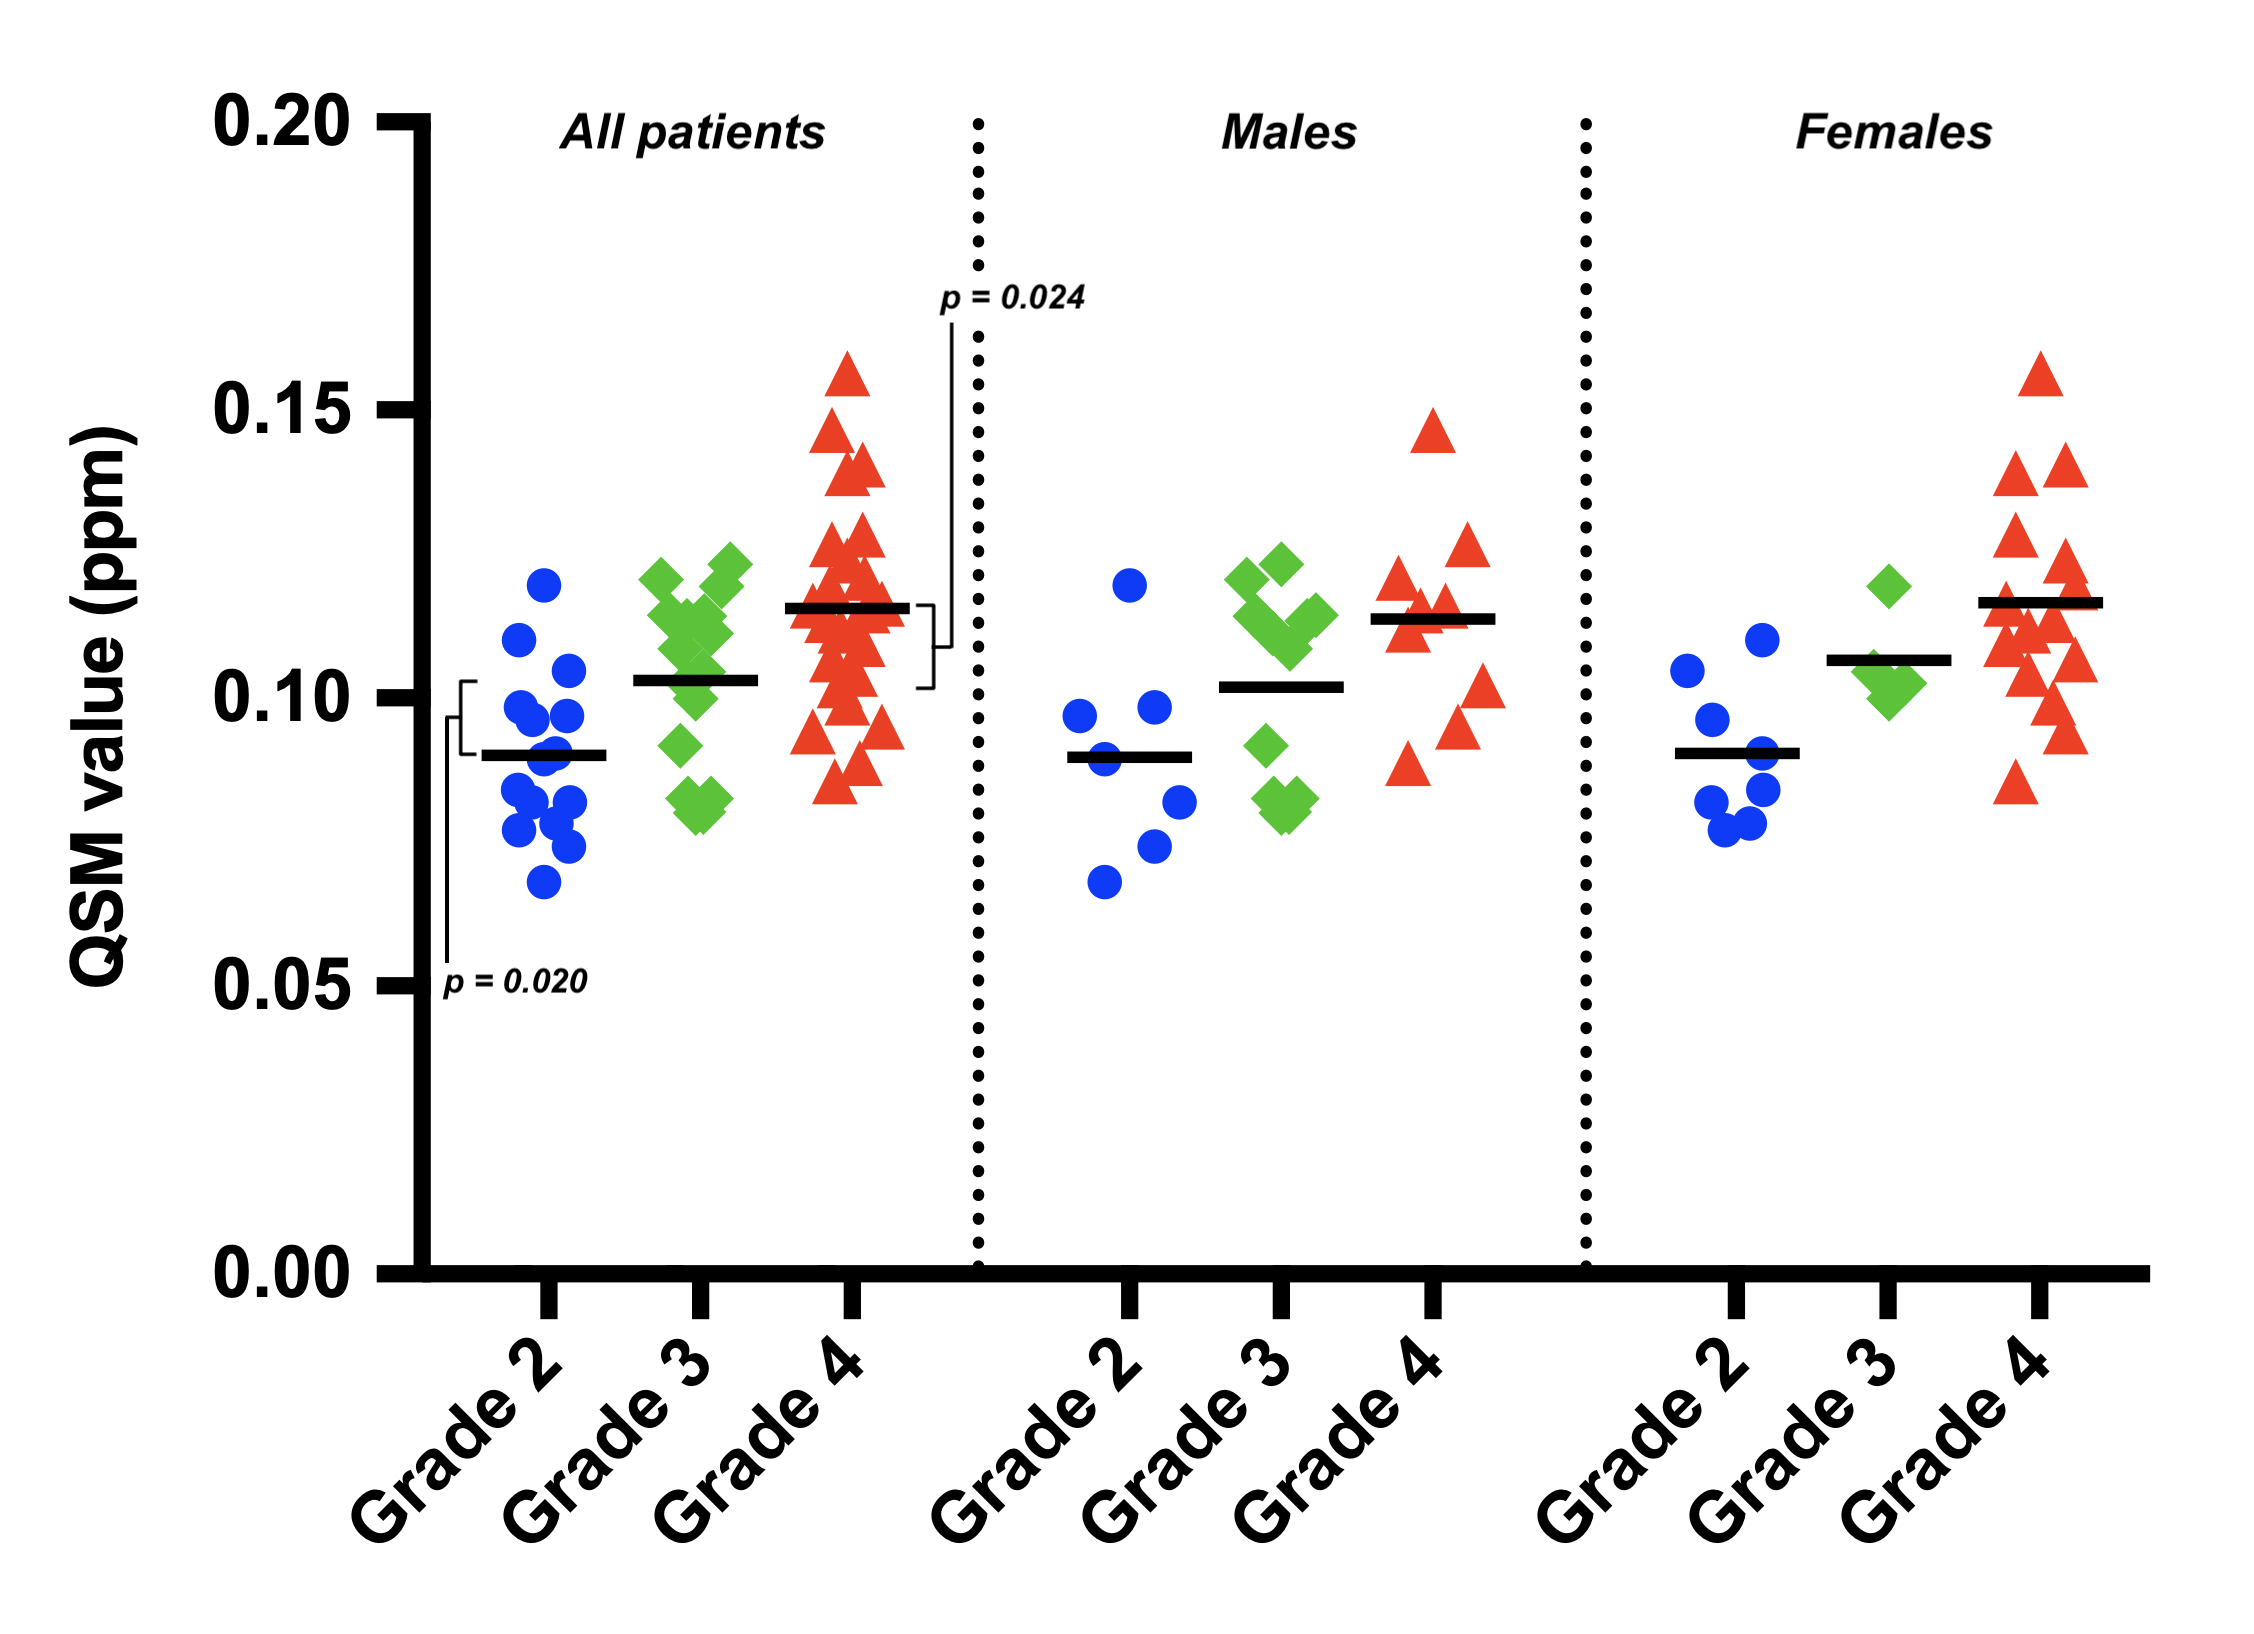
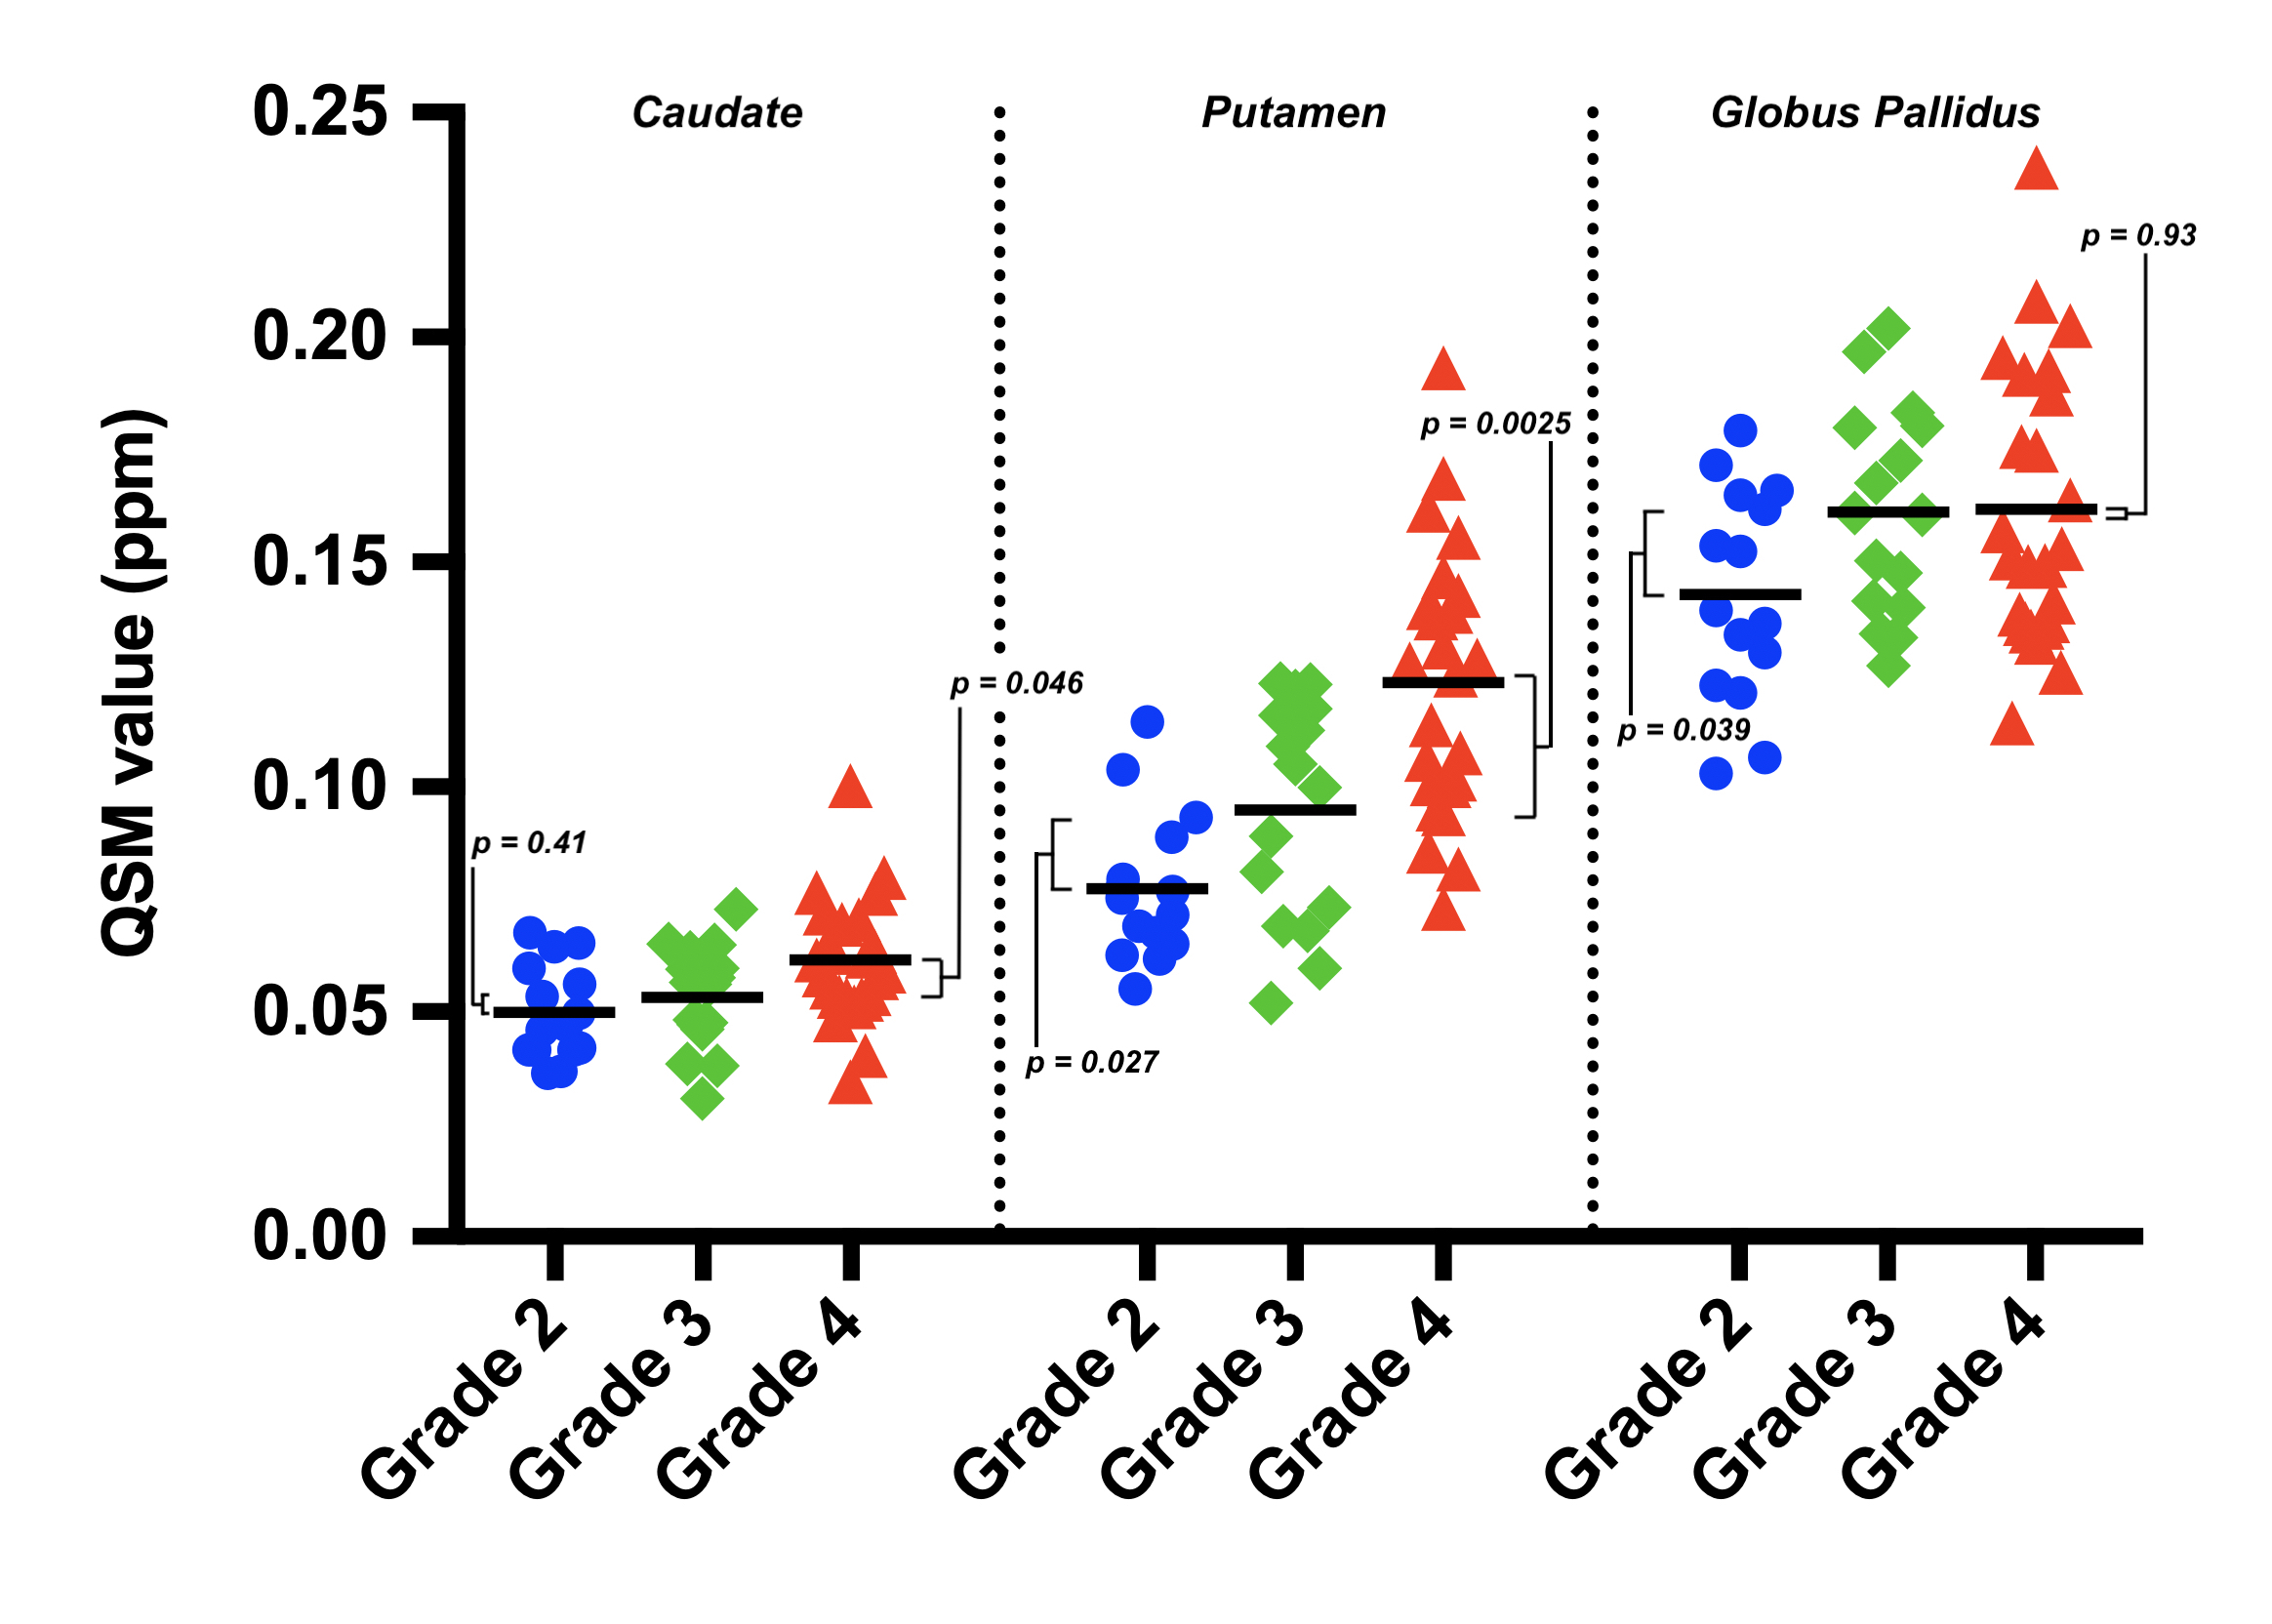
QSM values for patients with grade IV tumors were higher than for patients with grade III tumors (Figures 2 and 3). Differences were statistically significant for the overall BG (p = 0.024), caudate (p = 0.046), and putamen (p = 0.0025); but not for the globus pallidus (p = 0.93).QSM values for patients with grade III tumors were higher than for patients with grade II tumors (Figures 2 and 3). Differences were statistically significant for the overall BG (p = 0.020), putamen (p = 0.027), and globus pallidus (p = 0.039); but not for the caudate (p = 0.41).
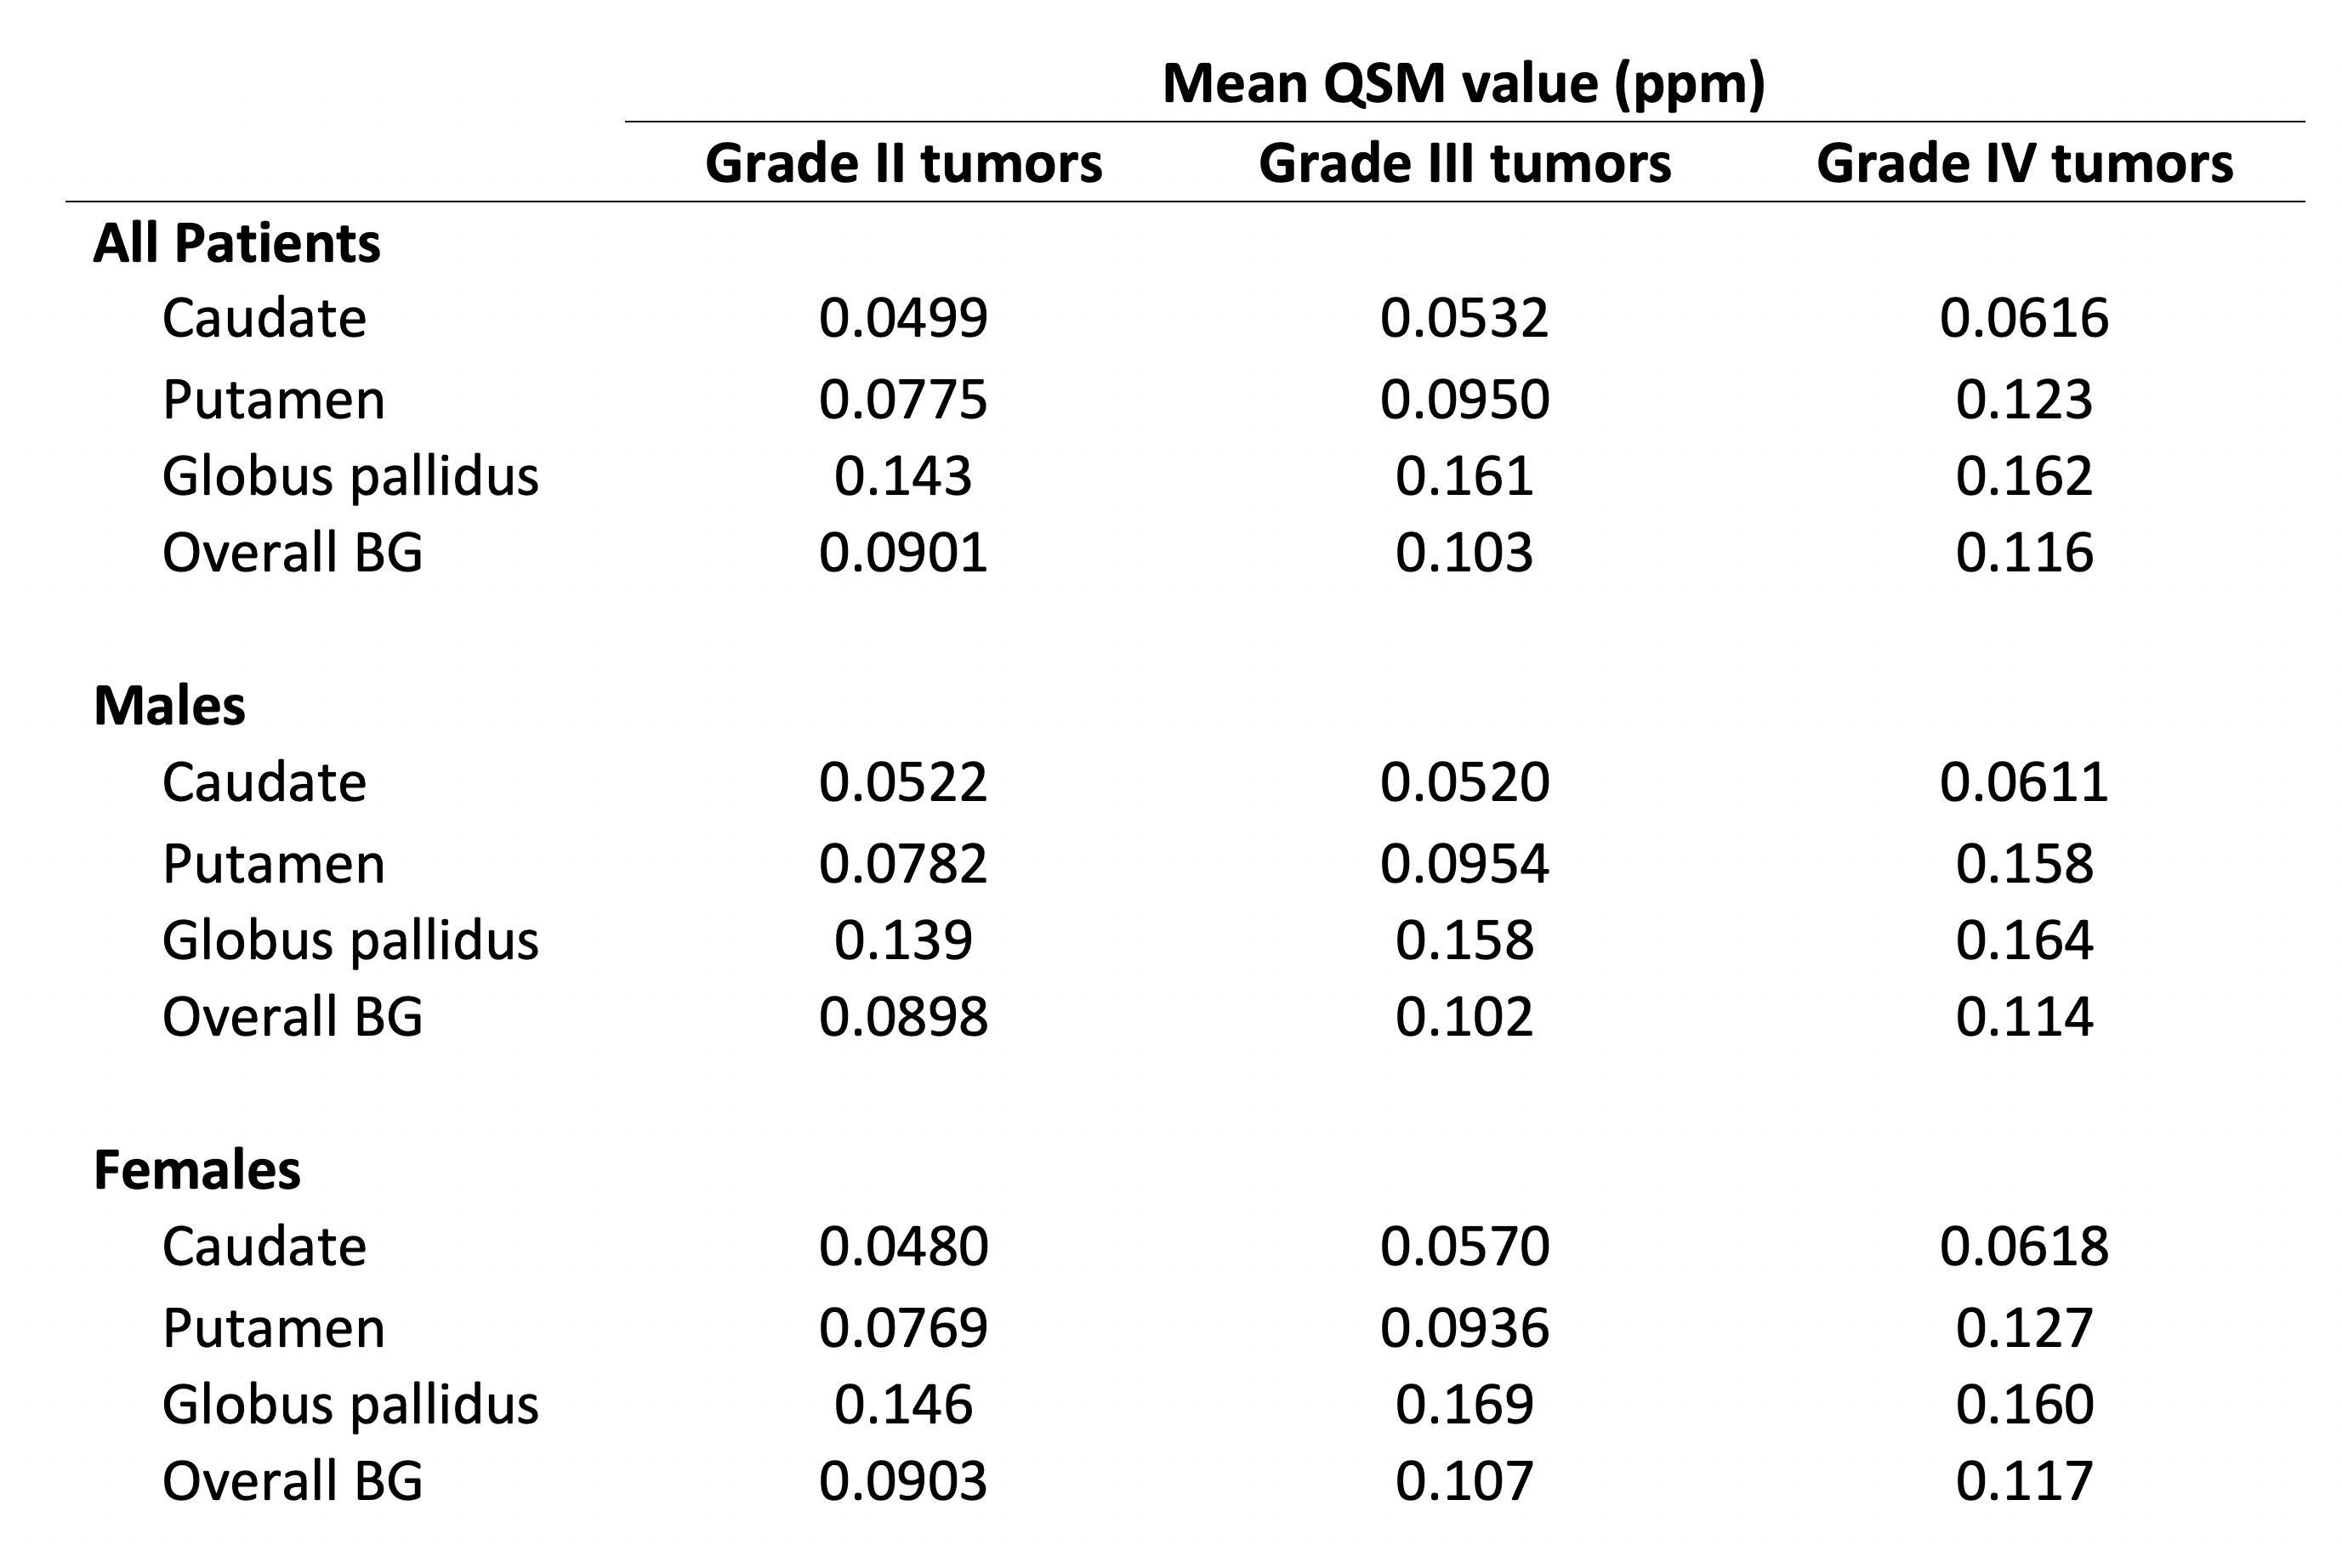
No significant differences in overall BG QSM values were found between males and females for tumors of any grade (p = 0.17, grade II; p = 0.90, grade III; p = 0.86, grade IV). QSM values for individual BG regions are reported in Table 1.
Discussion
In previous work, we identified a significant difference in BG iron content between patients with glioblastomas and tumors of lower grades.4 The present study – involving double the previous number of patients – expands upon the previous one to suggest that BG iron content differs between patients with tumors of grades II, III, and IV. In other words, BG iron content appears to directly correlate with tumor severity, demonstrating that increased iron trafficking may occur in healthy brain tissue as well as neoplastic tissue. The usage of QSMNet+ in the present study resulted in substantially improved image quality with fewer artifacts, lending further support to our findings. Our results are also supported by previously reported BG T2-shortening in brain tumor patients.10Compared with women, men have higher body iron stores and are more likely to present with symptoms of iron overload11; men are also more likely to develop gliomas.12 It is thus noteworthy that the BG iron accumulation observed in our study appears independent of gender. Although the mechanism by which this accumulation occurs is unclear, previous studies reporting increased ferritin levels in the cerebrospinal fluid of glioblastoma patients13 suggest CSF as one possibility. Future research is needed to further elucidate this phenomenon.
Conclusion
This study suggests that basal ganglia iron content directly correlates with glioma severity. BG iron levels may thus be a useful biomarker in glioma prognosis and treatment, especially with regards to iron-based cancer therapies. Furthermore, this study demonstrates the clinical utility of QSMnet+ to provide useful information about iron content in disease.Acknowledgements
We thank the Chasing Chad Foundation and NIH/NCI U01 CA176110 for funding and support.References
1. Voth B, Nagasawa DT, Pelargos PE, et al. Transferrin receptors and glioblastoma multiforme: Current findings and potential for treatment. J Clin Neurosci. 2015;22(7):1071-1076.
2. Chitambar CR, Al-Gizawiy MM, Alhajala HS, et al. Gallium Maltolate Disrupts Tumor Iron Metabolism and Retards the Growth of Glioblastoma by Inhibiting Mitochondrial Function and Ribonucleotide Reductase. Mol Cancer Ther. 2018;17(6):1240-1250.
3. Legendre C, Garcion E. Iron metabolism: a double-edged sword in the resistance of glioblastoma to therapies. Trends Endocrinol Metab. 2015;26(6):322-331.
4. Reith T, Wujek R, Karr R, Koch K, Al-Gizawiy M, Schmainda K. Basal ganglia iron deposition as a biomarker of brain tumor severity. In: Proceedings of the Annual Meeting and Exhibition of the International Society for Magnetic Resonance in Medicine. Montreal; 2019:0090.
5. Yoon J, Gong E, Chatnuntawech I, et al. Quantitative susceptibility mapping using deep neural network: QSMnet. NeuroImage. 2018;179:199-206.
6. Jung W, Yoon J, Choi JY, et al. Exploring linearity of deep neural network trained QSM: QSMnet+. arXiv preprint. arXiv:1909.07716v2 [eess.IV], Oct. 2019.
7. Jenkinson M, Bannister P, Brady M, Smith S. Improved optimization for the robust and accurate linear registration and motion correction of brain images. Neuroimage. 2002;17(2):825-841.
8. Jenkinson M, Smith S. A global optimisation method for robust affine registration of brain images. Med Image Anal. 2001;5(2):143-156.
9. Greve DN, Fischl B. Accurate and robust brain image alignment using boundary-based registration. Neuroimage. 2009;48(1):63-72.
10. Herynek V, Wagnerová D, Malucelli A, Vymazal J, Sameš M, Hájek M. Alterations in the basal ganglia in patients with brain tumours may be due to excessive iron deposition. Oncol Lett. 2015;9(1):43-46.
11. Harrison-Findik DD. Gender-related variations in iron metabolism and liver diseases. World J Hepatol. 2010;2(8):302-310.
12. Reardon DA, Rich JN, Friedman HS, Bigner DD. Recent Advances in the Treatment of Malignant Astrocytoma. J Clin Oncol. 2006;24(8):1253-1265.
13. Sato Y, Honda Y, Asoh T, Oizumi K, Ohshima Y, Honda E. Cerebrospinal fluid ferritin in glioblastoma: Evidence for tumor synthesis. J Neurooncol. 1998;40(1):47-50.
Figures