1691
An anatomic atlas of brain metastases: probability maps based on 13 primary cancer subtypes from post-contrast T1-weighted MRI of 955 patients1Imaging Physics, University of Texas MD Anderson Cancer Center, Houston, TX, United States, 2Neuroradiology, University of Texas MD Anderson Cancer Center, Houston, TX, United States, 3Radiation Physics, University of Texas MD Anderson Cancer Center, Houston, TX, United States, 4Radiation Oncology, University of Texas MD Anderson Cancer Center, Houston, TX, United States
Synopsis
Metastasis is regarded as a highly inefficient process in that less than 0.01% of circulating tumor cells eventually succeeds in forming secondary tumor growths. The seed and soil theory suggests that certain tumor cells have a specific affinity for the milieu of certain organs. Numerous studies have attempted to better understand the biology behind the distribution of brain metastasis and theories include both variables involving the metastasis and the target brain parenchyma. This work establishes probabilistic maps of locations where 13 primary cancer subtypes metastasize to the brain from T1-weighted MRIs of 955 patients undergoing stereotactic radiosurgery.
Introduction
Metastasis is regarded as a highly inefficient process in that less than 0.01% of circulating tumor cells eventually succeeds in forming secondary tumor growths [1]. Over a century ago, Paget studied whether the distribution of metastases was due to chance. His analysis of over 1000 autopsy records of women with breast cancer suggested a pattern of metastasis that was not random. This suggested that certain tumor cells have a specific affinity for the milieu of certain organs (seed and soil theory) [2]. Since that time numerous studies have attempted to better understand the biology behind the distribution of brain metastasis and theories include both variables involving the metastasis and the target brain parenchyma. The purpose of this work was to create probabilistic maps of locations where primary cancers metastasize to the brain from a large database of contrast-enhanced T1w brain MRIs across a range of cancer subtypes.Methods
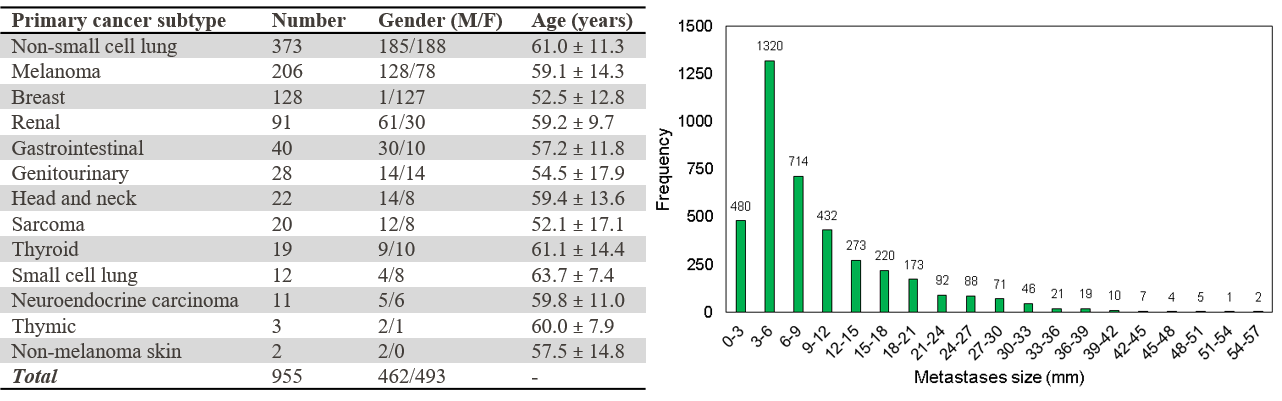
This retrospective study was performed under a HIPPA compliant and IRB approved protocol. Informed patient consent was waived. 955 patients undergoing gamma knife radiosurgery were included in this study. Each patient was scanned with a 3D post-contrast T1-weighted spoiled gradient recalled echo MR sequence. Typical scan parameters were: TR/TE = 6.9/2.6 ms, NEX = 2, flip angle = 12°, matrix size = 256×256, FOV = 24×24 cm, voxel size = 0.94×0.94×1.00 mm. A total of 3978 brain metastases were identified by three board-certified neuroradiologists and contoured by the treating board-certified radiation oncologists. The patient records and radiology reports were used to code the primary cancer subtypes into 13 sub-categories by a board-certified neuroradiologist (7 years of experience) (Figure 1).The MRIs and metastasis segmentation masks were converted from DICOM to NIFTI format for neuroimage analysis. The MRIs and corresponding metastasis segmentation masks were spatially normalized into standard MNI space (Montreal Neurological Institute, MNI152 atlas) at 1.0 mm isotropic resolution using SPM12 (Wellcome Department of Cognitive Neurology, Institute of Neurology, London, UK) and its default normalization and parameters. The registered segmentation masks were grouped by the corresponding primary cancer subtype. The segmentation masks were superimposed to create probability maps of voxel-wise metastasis location frequency (normalized by the number of metastases used to create each probability map). Heat maps were constructed and overlaid on a representative T1w brain image for anatomical visualization and comparison.
Clusters of metastases were identified by finding overlapping voxel regions on the probability maps. The anatomic brain regions of the clusters were identified from the superimposed heat map and MRI. Differences in metastases location were identified, and the probability of metastases locations were computed for different brain regions across the 13 primary cancer subtypes.
Results
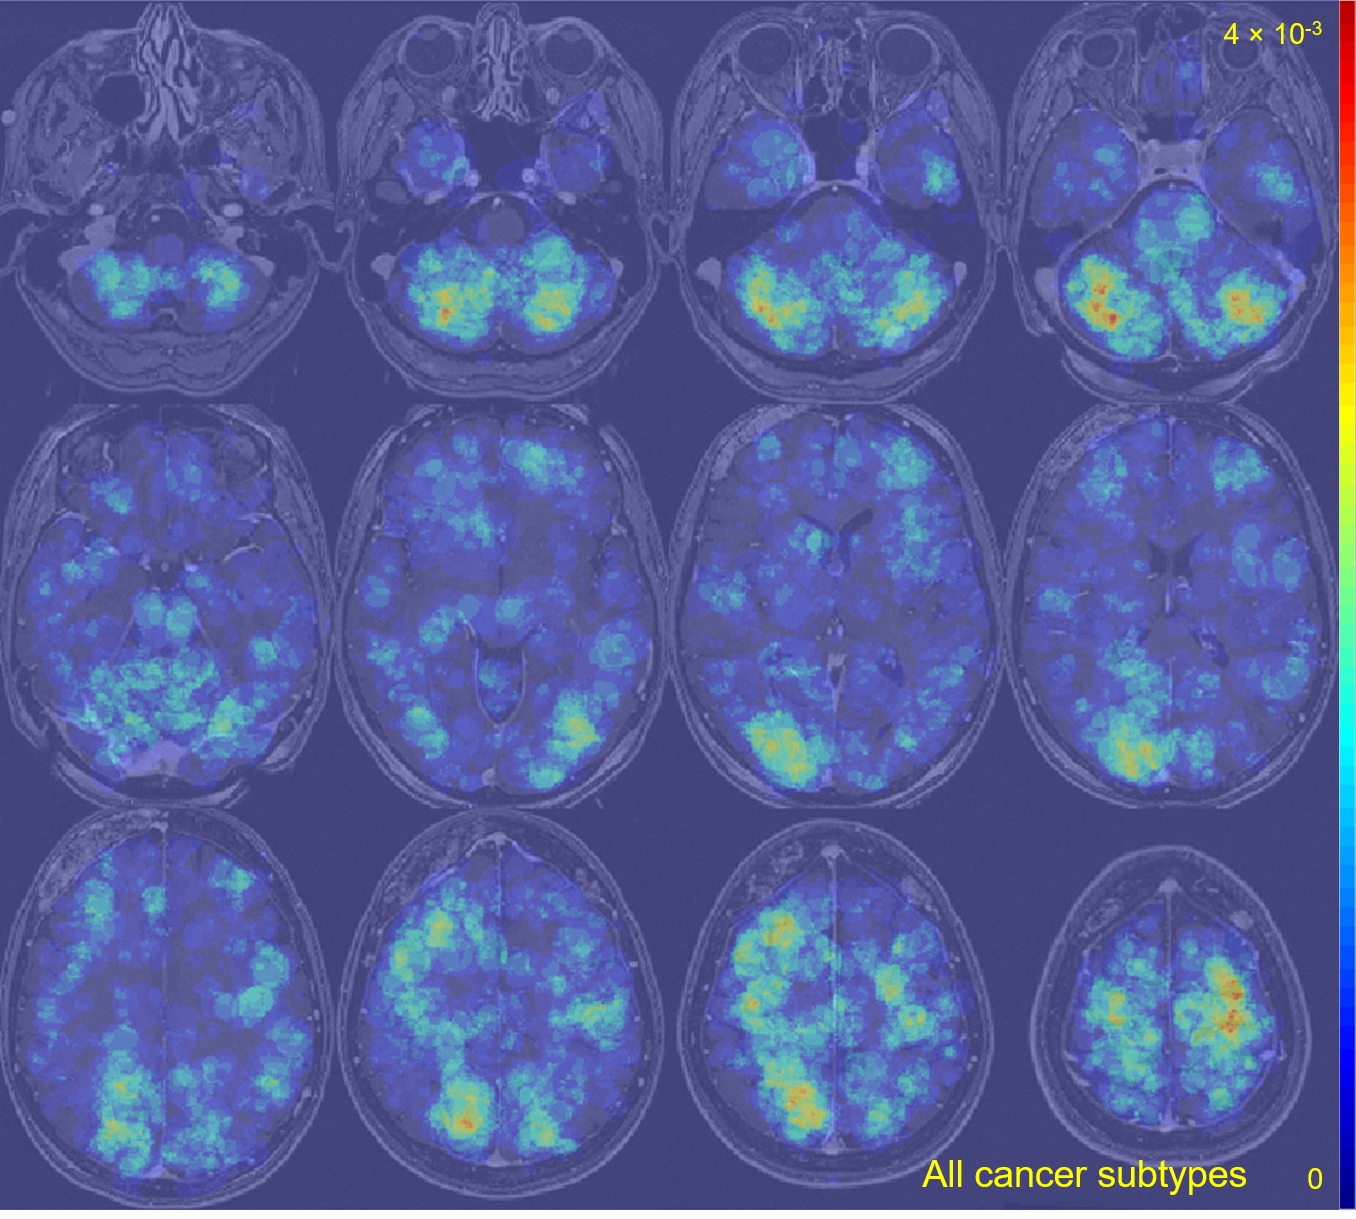
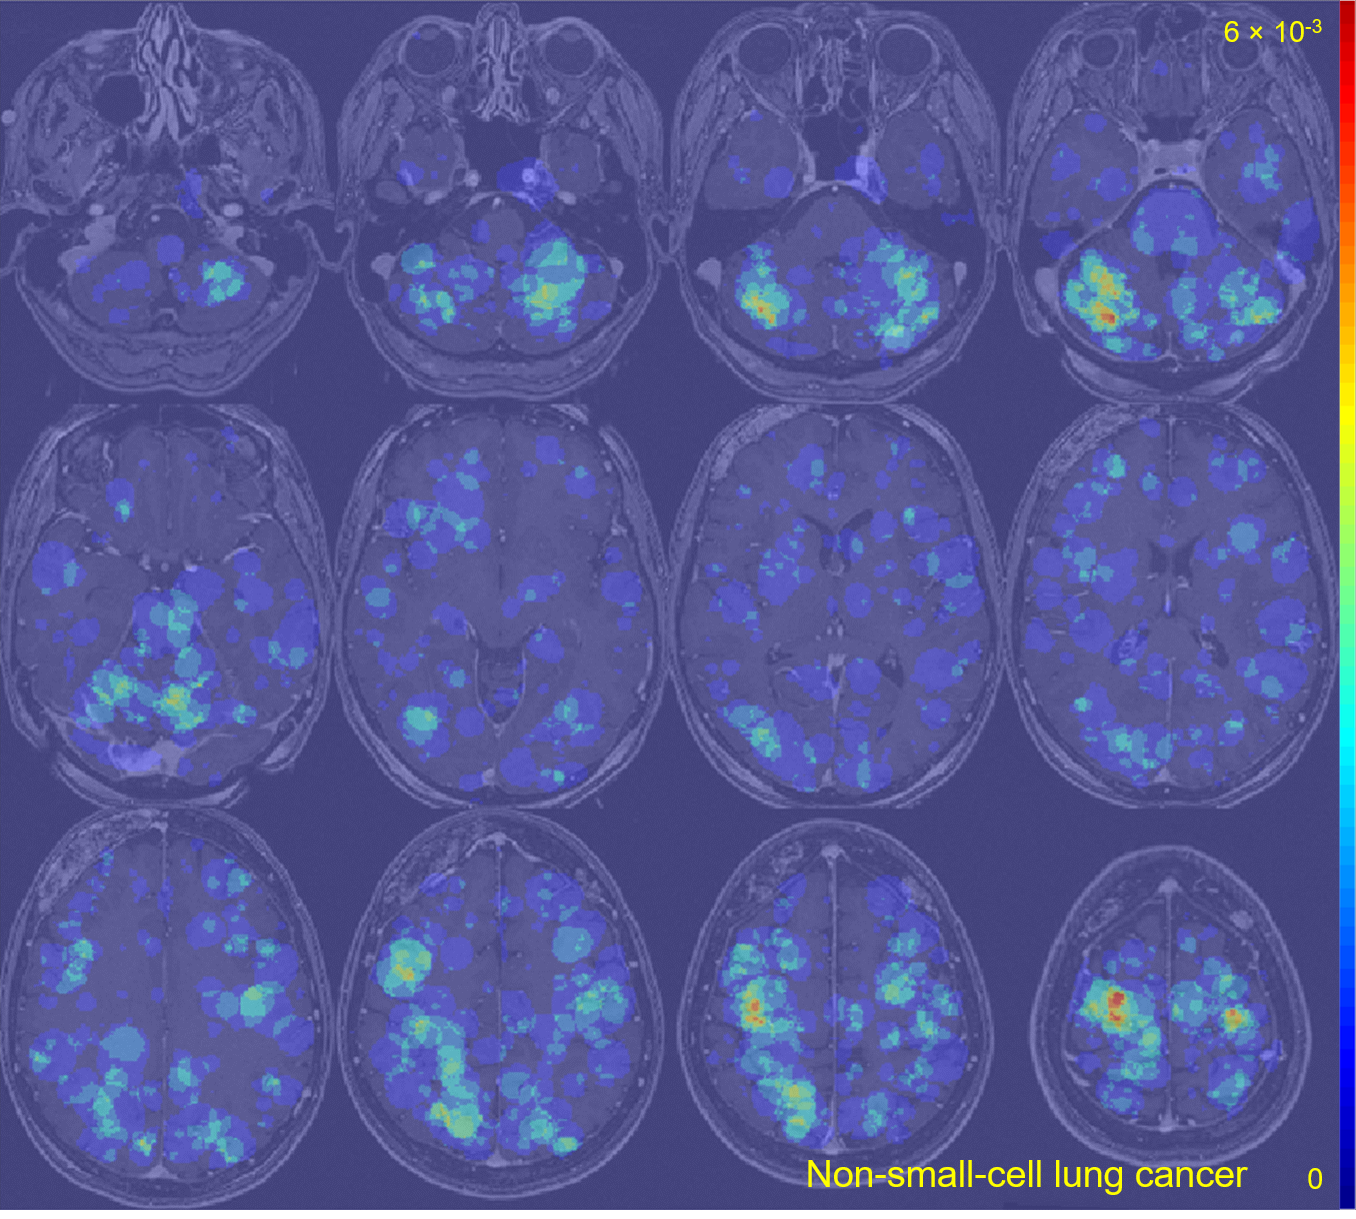
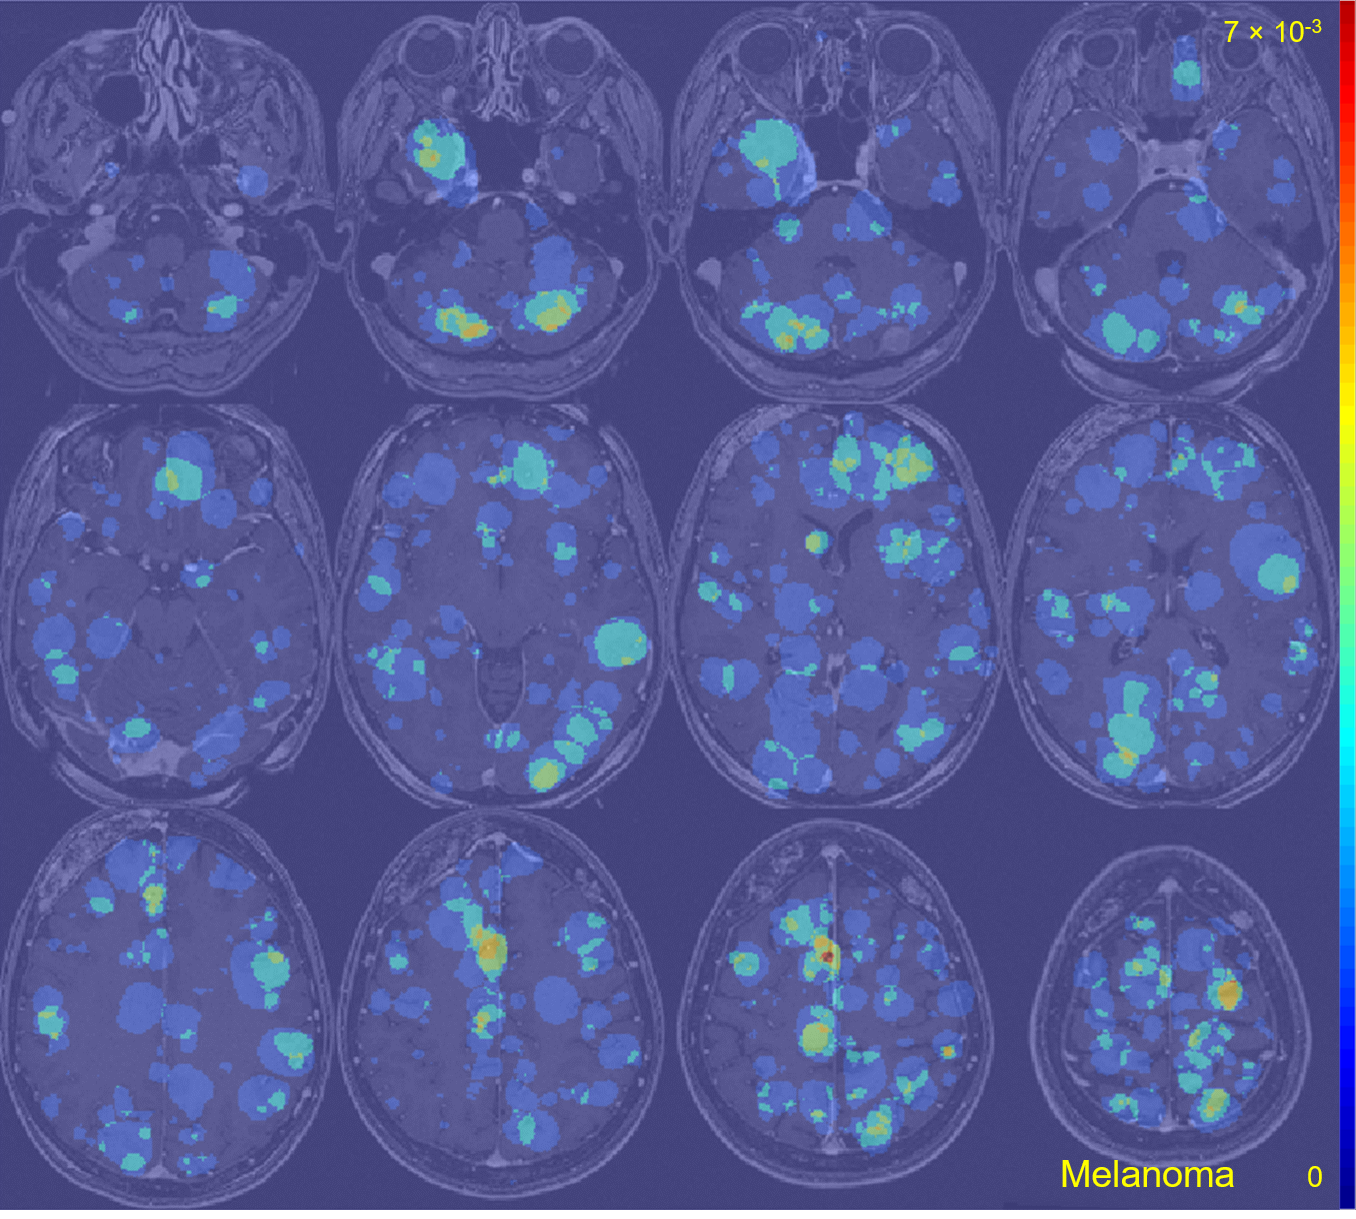
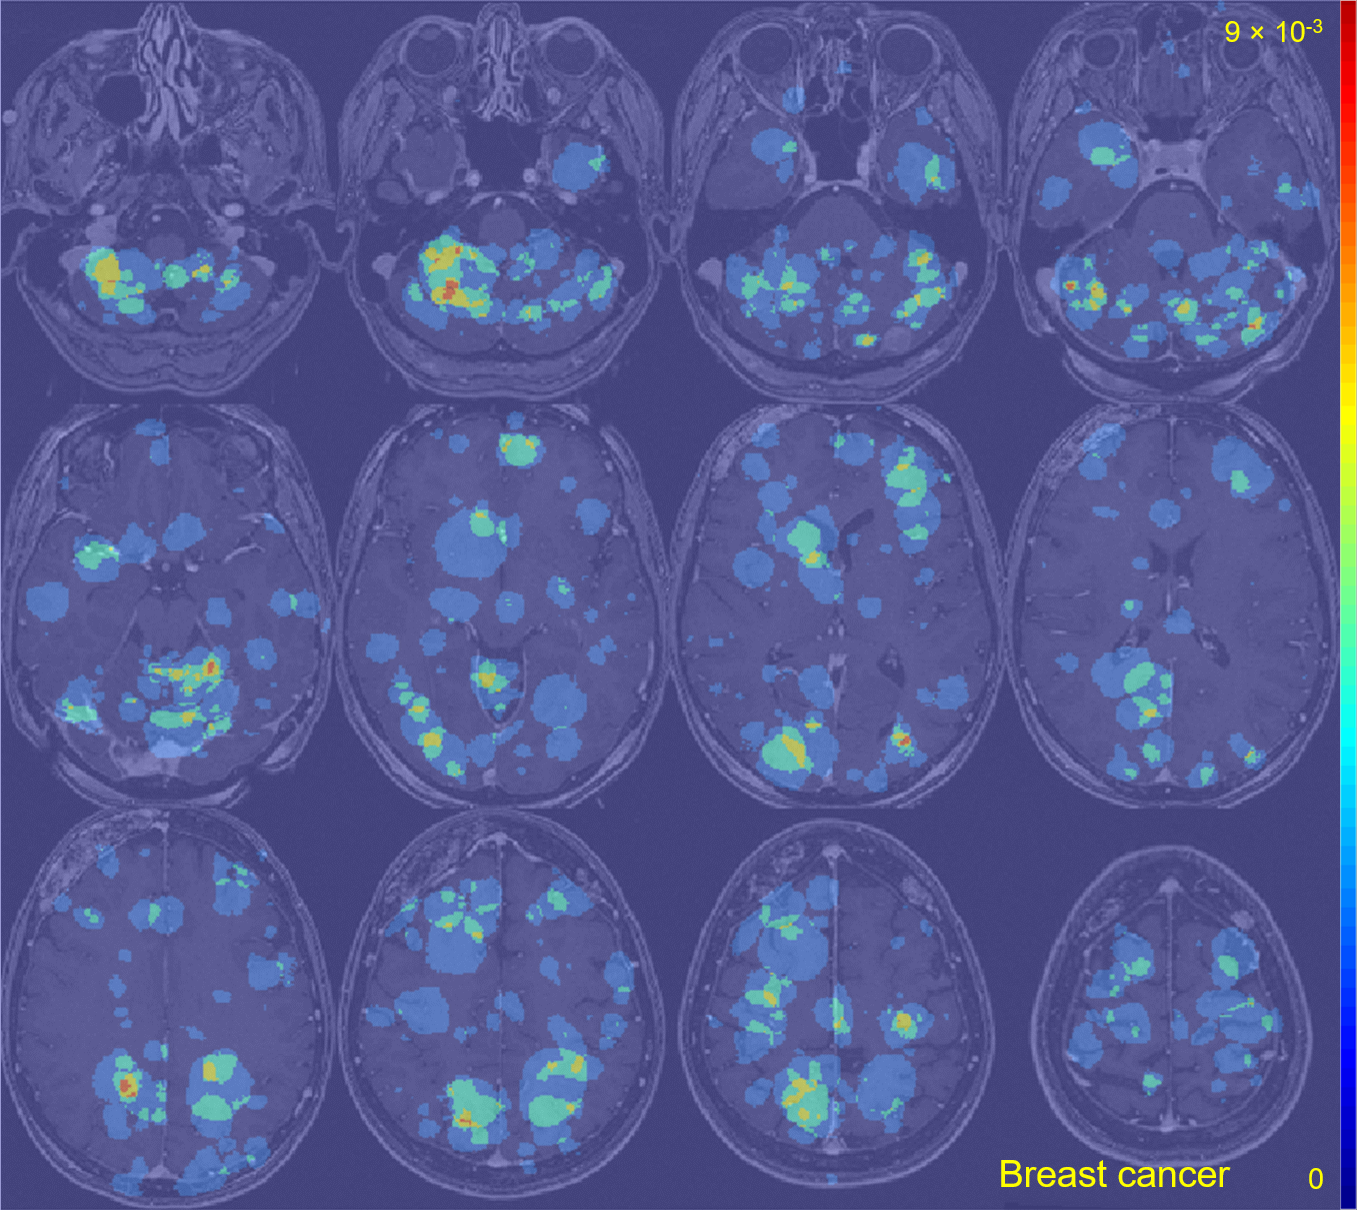
The average metastasis volume was 900.2 ± 2238.3 mm3 (skewness = 4.7). Each patient had an average of 4.2 ± 3.4 metastases (skewness = 2.1) (Figure 1). Although many metastases locations appeared to be random, the probability map containing metastases locations from all 13 cancer subtypes combined showed brain regions with distinct clustering in the cerebellum, right occipital lobe, and left and right areas of the frontal lobe (Figure 2). Subgroups analysis of metastasis distribution revealed differences between non-small-cell lung carcinoma (NSCLC) (cerebellum and convexity predominance) (Figure 3), melanoma (random distribution) (Figure 4), and breast cancer (cerebellum and occipital lobe predominance) (Figure 5). Other metastatic groups were not as rigorously analyzed due to their smaller sample sizes.Discussion and conclusion
Prior investigations into the distribution of brain metastases were limited due to sample size and time intensive localization methodology. We have successfully demonstrated the ability to visualize the spatial distribution of a large number of metastatic brain lesions (3978 total metastases) in nearly a thousand patients with division by cancer type. Differential regions of clustering were identified for the three major cancer subtypes (NSCLC, melanoma, and breast). Regions of clustering, as well as regions absent of clustering, are of interest in refining the “seed and soil” theory in large datasets and provides the opportunity to further investigate novel hypotheses such as molecular cancer subtype (for example, ER/PR/Her2Neu status), gender, and chemotherapy type.Acknowledgements
No acknowledgement found.References
[1] Fidler IJ. “Metastasis: quantitative analysis of distribution and fate of tumor emboli labeled with 125I-5-iodo-2′-deoxyuridine,” Journal of the National Cancer Institute, 1970: 45(4); 773-782.
[2] Paget S. “The distribution of secondary growths in cancer of the breast,” Lancet, 1889: 1; 571-573.
Figures