1687
Investigating CSF Flow in Amnestic Mild Cognitive Impairment: A Preliminary Report1Physics, University of Rochester, Rochester, NY, United States, 2Neurology, University of Rochester, Rochester, NY, United States, 3Neuroscience, University of Rochester, Rochester, NY, United States, 4Imaging Sciences, University of Rochester, Rochester, NY, United States
Synopsis
Amnestic MCI (aMCI) is a prodromal stage to Alzheimer's Disease (AD), with around 10-15% of patients with aMCI converting to AD per year. It is unclear what mechanisms are involved in the initiation and progression through aMCI. One hypothesis involves the “glymphatic” system, a hypothesized pathway mediated by Cerebrospinal Fluid (CSF) flow that is essential to clearing toxins and cellular debris from the brain. In this study, we analyze how CSF flow dynamics are altered in subjects with aMCI. Overall, we found that lower flow in the 4th ventricle is linked with increased disease burden.
Introduction
It has been suggested that Alzheimer’s Disease (AD) exists on a continuum1, 2. Amnestic MCI (aMCI) is a prodromal stage to AD, referring to patients whose main symptom is memory loss3, 4; around 10-15% of these patients progress to AD every year5, 6. It is unclear what mechanisms are involved in the initiation and progression through aMCI. One hypothesis involves the “glymphatic” system7, a hypothesized pathway mediated by Cerebrospinal Fluid (CSF) flow that is essential to clearing toxins and cellular debris from the brain. Murine models suggest that impaired exchange between CSF and Interstitial Fluid (ISF) lead to CSF flow disturbances and is implicated in both aging and AD8. CSF flow measurements utilizing Phase Contrast MRI (PC-MRI) have shown alterations exist in aMCI9 and are related to decreases in verbal fluency in AD10. In this study, we utilize PC-MRI in the aMCI population in the context of multi-model image acquisition to understand the association of CSF with evolving pathology.Methods
Currently, we have scanned 7 subjects with aMCI as part of the Aerobic exercise and cognitive training (ACT) trial (NIA AG055469). These patients ages range from 60-90 and have been diagnosed with aMCI, as per the 2011 Alzheimer’s Association-NIA criteria11. All patients have a T1 MPRAGE (1x1x1 mm, TR/TE = 1400/2.34 ms, GRAPPA 2), 3D FLAIR (1x1x1 mm, TR/TE=4800/441 ms), diffusion MRI (dMRI) (1.5x1.5x1.5 mm, TR/TE=3500/62 ms, GRAPPA 2, MB 3, 64 b=1000 vectors, 3 b=0), resting state functional MRI (2x2x2 mm, TR/TE=1010/44 ms, MB 8, 300 measurements), and 3D T2 FLAIR (1x1x1 mm, TR/TE=4800/441 ms). In addition, we acquire a cardiac-gated PC-MRI at the level of the 4th ventricle and cerebral aqueduct (0.625x0.625x6 mm, TR/TE = 2108/6.38 ms, venc = 10 cm/s in 4th ventricle, 25 cm/s in cerebral aqueduct, 1 slice). All scanning is completed on a 3T Siemens Prisma Scanner (Erlangen, Germany).PC-MRI data at the 4th ventricle and cerebral aqueduct are used to derive a measure we define as CSF flow ratio, the ratio of forward (craniocaudal) to backward (caudocranial) flow12. The dMRI is analyzed using a population-based connectome extraction pipeline described in Zhang et al13. Briefly, the dMRI data are preprocessed to correct for susceptibility distortions and eddy currents and input to a probabilistic tractography algorithm14. The T1 is parcellated according to the Desikan atlas using FreeSurfer15, which is used to parcellate the tractography to generate a connectivity matrix. Network statistics are calculated from the binarized streamline matrix created by thresholding below 20 streamlines. In addition, volBrain16 is used with the T1 and FLAIR to identify White Matter Hyperintensities (WMHs), which is used to calculate free-water volume using the free-water correction Diffusion Tensor Imaging (fwcDTI) reconstruction method17, 18. volBrain is also used to calculate the hippocampal volume as a marker of disease progression. Finally, the FreeSurfer-derived cortical thickness is used to derive the AD Cortical Thickness Score19, a value that is seen to correspond to neuropsychological scoring in AD.
Results
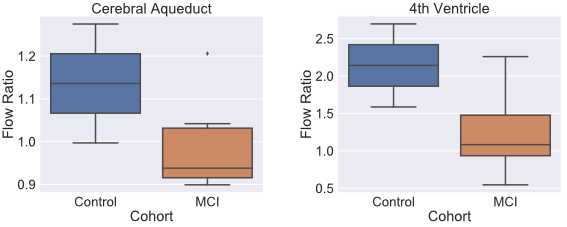
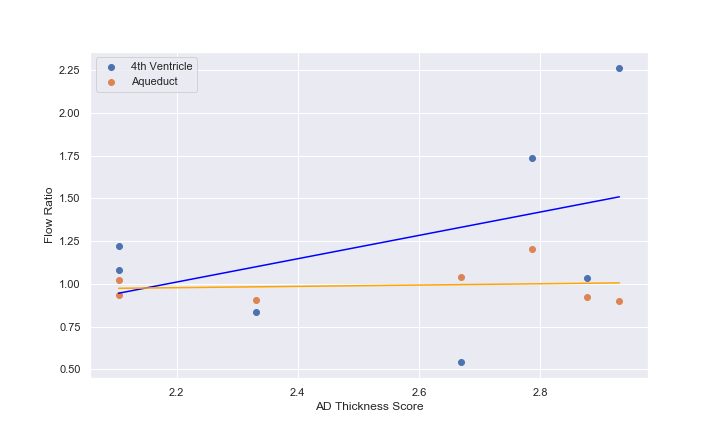
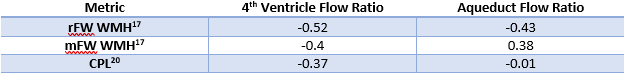
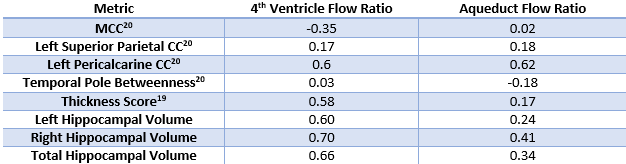
Figure 1 shows the results of PC-MRI derived flow ratio in the cerebral aqueduct and the 4th ventricle between the old control (n=2, ages=63,67) and aMCI groups (n=7, age range 67-78). Figure 2 shows the relationship between the PC-MRI measures and the AD Cortical thickness score. Table 1 shows the correlation coefficients between flow ratio and various multi-modal measures that have been seen to be positively correlated with increasing disease severity after controlling for age. Table 2 shows a similar table for multi-modal measures that are negatively correlated with increasing disease severity.Discussion
There is a decrease in CSF flow ratio between the old control and aMCI cohort at the 4th ventricle (Figure 1, Right Panel). We also see that the aMCI cohort has a lower flow ratio in the aqueduct than the healthy groups, suggesting that changes in CSF flow ratio in the aqueduct is more specific for aMCI due to the lack of change in normal aging21. Further analysis shows that while the 4th ventricle flow ratio seems to have a meaningful correlation with AD Thickness Score derived from the T1 (Figure 2, orange dots), the cerebral aqueduct flow ratio does not; this finding is consistent with previous findings that aqueduct CSF flow is not influenced by the amount of atrophy21. Furthermore, it suggests that the 4th ventricle flow ratio and the aqueduct flow ratio may be sensitive to separate processes in AD. This is partially seen in Table 1, where the mean free water in WMH is negatively related to 4th ventricle flow ratio (ρ = -0.4), but positively related with aqueduct flow ratio (ρ = 0.38). The relationship will be further studied if it remains after collection of all 40 subjects. Table 2 also showed significant relationships between flow ratio in both the 4th ventricle and aqueduct and the left pericalcarine CC (ρ = 0.6, 0.62 for 4th ventricle, aqueduct), which predicts future atrophy20.Conclusion
sed on our preliminary analysis, we have found that CSF flow ratio in the 4th ventricle and cerebral aqueduct show likely changes relating to AD disease burden. Future work will focus on collecting more data and understanding how CSF measures relate to evolution of aMCI into AD.Acknowledgements
We would like to acknowledge the participants and study coordinators involved with this study.References
1. Goldman, W.P., et al., Absence of cognitive impairment or decline in preclinical Alzheimer's disease. Neurology, 2001. 56(3): p. 361-7.
2. Aisen, P.S., et al., On the path to 2025: understanding the Alzheimer's disease continuum. Alzheimers Res Ther, 2017. 9(1): p. 60.
3. Petersen, R.C., Mild cognitive impairment as a diagnostic entity. J Intern Med, 2004. 256(3): p. 183-94.
4. Petersen, R.C., et al., Current concepts in mild cognitive impairment. Arch Neurol, 2001. 58(12): p. 1985-92.
5. Petersen, R.C., et al., Mild cognitive impairment: clinical characterization and outcome. Arch Neurol, 1999. 56(3): p. 303-8.
6. Tierney, M.C., et al., Prediction of probable Alzheimer's disease in memory-impaired patients: A prospective longitudinal study. Neurology, 1996. 46(3): p. 661-5.
7. Iliff, J.J., et al., A paravascular pathway facilitates CSF flow through the brain parenchyma and the clearance of interstitial solutes, including amyloid beta. Sci Transl Med, 2012. 4(147): p. 147ra111. 8. Zeppenfeld, D.M., et al., Association of Perivascular Localization of Aquaporin-4 With Cognition and Alzheimer Disease in Aging Brains. JAMA Neurol, 2017. 74(1): p. 91-99.
9. El Sankari, S., et al., Cerebrospinal fluid and blood flow in mild cognitive impairment and Alzheimer's disease: a differential diagnosis from idiopathic normal pressure hydrocephalus. Fluids Barriers CNS, 2011. 8(1): p. 12.
10. Attier-Zmudka, J., et al., Decreased Cerebrospinal Fluid Flow Is Associated With Cognitive Deficit in Elderly Patients. Front Aging Neurosci, 2019. 11: p. 87.
11. Albert, M.S., et al., The diagnosis of mild cognitive impairment due to Alzheimer's disease: recommendations from the National Institute on Aging-Alzheimer's Association workgroups on diagnostic guidelines for Alzheimer's disease. Alzheimers Dement, 2011. 7(3): p. 270-9.
12. Venkataraman, A., Deane, R., Zhong, J. CSF Flow and Aging: An Early Marker of Pathology? in ISMRM. 2019. Montreal.
13. Zhang, Z., et al., Mapping population-based structural connectomes. Neuroimage, 2018. 172: p. 130-145.
14. Girard, G., et al., Towards quantitative connectivity analysis: reducing tractography biases. Neuroimage, 2014. 98: p. 266-78.
15. Fischl, B., FreeSurfer. Neuroimage, 2012. 62(2): p. 774-81.
16. Manjon, J.V. and P. Coupe, volBrain: An Online MRI Brain Volumetry System. Front Neuroinform, 2016. 10: p. 30.
17. Dumont, M., et al., Free water in white matter differentiates MCI and AD from control subjects. BioRxiv, 2019: p. 537092.
18. Pasternak, O., et al., Free water elimination and mapping from diffusion MRI. Magn Reson Med, 2009. 62(3): p. 717-30.
19. Busovaca, E., et al., Is the Alzheimer's disease cortical thickness signature a biological marker for memory? Brain Imaging Behav, 2016. 10(2): p. 517-23.
20. Nir, T.M., et al., Connectivity network measures predict volumetric atrophy in mild cognitive impairment. Neurobiol Aging, 2015. 36 Suppl 1: p. S113-20.
21. Barkhof, F., et al., Phase-contrast cine MR imaging of normal aqueductal CSF flow. Effect of aging and relation to CSF void on modulus MR. Acta Radiol, 1994. 35(2): p. 123-30.
Figures